Estimating the accuracy of smartphone app-based removal estimates against actual wood-harvesting data from clear cuttings
iForest - Biogeosciences and Forestry, Volume 17, Issue 3, Pages 140-147 (2024)
doi: https://doi.org/10.3832/ifor4377-017
Published: May 14, 2024 - Copyright © 2024 SISEF
Research Articles
Abstract
Trestima® is a computer vision-based smartphone application that utilises relascope theory to obtain estimates of forest attributes from smartphone photographs. The aim of this study was to investigate the accuracy of Trestima estimation and evaluate whether it is sufficiently accurate for operational use in forestry. Our data consisted of 37 forest stands, encompassing 73.5 ha in southeastern Finland, where Trestima estimates were obtained by forestry professionals during their work. The results were compared with harvester data obtained from clear-cut stands. The number of photographs taken per stand ranged between 1-29 (average: 7.3; standard deviation: 5.0). The total amount of industrial roundwood harvested from the stands was 21.531 m3 and the average harvest removal per hectare was 282 m3. The accuracy of Trestima estimation was relatively good when ≥ 10 photographs per stand were taken. In this case, the root mean square error percent (RMSE%) value associated with roundwood volume was 17.7%. When the number of photographs per stand was < 10, the accuracy of Trestima was much weaker (RMSE% 22.7-55.3%). On average, Trestima underestimated harvested volumes in Scots pine (Pinus sylvestris L.) stands (Bias% 11.4-89.2), although the bias was smaller (Bias% -12.7-12.4) with Norway spruce (Picea abies [L.] Karst.) stands. The Trestima smartphone application is a possible option for traditional field measurements in operational forestry, provided that its usage instructions are strictly followed, which is not always the case in practice.
Keywords
Forest Inventory, Forest Mensuration, Smartphone, Machine Vision, Computer Vision, Relascope, Harvester Data
Introduction
Stand-level forest management inventories in Finland are usually implemented by the utilisation of remotely sensed data, local field sample plots, and the k-nearest neighbour method ([21]). In management-oriented inventories of Finnish forests, airborne laser scanning (ALS) is the main method of information collection. In all types of ALS-based forest resource inventories, field training data are necessary to connect models related to forest stand attributes, such as timber volume, to remotely-sensed metrics ([22]). However, field work is laborious and expensive, and can represent a substantial part of overall inventory costs. While wood purchasing organisations and buyers need pre-harvest information on tree species-specific log length-top diameter distribution and log quality ([32]), many studies have shown that the information gathered with remote sensing methods has failed to be sufficiently accurate for pre-harvest stand measurements ([46], [11]).
In recent years, other sources of information for forest resource inventory have started to emerge, such as computer vision-based smartphone applications. The use of smartphones for forest measurements, in particular, has been studied intensively ([49], [6], [7], [23], [44], [2], [16], [32]) due to the development of advanced remote sensors and computer vision ([49]). Non-contact methods of measuring diameter at breast height (DBH) can be divided into active and passive ranging methods ([20]). Active methods, such as terrestrial laser scanning (TLS), require special equipment and expertise, which limits their use in daily practice ([19]), although lately there have been personal laser scanning based developments in this area that have made active methods significantly cheaper ([10], [28], [42]). In contrast, computer vision technology that relies on passive imaging has a much lower cost but still enables extraction of detailed forest stand information ([14], [37]).
Passive smartphone imaging also enables estimation of distance and object size through monocular or binocular vision ([41], [24]). Early image information extraction methods were mainly based on the binocular stereo vision principle and camera motion information ([27], [35], [3]). As such, they required multiple images to complete the extraction of depth information. In contrast, monocular methods do not require strict hardware conditions or multiple images during image acquisition ([49]) and monocular depth information is estimated based on a single image ([15]). Smartphone apps could bring monocular vision-based measurement to a wide range of users.
Trestima® is a commercial app intended for forest attribute estimation, especially pre-harvest inventory of marked stands. Trestima utilises monocular vision in combination with the classic relascope theory ([4]). Stem diameter and tree height, as well as tree species, are measured via data that are extracted from photographs obtained with a smartphone camera on a cloud computing platform ([39], [43]). Photographs are considered as samples from the targeted forest stand, and the application guides users to take several photographs ([32]). In theory, the Trestima measurement is objective as the image analysis is based on computer learning and the measurer only needs to follow the instructions provided by the app. Moreover, image capture is also faster than traditional field mensuration. The Trestima computer vision-based system has been developed since 2012 ([34]). It enables forest resource inventory from photographs taken in the forest with a smartphone. These photographs are used in a manner similar to relascope plots and serve as selective samples of forest structure. For the calculation of basal area, the minimum gauge of the relascope is determined based on the calibration of the phone. Segmented trees that are larger than the minimum gauge are included in the sample.
A Trestima sample has an approximate 60-70-degree angle of view, depending on the type of phone used. The angle count sampling principle in the app uses a dynamic basal area factor, whereby a single tree leads produces a basal area between 0.6-1.4 m² ha-1 ([45]). The total basal area is obtained by multiplying the number of trees by their basal area factor. Trestima automatically estimates tree species and calculates forest stand variables, such as basal area, stem count, volume, median diameter, and height. Based on the photograph and camera angle, Trestima reconstructs a 3D-model from the photograph. Tree diameters estimated from Trestima photographs are used to construct a stem diameter distribution. However, as the software is commercial, not all technical information related to Trestima is publicly available. Currently, Trestima is widely used in operational forestry in Finland rather than conventional relascopes, especially for pre-harvest measurement of marked stands. An example of a processed Trestima photograph can be found in Fig. S1 (Supplementary material).
To the best of our knowledge, the current study is the first to compare smartphone estimations with operational harvester data and thus differs from earlier Trestima studies. The benefit of harvester data is that it covers the whole marked forest stand. However, combining harvester data with predictions of forest stand attributes, such as volume, is difficult, and consequently, previous studies have often failed to comprehensively use harvester data ([13]). Harvester data are usually collected for timber-sales transactions and only cover the industrial roundwood section (i.e., harvesting volume) of the stem, and are therefore seldom optimised for research needs ([47]).
Forest inventories typically consider stand-level means of forest attributes, such as volume or biomass. However, one of the main attributes to characterise forest resources is the stem diameter distribution, which reflects the stand structure at the tree-level ([22]). Diameter distribution and tree heights are needed for flexible calculation of forest stand timber assortments using taper curve models. Diameter distributions have been an active research topic both for field inventory and remote sensing applications ([38], [36]). For the estimation of stem distribution, cut-to-length (CTL) harvester data and ALS data have also proved useful in many studies ([39], [22]). However, there is little information available on the accuracy of machine vision-based forest inventory systems in the estimation of stem diameter distributions.
Our objective was to compare harvester-based timber recoveries with computer vision-based estimates collected before harvesting using Trestima®. The hypothesis was that the harvester data and the estimated data should match. In the study, we used operational large-scale wood-harvesting data as the reference and compared that data to estimates obtained from the Trestima computer vision-based smartphone stand. The most important characteristics compared were total harvest volume, volume by tree species, and volume by timber assortments. We also investigated the stem distributions obtained by the smartphone app before harvesting and by the harvesters after harvest. We examined only clear-cut sites in the study. Both datasets were from operational forestry and thus were not optimised for scientific research.
Materials and methods
Harvested data
Most of the 37 harvested stands were located in southeastern Finland. Locations of the clear-cut stands in Finland used in this study can be found in Fig. S2 (Supplementary material). We examined clear-cut stands from which Stora Enso Wood Supply Finland (WSF) had purchased timber. The clear-cutting period covered was December 2018-August 2020. In these data, forest stand borders were obtained from the stand databases that existed prior to harvesting. However, in practice the harvested areas can deviate from the nominal stand borders. After preliminary analysis, the clear-cut stands that had both Trestima computer vison-based stand estimates and geolocated harvesting data available were selected. For these stands, more accurate stand delineations were obtained based on recorded harvester positions ([25]). After removal of all inconsistencies, such as area mismatches and poor spatial equivalence between the actual harvested stand and the stand where the Trestima estimates were obtained, we had 37 clear-cut stands available for the study. The smallest area equivalency that was accepted was 30.8%. Total industrial roundwood harvested from the study stands was 21.531 m³ (solid over bark). The average number of stems per hectare was 582. Description of the data used in this study can be found in Tab. S1 and Tab. S2 (see Supplementary material).
The harvester data included stems of Norway spruce (Picea abies [L.] Karst.), hereafter spruce, Scots pine (Pinus sylvestris L.), hereafter pine, as well as silver birch and downy birch (Betula spp.). Material in the study site was spruce-dominated with that species accounting for more than half of the total removal.
These data were provided in a hpr format, which is a new StanForD 2010 harvester file format that includes the position of the harvester where it processed the stem, as well as tree species and dimensions (length, diameter, volume) of each log cut ([40]). In Finland, harvester measurements are the most frequently used method for measuring industrial roundwood ([26]) as timber-sales payments for forest owners, for instance, as well as labour fees and harvesting rates for forest machine operators and entrepreneurs, are based on harvester measurements. Harvester measurement is regulated and adjusted by several actions and decrees in Finland (Decree of the Ministry of Agriculture and Forestry - [8], [9]), including systematic inspection and validation measurements.
All merchantable stem pieces cut in the forest stand, except waste pieces of decayed wood and treetops, were included in the harvester data ([18]). Sawlog lengths were mainly 3.7-5.5 m at 0.3 m increments. Also, some shorter (3.1 or 3.4 m) and longer (5.8 and 6.1 m) sawlog lengths were cut. The minimum top diameters of spruce, pine and birch sawlogs were 16, 15 and 17 cm, respectively. Lengths of the pulpwood poles were 2.7-5.0 m, and the minimum top diameters of spruce, pine and birch pulpwood pieces were 7, 6 and 5 cm, respectively.
Trestima data
The final 37 harvested stands included a total of 48 forest inventory stands where Trestima information had been collected, because neighbouring stands are often treated as a single unit in harvesting. Area mismatches between the stand borders could also occur (see Fig. S3 in Supplementary material) and in such cases, we intersected the stand polygons and the actual stand polygon, and estimated the Trestima-volume of the actual stand as an area-weighted average of the stands where the average number of photographs taken with Trestima was 7.3 per actual harvested stand (see Tab. S2 in Supplementary material). The number of photographs taken for each stand varied, so we classified the observed stands by the number of photographs (three classes). Classification was as follows: ≤ 3 photographs; 4-9 photographs; ≥ 10 photographs (Fig. 1 left, Fig. 2, Fig. 3).
Fig. 1 - (Left): scatterplot between the measured removal (by the harvester) and estimated removal (by Trestima) in clear cuttings by the class of the number of Trestima photographs. (Right): scatterplot between measured removal (by the harvester) and estimated removal (by Trestima) in clear cuttings by the class of the matching area of Trestima and harvester stands.
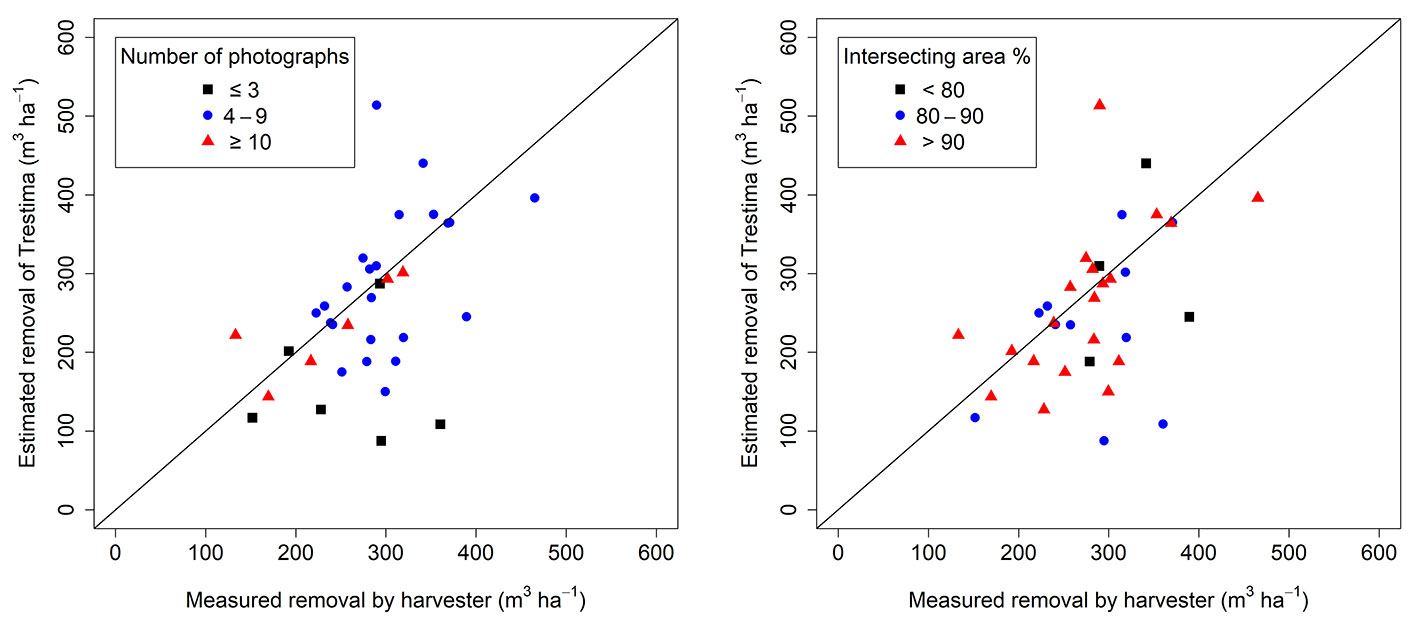
Fig. 2 - Tree species-specific scatterplots between measured removal (by the harvester) and Trestima estimates in clear cuttings by the class of the number of Trestima photographs.
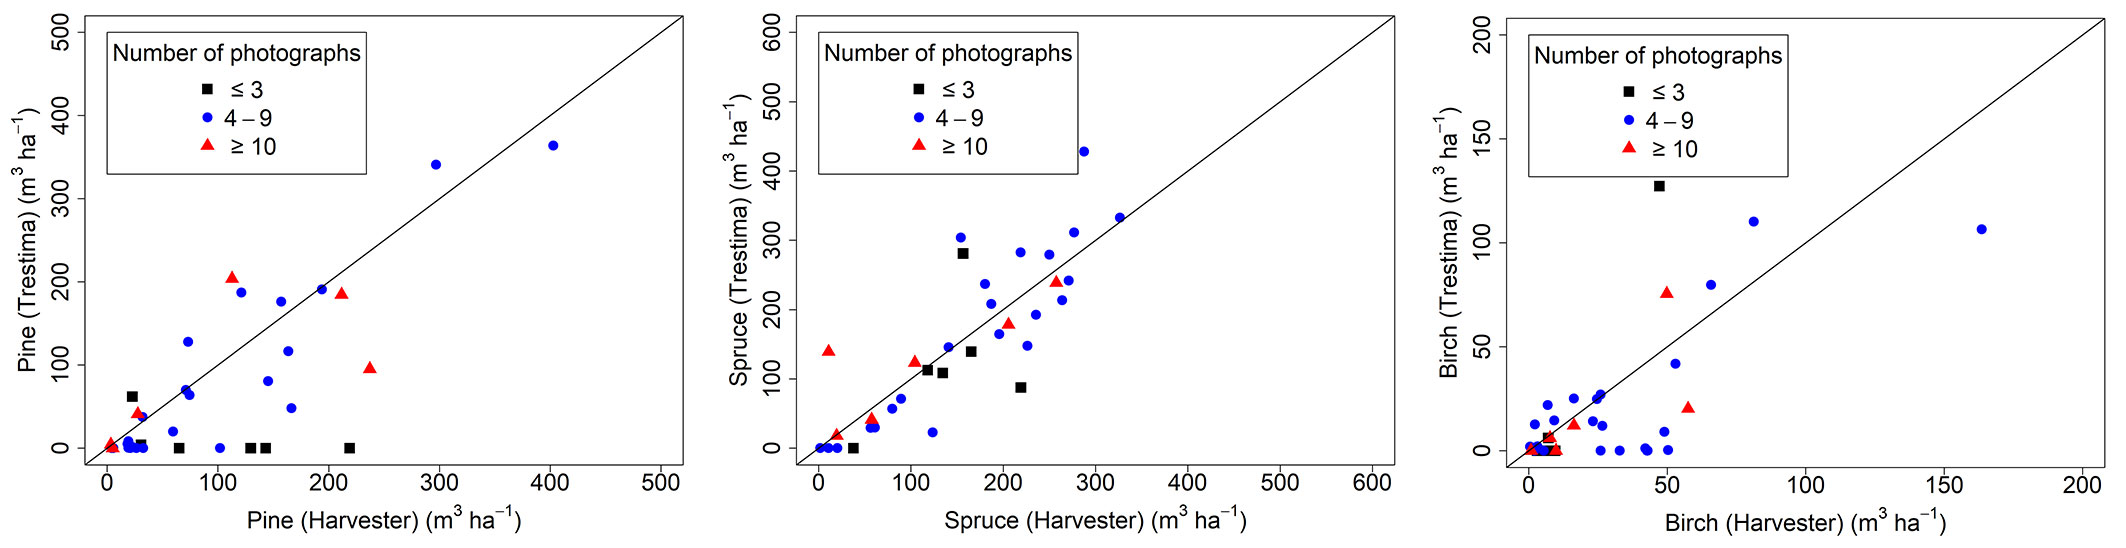
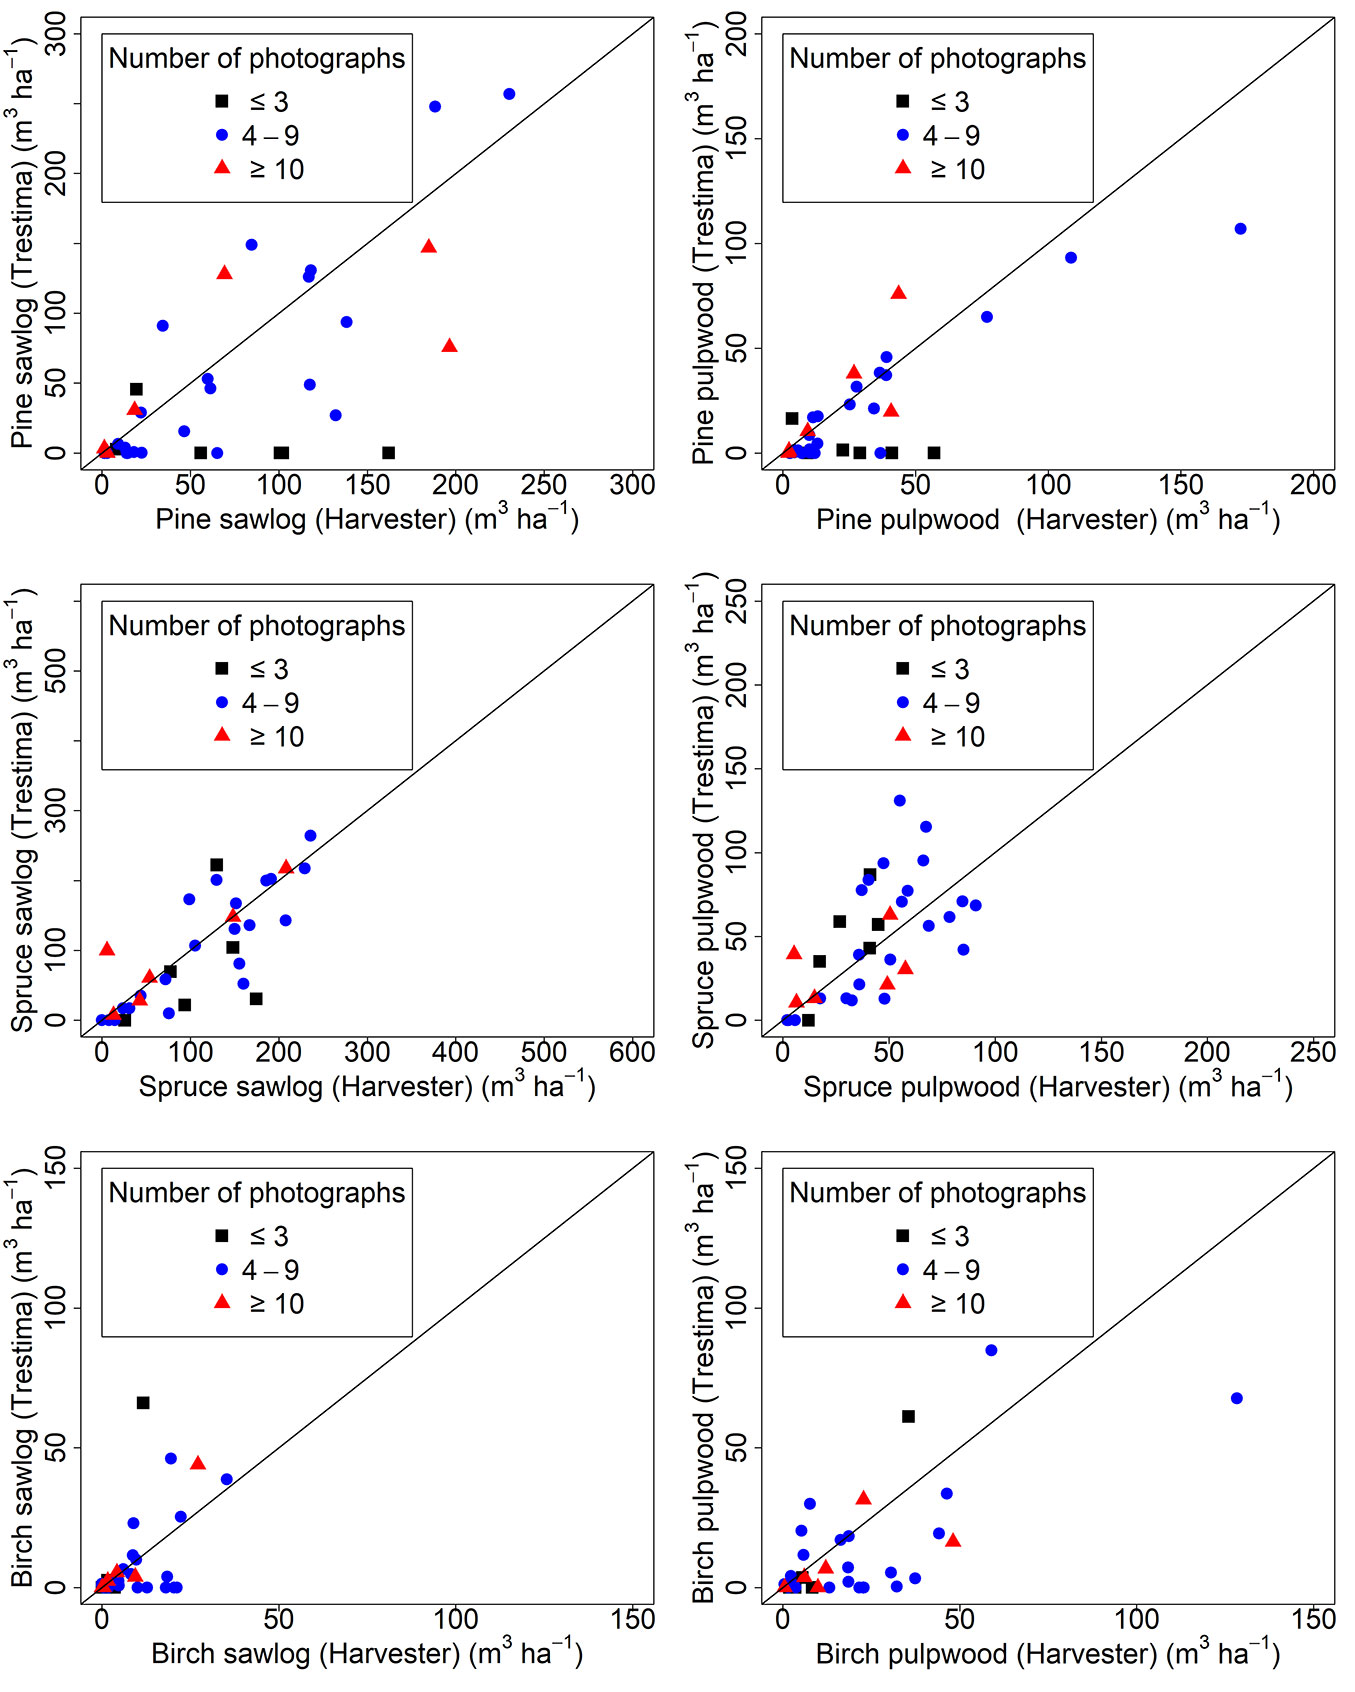
Fig. 3 - Tree species-specific scatterplots between timber assortment removal (measured by the harvester) and Trestima estimates in clear-cut forest stands.
Statistical analysis
Comparisons of the Trestima and harvester measurements were made for total, tree-species, pulpwood, and sawlog removals (see Tab. S1 and Tab. S2 in Supplementary material). Comparisons of timber assortments were made for pine, spruce and birch. Stem distributions were also formed in 2-cm classes, both for harvesters and Trestima. These distributions were examined and compared by stand. We also performed a closer investigation of the forest stands where the error of predictions was > 100 m³ ha-1. R software was used to perform statistical analyses.
Tab. 1 - Correlation coefficients (r) and p-values between measured and estimated volumes. P-values were calculated with a non-parametric Wilcoxon test.
| Volumes | Correlation coefficient |
p-value |
|---|---|---|
| Total volume | 0.48 | 0.10 |
| Pine | 0.78 | 0.01 |
| Spruce | 0.80 | 0.66 |
| Birch | 0.70 | 0.34 |
| Pine sawlog | 0.71 | 0.03 |
| Spruce sawlog | 0.72 | 0.46 |
| Birch sawlog | 0.57 | 0.50 |
| Pine pulpwood | 0.83 | 0.01 |
| Spruce pulpwood | 0.62 | 0.45 |
| Birch pulpwood | 0.70 | 0.01 |
The root mean square error (RMSE) and bias values between the harvester data and the Trestima estimates were calculated for total harvest volume, tree species volume and timber assortment volume (eqn. 1 and eqn. 3). In addition, the corresponding relative RMSE and bias values were calculated according to eqn. 2 and eqn. 4. Finally, the correlation between the harvester data and Trestima estimates was determined using the Pearson product-moment correlation coefficient (r). A p-value for the average estimated and measured values was determined using a non-parametric Wilcoxon test (Tab. 1).
where yobs is the harvested value, ypred is the Trestima predicted value, N is the number of stands, hat{y}obs is the average observed volume.
For stem distribution, we calculated the Error Index according to eqn. 5 ([31]), as a variation of Reynolds et al. ([33]) Error Index. The stem distributions were examined using 2-cm “diameter-DBH” classes.
where fi is the true harvested stem number, hat{f}i is the Trestima predicted stem number of all diameter classes, N is the true harvested stem number of all diameter classes, and hat{N} is the Trestima predicted stem number of all diameter classes.
Results
Accuracy of Trestima estimates
The correlation coefficient (0.48) between the harvested and Trestima-estimated volumes was not strong when total harvest removal was examined (Tab. 1), but was much stronger with regard to birch, pine and spruce volumes (0.70, 0.78 and 0.80, respectively). For the volumes of spruce, birch, spruce sawlog, birch sawlog and spruce pulpwood the p-values of non-parametric Wilcoxon test were over 0.1, indicating that the averaged estimates from the harvester and Trestima were not statistically different (see also scatterplots in Fig. 2 and Fig. 3). For total volume, p-value <0.1 indicates a possible difference, but not statistically significant at the 5% level (see also scatterplot in Fig. 1). Significant differences (p-values < 0.05) were observed for pine, pine sawlog, pine pulpwood and birch pulpwood volumes (see also scatterplots in Fig. 2 and Fig. 3).
The accuracy of the Trestima estimates varied greatly according to the number of photographs that had been taken in the forest stand (Tab. 2, see also Fig. 1). The RMSE value associated with total harvest volume was 55.3% with the ≤ 3 photographs per stand class, 27.7% in the 4-9 class and 17.7% in the ≥ 10 class. The overall RMSE value was 32.2%. Bias values also decreased as the number of photographs increased. The Trestima estimates were mainly underestimates.
Tab. 2 - Absolute root mean square error (RMSE) and relative (RMSE%) errors and corresponding bias values (Bias, Bias%) for total harvest removals by means of volume in clear cuttings according to the number of Trestima photographs.
| Number of pictures | RMSE | RMSE% | Bias | Bias% | Number of observations |
|---|---|---|---|---|---|
| ≤ 3 | 140.3 | 55.3 | 98.8 | 39.0 | 6 |
| 4-9 | 83.7 | 27.7 | 12.4 | 4.1 | 23 |
| ≥ 10 | 41.3 | 17.7 | 2.5 | 1.1 | 6 |
There was no clear decrease in the RMSE values associated with the Trestima estimation and the accuracy did not improve even when there was an increase in the intersecting area between the Trestima stands and actual harvested stands. (Tab. 3, see also Fig. 1). Most of the stands were in the class where equivalency was > 90%. In that class, the RMSE value (28.9%) and bias value (4.4%) were smallest.
Tab. 3 - Absolute root mean square error (RMSE) and relative (RMSE%) errors and corresponding bias values (Bias, Bias%) for total harvest removals in clear cuttings according to the intersecting area.
| Intersecting area (%) | RMSE | RMSE% | Bias | Bias% | Number of observations |
|---|---|---|---|---|---|
| < 80 | 99.0 | 30.5 | 29.2 | 9.0 | 4 |
| 80-90 | 106.1 | 37.8 | 48.7 | 17.4 | 11 |
| > 90 | 79.5 | 28.9 | 12.0 | 4.4 | 20 |
The data were spruce-dominated, with spruce accounting for more than half of total removals (see Tab. S1 in Supplementary material). The RMSE value associated with species-level estimations was slightly greater than the RMSE value associated with total harvest removal, and ranged from 46.6% to 257.3% (Tab. 4, see also Fig. 2). Bias values were greater for pine (11.4-89.2%) than for spruce (-12.7-12.4% - Tab. 4). The bias value for pine was greatest in the ≤ 3 photograph class (89.2%). As with total harvest removal, the RMSE and bias values decreased as the number of photographs increased.
Tab. 4 - Root mean square error (RMSE) and bias values associated with tree volume in clear cuttings by tree species (m³ ha-1).
| Tree species | Number of pictures |
RMSE | RMSE% | Bias | Bias% |
|---|---|---|---|---|---|
| Pine | ≤ 3 | 137.4 | 121.5 | 90.8 | 89.2 |
| 4-9 | 45.2 | 46.6 | 16.9 | 17.5 | |
| ≥ 10 | 69.9 | 70.2 | 11.4 | 11.4 | |
| Spruce | ≤ 3 | 77.0 | 55.6 | 17.1 | 12.4 |
| 4-9 | 80.2 | 48.6 | -10.4 | -6.3 | |
| ≥ 10 | 55.2 | 50.5 | -13.9 | -12.7 | |
| Birch | ≤ 3 | 33.1 | 257.3 | -9.4 | -72.9 |
| 4-9 | 29.9 | 82.7 | 15.1 | 41.7 | |
| ≥ 10 | 19.0 | 80.3 | 4.7 | 19.8 |
Greater scattering was evident with regard to the timber assortment data (Fig. 3). The RMSE values were also greater than for tree species values, and ranged from 50.1% to 123% (Tab. 5). Both RMSE and bias values were greater for pine than for spruce, but this was only observed in the ≤ 3 photograph class. For pine pulpwood, the bias value was greater than with sawlogs. For birch, the RMSE% and bias% values were relatively large, but the removals were also smaller.
Tab. 5 - Root mean square error (RMSE) and bias values in clear cuttings by timber assortment (m³ ha-1).
| Timber assortment | Number of pictures |
RMSE | RMSE% | Bias | Bias% |
|---|---|---|---|---|---|
| Pine sawlog | ≤ 3 | 91.9 | 123.0 | 66.7 | 89.2 |
| 4-9 | 39.9 | 60.1 | 8.7 | 13.1 | |
| ≥ 10 | 57.2 | 72.6 | 14.7 | 18.7 | |
| Spruce sawlog | ≤ 3 | 78.5 | 72.7 | 33.4 | 30.9 |
| 4-9 | 79.5 | 65.2 | -9.5 | -7.8 | |
| ≥ 10 | 39.3 | 50.1 | -14.9 | -19.0 | |
| Birch sawlog | ≤ 3 | 22.3 | 687.9 | -8.2 | -253.3 |
| 4-9 | 10.7 | 104.4 | 2.4 | 23.6 | |
| ≥ 10 | 7.3 | 102.2 | -2.1 | -30.0 | |
| Pine pulpwood | ≤ 3 | 32.9 | 121.4 | 24.1 | 89.0 |
| 4-9 | 17.2 | 56.4 | 8.2 | 26.9 | |
| ≥ 10 | 16.4 | 79.1 | -3.3 | -16.1 | |
| Spruce pulpwood | ≤ 3 | 24.9 | 81.6 | -16.3 | -53.3 |
| 4-9 | 29.8 | 62.6 | -4.1 | -8.6 | |
| ≥ 10 | 21.9 | 71.3 | 1.0 | 3.4 | |
| Birch pulpwood | ≤ 3 | 11.2 | 116.7 | -1.2 | -12.3 |
| 4-9 | 21.6 | 89.0 | 10.1 | 41.6 | |
| ≥ 10 | 14.2 | 86.0 | 6.8 | 41.2 |
Stem diameter distributions
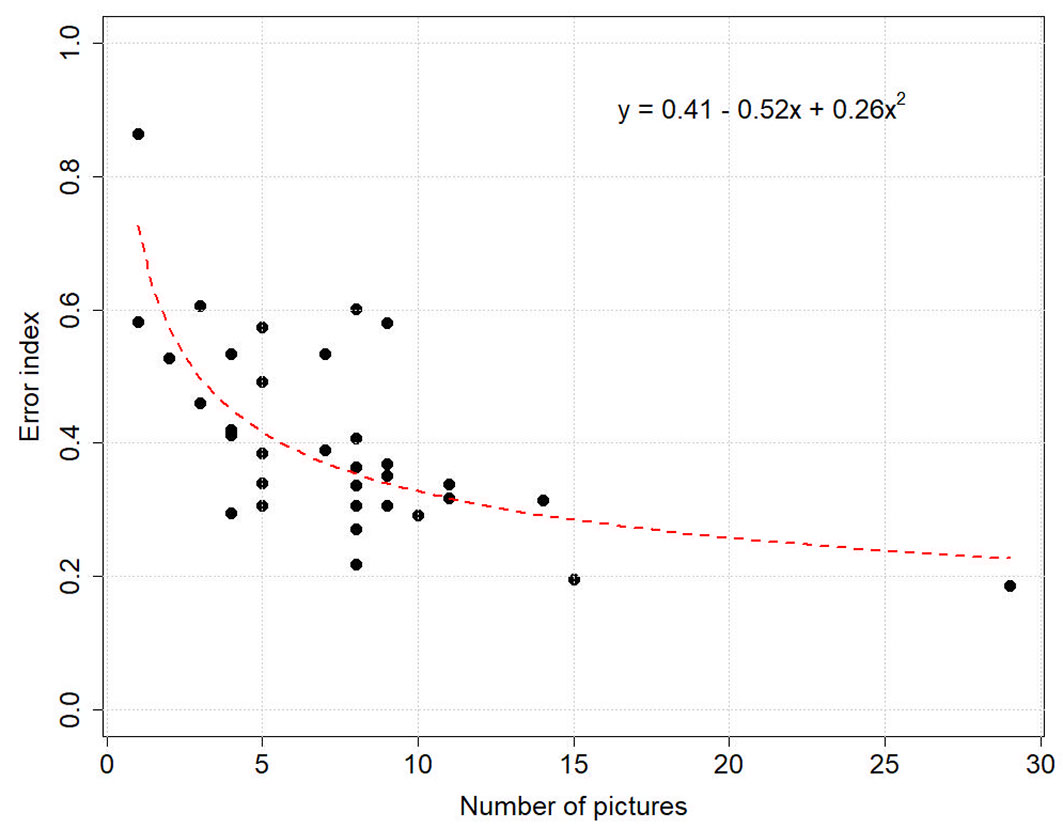
Overall, the Error Index obtained for the whole study material was 0.40, and was 0.63, 0.40 and 0.28 for the ≤ 3, 4-9 and ≥ 10 classes, respectively. The relationship between the number of photographs and the Error Index values is shown in Fig. 4and indicates that approximately 10 photographs were needed to guarantee Error Index values < 0.4.
Fig. 4 - Error index according to the number of photographs taken per forest stand. A polynomial trendline is fitted to the scatterplot using a polyline with degree two.
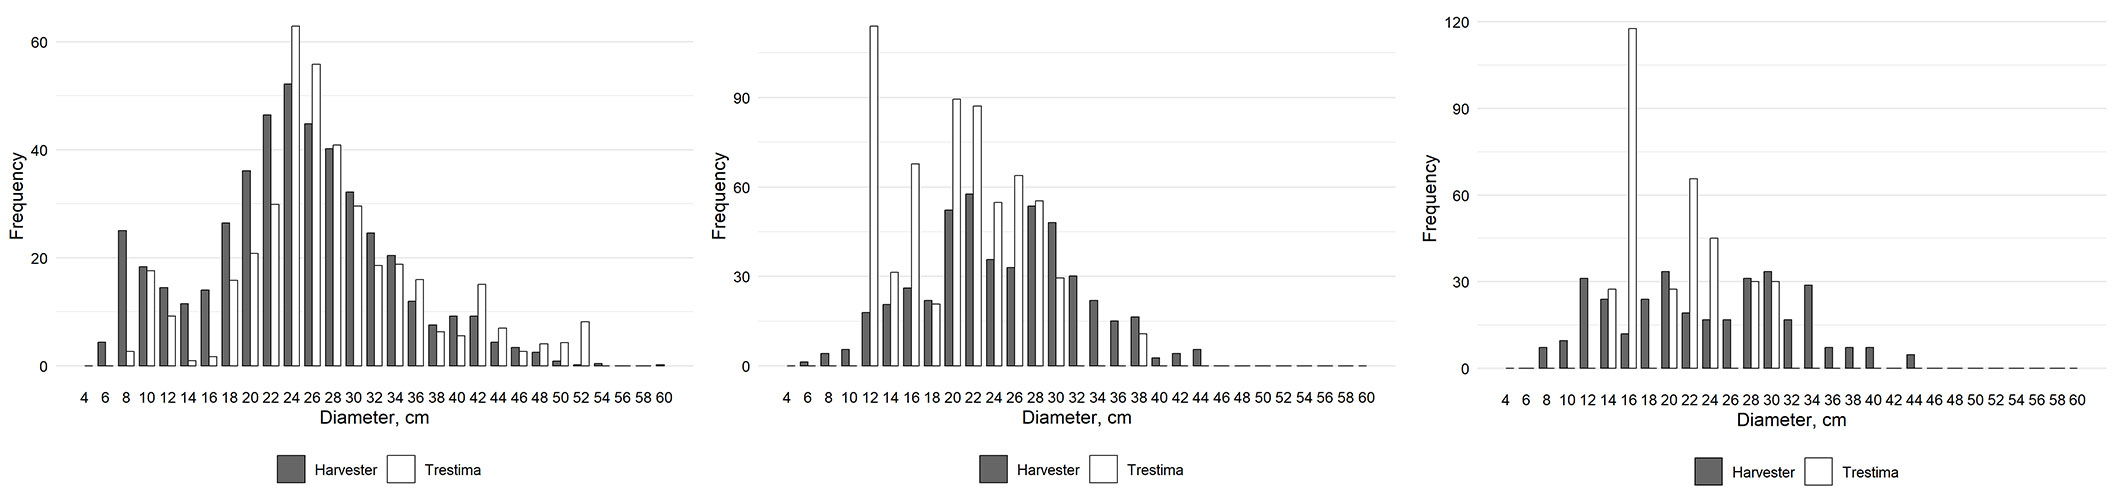
Example distributions of the different photograph classes are presented in Fig. 5. The smartphone estimates of stem distribution were not realistic in the ≤ 3 class (Fig. 5). Trees were observed in only a few diameter classes, which is not realistic, and the estimates were not continuous, although the harvester-based diameter range was wide. It was obvious that the sampling error was high in this case. In the other two examples (Fig. 5), the smartphone estimates were more realistic. The frequency of diameters was usually overestimated in the 12-28 cm diameter class, whereas trees with the smallest and greatest diameter classes were missing. In the case of 15 images, the smartphone estimates were able to replicate the slight bimodality of the harvester-based tree diameters. Moreover, a number of extra-large trees were found in the Trestima estimate.
Fig. 5 - Examples of stem distributions. (Left): stem distribution from the ≥ 10 photograph class (In this example, 15 photographs were taken in the forest stand). Stem number was 462 as measured by the harvester, and was 395 as estimated by Trestima®. The Error index was 0.20. (Center): stem distribution from the 4-9 photograph class (In this example, seven photographs were taken in the forest stand). Stem number was 474 as measured by the harvester and 625 as estimated by Trestima®. The Error index was 0.30. (Right): stem distribution from the ≤ 3 photograph class (In this example, two photographs were taken in the forest stand). Stem number was 331 as measured by harvester, and was 343 as estimated by Trestima®. The Error index was 0.53.
Discussion
In our study, the RMSE value varied considerably depending on the number of photographs taken in the targeted forest stands, and the magnitude of the errors can also be affected by the operators who acquire the data. When there were ≥ 10 photographs taken in the forest stand, the RMSE value associated with the Trestima estimate was 17.7%, which corresponds to an error of approximately 71 m³ per hectare. The bias was approximately 1.1%, which would indicate that Trestima slightly underestimated the removed volume. These results were more accurate than those obtained in an earlier study that compared harvester data with ALS-based stand information ([47]). However, our study contained additional sources of errors, such as clear mismatches between the stand borders described in Trestima and the boundaries of the harvested blocks. Other factors may also have caused errors. For example, retention trees and waste pieces of decayed wood were not included in the harvester data ([18]), although they are included in the Trestima-based estimates.
In our study, the RMSE% value was reasonably low when the total harvested volume was examined, and it would seem that Trestima estimates are accurate when an adequate number of photographs are taken. The problem seems to be in the operational use of Trestima, as service pricing of the app is based on the number of photographs taken, which may discourage users from taking a sufficient number of photographs. Every photograph is a cost for the measurer and when the errors were large, it was possible that the photographs were only taken as documentation of the stand, without an intent to properly estimate stand characteristics, such as basal area. Nonetheless, errors were large in cases where only one photograph was taken in the forest stand.
We examined the Trestima photographs in more detail when the hectare-based total removal error was ≥ 100 m³ ha-1. The closer inspection was carried out for 8 objects. In total, there were 8 harvester stands and 13 Trestima stands, and the average number of photographs for these stands was 5, while 4 of these stands had only one photograph. Image processing, including the specification of tree species, was successful in these stands. Thus, we interpret that the paucity of photographs produced the large observed difference between the harvester values and the Trestima estimates. In such cases, the sampling errors can be large.
Another reason for the differences in timber assortment volumes is cross-cutting, which might differ between the Trestima-based calculation and actual cutting. However, it must be remembered that cross-cutting of trees depends strongly on the desired distribution of different log lengths and top diameters by the sawmills. The operator of a harvester often uses manual bucking for pine and automated algorithms for spruce ([17]). For instance, when the manual bucking (with pine) percentage is high, the volume of the sawlog section is smaller and, moreover, the log percentage is also smaller than that from automated bucking.
The study provided new information on the accuracy of Trestima data in operational use. The main problem was that the app was not used in the manner recommended to the user. Pitkänen et al. ([32]) concluded that Trestima can provide reasonably good pre-harvest information based on simple tools and has no specific requirements for skills in forest mensuration. The set-up in their study was different to our study, and the information was derived from operational use in forestry. We can also conclude that with an adequate number of photographs, Trestima can provide reasonably good pre-harvest information. Vastaranta et al. ([45]) studied basal area and height mensurations with Trestima and obtained excellent results, but the set-up in their study was also different to our study. Other smartphone studies have mainly focused on measuring DBH ([5], [49], [48]).
Compared to traditional field measurement, our Trestima results are promising. Haara & Korhonen ([12]) found that the RMSE value of forest stand volume was 24.8% and 21.4% after reducing the sampling error. In traditional field measurements, the stand is measured by tree species and by storey. When predicting total stand volume, the Trestima application obtained better results when ≥ 10 photographs were taken. In traditional field measurements, total volume can be underestimated by 1.6% ([12]), while in our study, Trestima also slightly underestimated harvest removals.
Stem distributions appeared to be fairly accurate when sufficient (approximately 10) photographs were taken. With a smaller number of photographs, the stem distributions did not seem to be realistic. Thus, care must be taken when diameter distributions in a stand structure are analysed by smartphone applications. Regardless, this was the first study where diameter distributions have been examined with both operational harvester and Trestima data.
Compared to a similar type of ALS-based forest inventory study ([47]), the results for Trestima were also promising. Vähä-Konka et al. ([47]) reported RMSE% values of 26% for total volume when ALS-based estimates were compared to operational harvesting data, while with an adequate number of photographs, the RMSE% value (17.7%) in our study was better for total volume. Also, when the RMSE% values associated with timber assortment were examined, our results in the ≥ 10 photograph class were good when compared to Vähä-Konka et al. ([47]). Moreover, bias values were also lower in our study. Otherwise, the results of this study with regard to volume were similar to those reported for ALS-based forest inventory studies ([29], [30]) where reference values were based on accurately measured field sample plots. A study that used terrestrial laser scanning ([1]) found that the Bias% value can be up to 25% for small trees in volume estimations, but can be only a few percent for large trees. Personal laser scanning based methods have recently been developed for field plot measurements ([10]), but volume estimation studies remain scarce.
Conclusions
In an operational context, an inadequate number of photographs resulted in weak accuracy in Trestima-based estimation of forest stand attributes. When at least 10 photographs per stand were taken as instructed, the accuracy of the estimation improved remarkably. Seemingly, Trestima slightly underestimated the volume of harvest removals. Our results showed that pine volumes were substantially underestimated, while spruce volumes were almost unbiased. The hypothesis that harvester data and Trestima estimates obtained before harvesting are similar was accepted, provided a sufficient number of photographs had been taken. From the results, we can conclude that the Trestima machine vision-based application is a good solution for forest inventory purposes.
Acknowledgements
VV carried out all the computations with the help of LK, analysed the results and wrote the original manuscript. LK, KK and MM supervised the research, commented and revised the manuscript. All authors read and approved the final manuscript.
We thank Mr. Pekka Alajärvi and Mr. Mika Korvenranta from Stora Enso WSF who made the research possible and provided assistance during the study. We would also like to thank Mr. Juha-Antti Sorsa from Metsäteho Ltd for processing and transmitting the harvester data. In addition, special thanks to the Finnish Cultural Foundation and the University of Eastern Finland for funding the project. Thanks also to the Academy of Finland Flagship Program Forest-Human-Machine Interplay-Building Resilience, Redefining Value Networks and Enabling Meaningful Experiences (UNITE -grant no. 337127 and no. 357906) and Next GenerationEU - European Union through “Nappaa Hiilestä Kiinni” program and the Ministry of Agriculture and Forestry (grant no. VN/27353/2022 for IlmoStar) for co-funding of the article.
References
Gscholar
Online | Gscholar
Gscholar
Gscholar
Gscholar
Gscholar
Gscholar
Gscholar
CrossRef | Gscholar
Gscholar
Gscholar
CrossRef | Gscholar
Gscholar
Gscholar
Authors’ Info
Authors’ Affiliation
Lauri Korhonen 0000-0002-9352-0114
Kalle Kärhä 0000-0002-8455-2974
Matti Maltamo 0000-0002-9904-3371
University of Eastern Finland, School of Forest Sciences, Yliopistokatu 7, P.O. Box 111, FI-80101 Joensuu (Finland)
Corresponding author
Paper Info
Citation
Vähä-Konka V, Korhonen L, Kärhä K, Maltamo M (2024). Estimating the accuracy of smartphone app-based removal estimates against actual wood-harvesting data from clear cuttings. iForest 17: 140-147. - doi: 10.3832/ifor4377-017
Academic Editor
Enrico Marchi
Paper history
Received: May 11, 2023
Accepted: Apr 22, 2024
First online: May 14, 2024
Publication Date: Jun 30, 2024
Publication Time: 0.73 months
Copyright Information
© SISEF - The Italian Society of Silviculture and Forest Ecology 2024
Open Access
This article is distributed under the terms of the Creative Commons Attribution-Non Commercial 4.0 International (https://creativecommons.org/licenses/by-nc/4.0/), which permits unrestricted use, distribution, and reproduction in any medium, provided you give appropriate credit to the original author(s) and the source, provide a link to the Creative Commons license, and indicate if changes were made.

Web Metrics
Breakdown by View Type
Article Usage
Total Article Views: 17052
(from publication date up to now)
Breakdown by View Type
HTML Page Views: 11029
Abstract Page Views: 3243
PDF Downloads: 2434
Citation/Reference Downloads: 8
XML Downloads: 338
Web Metrics
Days since publication: 773
Overall contacts: 17052
Avg. contacts per week: 154.42
Article Citations
Article citations are based on data periodically collected from the Clarivate Web of Science web site
(last update: Mar 2025)
(No citations were found up to date. Please come back later)
Publication Metrics
by Dimensions ©
Articles citing this article
List of the papers citing this article based on CrossRef Cited-by.
Related Contents
iForest Similar Articles
Review Papers
Integration of forest mapping and inventory to support forest management
vol. 3, pp. 59-64 (online: 17 May 2010)
Commentaries & Perspectives
Benefits of a strategic national forest inventory to science and society: the USDA Forest Service Forest Inventory and Analysis program
vol. 1, pp. 81-85 (online: 28 February 2008)
Research Articles
Improving the harvester functionality by optimizing the manipulator kinematic scheme
vol. 18, pp. 227-233 (online: 26 August 2025)
Research Articles
Comparing land use registry and sample based inventory to estimate forest area in Podlaskie, Poland
vol. 10, pp. 315-321 (online: 23 February 2017)
Research Articles
Using self-organizing maps in the visualization and analysis of forest inventory
vol. 5, pp. 216-223 (online: 02 October 2012)
Research Articles
Simplified methods to inventory the current annual increment of forest standing volume
vol. 5, pp. 276-282 (online: 17 December 2012)
Technical Advances
Improved estimates of per-plot basal area from angle count inventories
vol. 7, pp. 178-185 (online: 17 February 2014)
Research Articles
Exploring machine learning modeling approaches for biomass and carbon dioxide weight estimation in Lebanon cedar trees
vol. 17, pp. 19-28 (online: 12 February 2024)
Research Articles
Prediction of stem diameter and biomass at individual tree crown level with advanced machine learning techniques
vol. 12, pp. 323-329 (online: 14 June 2019)
Research Articles
Methods to inventory and strip thin in dense stands of aspen root suckers
vol. 8, pp. 590-595 (online: 22 April 2015)
iForest Database Search
Search By Author
Search By Keyword
Google Scholar Search
Citing Articles
Search By Author
Search By Keywords
PubMed Search
Search By Author
Search By Keyword


