Effects of mixture and management on growth dynamics and responses to climate of Quercus robur L. in a restored opencast lignite mine
iForest - Biogeosciences and Forestry, Volume 15, Issue 5, Pages 391-400 (2022)
doi: https://doi.org/10.3832/ifor4108-015
Published: Oct 05, 2022 - Copyright © 2022 SISEF
Research Articles
Abstract
Opencast mining is currently one of the most destructive economic activities of natural ecosystems. Many restoration techniques have been developed to promote the recovery of terrestrial ecosystems degraded by mining, and afforestation and reforestation are among the most important methods to this purpose. In this study, we evaluated the combined effect of tree species mixture and thinning intervention on growth dynamics and responses to the climate of a target native planted oak (pedunculate oak, Quercus robur L.) about 40 years after reforestation of an opencast lignite mining area in Central Italy. The species used for reforestation were a native tree species (Q. robur L.), two valuable broadleaved trees (Fraxinus angustifolia Vahl. and Prunus avium L.) and a nitrogen-fixing tree (Alnus cordata Loisel.) to improve timber quality and restore the ecological and environmental value of the degraded land. Climate-growth relationships for precipitation, the Standardised Precipitation-Evaporation Index (SPEI), and temperature (on a monthly and seasonal scale) were tested together with indices based on tree-ring responses to drought. Thinning improved the stem quality and promoted a significant long-term increase in basal area increment (BAI, +31.0%) only in the mixture with alder. The thinning effect slightly mitigated radial growth reductions of oak trees during drought (resistance) and produced a general improvement in the magnitude of resilience and post-drought growth recovery (+37% and +27% on average, respectively). This effect was most evident when oak trees were mixed with only the N-fixing alder species, both after shorter- and longer-term drought or rainfall reduction. In conclusion, the mixture with alder combined with thinning practices resulted in the best management option to produce good-quality stems, improve growth performances, and mitigate drought effects in the recovery of opencast lignite mines through reforestation.
Keywords
Mixed Plantation, Tree Rings, Basal Area Increment, Mine Restoration, N-fixing Species, Linear Mixed Models, Pedunculate Oak
Introduction
Mining activity represents an important factor directly responsible for climate change by promoting deforestation and reducing carbon storage in vegetation and soils. The extraction of raw material, such as lignite, is usually done using the opencast method, a common form of mining extraction that severely damages the environment and landscape ([24]). Water and air pollution, as well as soil and vegetation loss, can lead to habitat loss in the surroundings of the affected area ([13], [24]). To minimise and mitigate the environmental effects related to the mining sector, land rehabilitation is usually planned and carried out. In this context, of great importance is the revegetation of the area with the creation of new woodlands to replace those previously destroyed. The afforestation of opencast mining areas often presents various difficulties, mainly related to the lack of fertile and evolved soil. Indeed, the soil in these areas is often characterized by low microbiological activity and a scarce quantity of both nutrients and organic matter not suitable for the rooting and early development of trees ([8]). For this reason, the spontaneous recolonization of pioneer species (herbaceous, shrubs, and trees) in post-industrial sites is slow ([46], [17]). Soil preparation, reducing soil compaction and favouring microbiological activities, is of primary importance to accelerate the successional process and facilitate reforestation activities ([7], [12], [39]). Similarly, using an appropriate mixture with nitrogen-fixing (N-fixing) species can provide several advantages but, in some cases, also problems when aggressive alien species are used ([12], [24]). Planting N-fixing tree species provides many ecosystem services, such as a fast improvement of soil characteristics, a rapid soil cover, an increase of colonization processes, and, consequently, an increase in soil biodiversity and carbon storage ([18]). Moreover, compared to monocultures, mixed-species stands are usually considered more resistant to disturbances such as extreme climatic events, especially in dry and nutrient-poor environments ([37], [28]). Additionally, they may provide higher levels of multiple ecosystem services ([15], [20]).
Interesting results have been obtained by directly planting suitable pioneer or post-pioneer native woody species intercropped with N-fixing trees and shrubs in the restoration of woodlands in spoiled mining soils in Italy ([7]), Brazil ([34]), India ([29]) and Germany ([21]) as well as in abandoned agricultural lands in Sri Lanka ([1]). Furthermore, in the early phase after planting, appropriate agronomical practices are needed to allow for a rapid tree growth. Thinning plays a significant role in the next stages, modifying the specific composition of the stand, the inter- and intraspecific competition among trees, and promoting growth and water use efficiency of the favoured trees ([31]).
Understanding the dynamics of these mixed plantations (i.e., climate-driven growth trends and patterns) is key for devising specific stand-level management strategies aimed to sustainable climate change adaptation and mitigation. Indeed, an improved knowledge of the effects of the predicted future drought intensification on resilience (the capacity to reach pre-episode growth levels) and the ability to recover after disturbance is fundamental for forest management ([19]).
Tree-rings analysis is one of the most used techniques for detecting tree growth responses to environmental factors, as the coupled effects of site and climatic conditions can be assessed ([45]), and it has been applied in studies on mixed forest plantations to these aims ([2], [31], [27]). Moreover, the positive effects of mixed-species composition, especially for resistance to climatic disturbances such as drought, can change under different growing conditions (e.g., nutrient-rich vs. nutrient-poor sites or wet vs. dry sites), suggesting the need to carefully consider specific site conditions ([37]). Pedunculate oak (Quercus robur L.) is one of the most abundant deciduous, ring-porous oak species in Europe, typically growing in mesic sites within floodplains, lowlands, and rocky areas. It has a higher water requirement and lower water use efficiency, resulting in sensitivity to drought stress ([3]). Most investigations on tree growth responses to climate and extreme droughts of pedunculate oak have been carried out in Central Europe, while few studies are available from its southern distribution range, such as the Mediterranean area ([3], and references therein).
In this study, we carried out a dendroecological analysis in a restored opencast lignite mining area in Central Italy to better understand the coupled effect of tree-species mixture and thinning on growth dynamics and responses to climate of a target native planted oak (Q. robur L.) about 40 years after restoration.
Under the hypothesis that the presence of N-fixing tree species can (i) enhance the growth recovery after disturbance of the target species, and (ii) improve different aspects of resilience in terms of drought-related growth changes, our study aimed to evaluate growth patterns and climate-growth relationships of Q. robur according to different tree species mixture and management options.
Materials and methods
Study area
The study was carried out in pure and mixed plantations of pedunculate oak established over more than 240 ha at Santa Barbara, a lignite-mining district in Central Italy, between Florence and Arezzo (43° 33′ N, 11° 29′ E). Restoration activities in the area date back to the late 1970s and were carried out through a cooperation of ENEL (the Italian Electric Company) and the Istituto Sperimentale per la Selvicoltura (the former name of CREA-FL, Arezzo, Italy), using the techniques of tree farming plantations for timber production. The species used in reforestation included the native pedunculate oak (overall 74 ha, both in pure and mixed stands, with different mixture types - [7], [10], [39]), two valuable broadleaved tree species (narrow-leaved ash, Fraxinus angustifolia Vahl. and wild cherry tree, Prunus avium L.) and an N-fixing tree species (Italian alder, Alnus cordata Loisel.) to improve timber quality and rehabilitate the ecological and environmental value of the degraded land.
The site has a typical Mediterranean climate with an average annual rainfall of 848.4 mm and an average temperature of 15.1 °C (period 1994-2019), and is characterized by a dry summer and rainy autumn, being October and November the rainiest months (SIR, Regional Hydrological Service of Tuscany - ⇒ http://www.sir.toscana.it/pluviometria-pub).
The soils under the pure and mixed stands have a similar structure, both showing an O horizon with slightly decomposed plant remains and resistant organo-mineral aggregates, a well-expressed A horizon of about 13-14 cm of thickness, and a B horizon clearly distinguishable from the parent material ([8]). The soil properties at the time of plantation were the results of the accumulation of inert layers, with a good drainage system. Soil texture is silty-clayey (silt: 44%, clay: 30%, sand: 26%), with a sub-acid pH ~5.6, a total N concentration ranging between 0.4% and 1%, and a reduced content in calcium, potassium, and phosphorus ([7]).
Plantation characteristics and management options
In 2020, we sampled eight different plantation types (half thinned and half unthinned) aged from 32 to 37 years and planted with approximately the same density (1100 trees ha-1) using a square planting layout with a distance of 3 meters (Fig. 1).
Fig. 1 - Experimental design of the four plantation types. (Q): pure oak; (QA): oak mixed with alder; (QB): oak mixed with two valuable broadleaves; (QBA): oak mixed with two valuable broadleaves and alder.
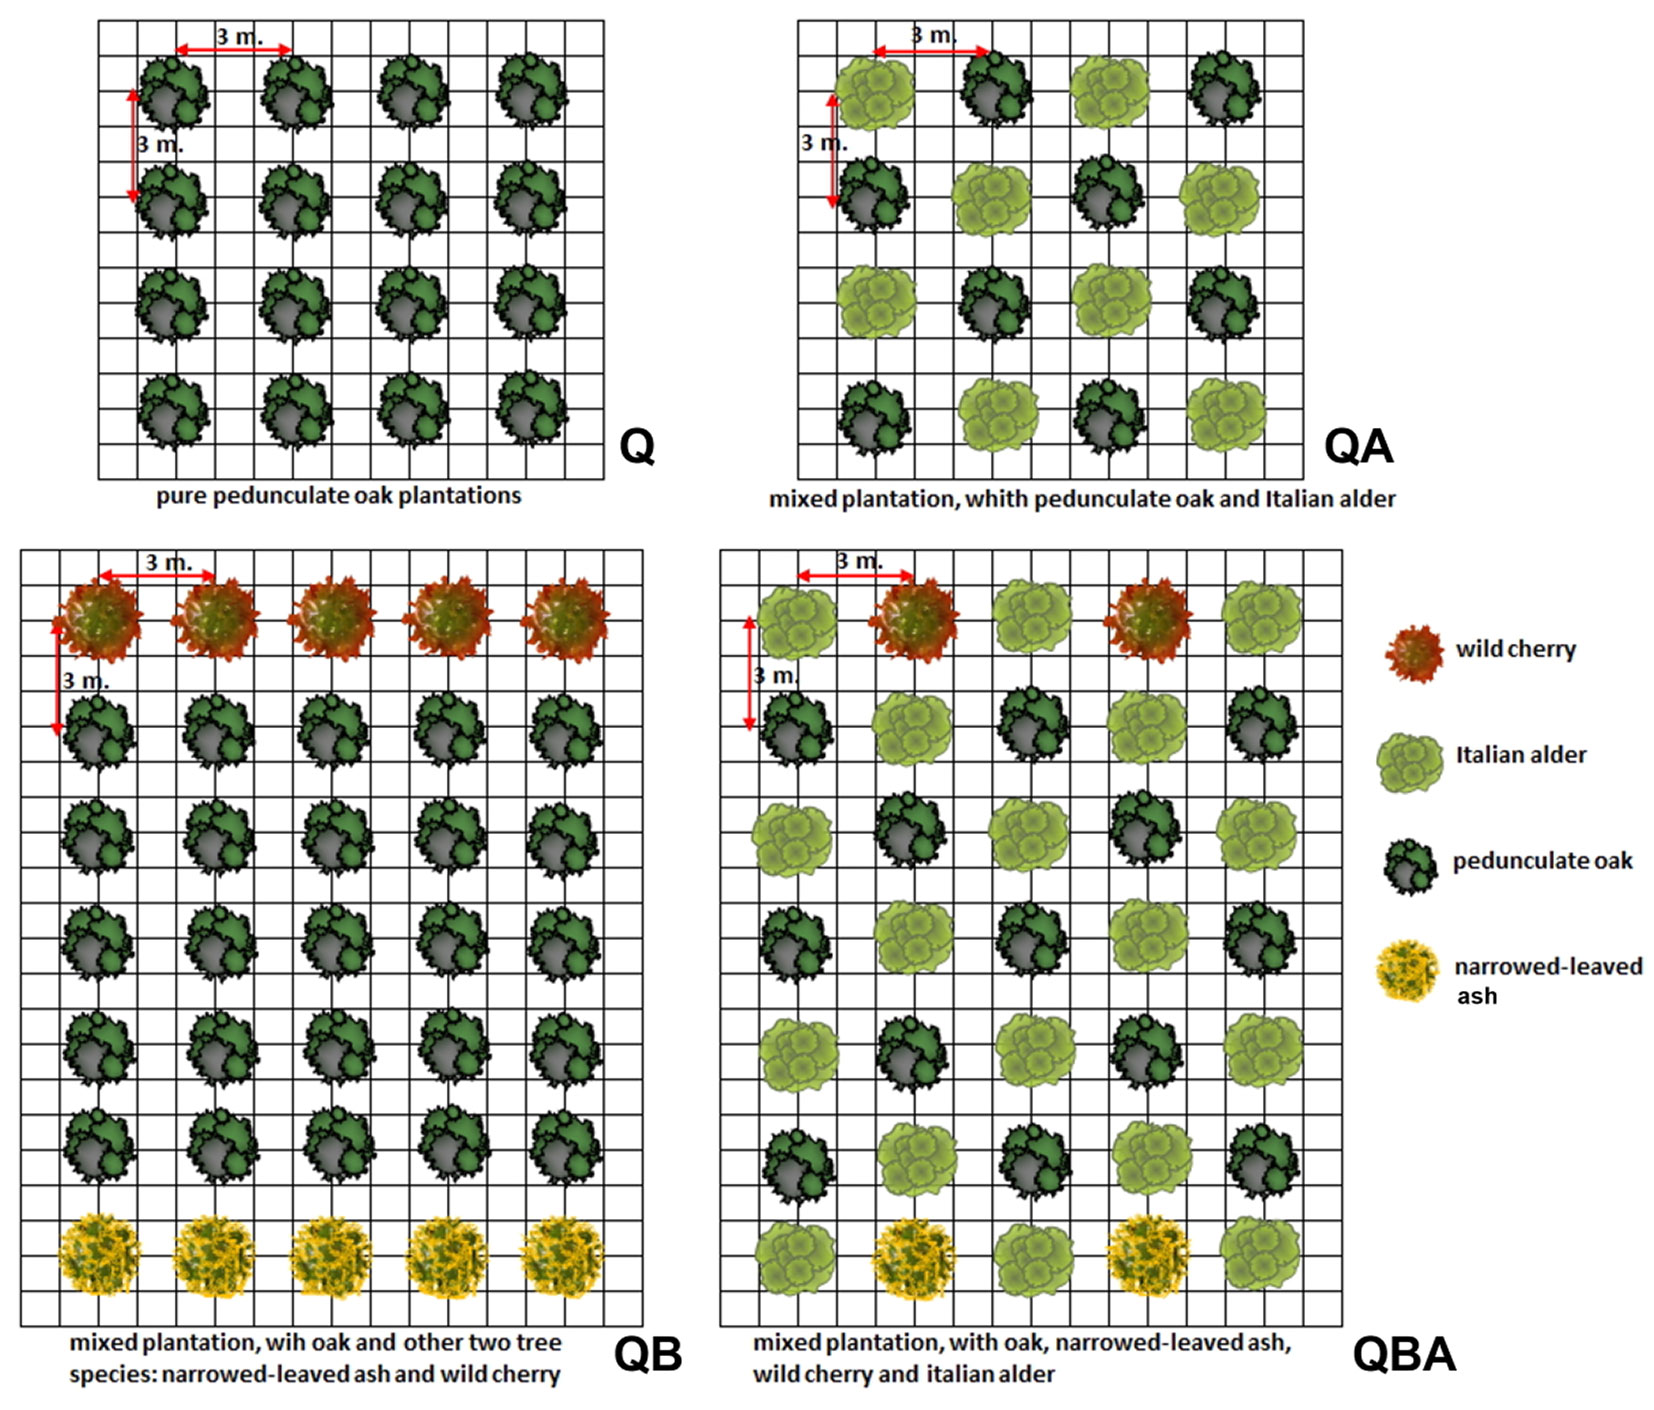
Four different plantation types were analysed: (i) pure pedunculate oak plantations - control unthinned plot (Qc) and thinned plot (Qt); (ii) mixed plantations, where pedunculate oak was mixed with 50% of Italian alder using an intimate mixture - control plot (QAc) and thinned plot (QAt); (iii) mixed plantations, where oaks were planted in lines with narrow-leaved ash and wild cherry trees in a ratio 1 × 5 × 1: narrow-leaved ash, oak, and wild cherry, respectively - control plots (QBc) and thinned plots (QBt); (iv) mixed plantations, where option (iii) was additionally mixed with 50% of Italian alder using an intimate mixture - control plot (QBAc) and tinned (QBAt).
All the plantation types were regularly cultivated during early years with mechanical weed control and pruning. We performed mechanical weed control twice a year for 3 years. Pruning was applied since 3 years after planting and repeated in the following years up to 5-m plant height. We carried out a first thinning at stand age of about 10 years (QAt), 14 years (QBt and QBAt), 15 years (Qt), and a second one 5 years later to select the best 70-80 valuable crop trees per ha (both pedunculate oak and other tree species) and to promote, by crown thinning, the stem growth at the end of the rotation period. We selected trees to be kept based on their vigour (according to diameter dimension and crown development), stem quality and potential timber value according to CEN standard ([32]). During the field sampling, the main dendrometric characteristics of the stands were assessed in rectangular plots of 1000 m2 (Tab. 1). Overall, thinning interventions reduced the tree density by about 75% in the pure oak stand (Qt) and in the stand mixed with alder (QAt), and by about 50% in the other two oak stands mixed with broadleaf tree species (QBt and QBAt). These early interventions significantly reduced the competitiveness of crop trees in all the stands, ensuring the free development of their crowns.
Tab. 1 - Main dendrometric characteristics both of stands and pedunculate oak, in the sampled plantations: age, total tree density, basal area (BA), diameter of mean basal area (DBH) and mean height (Hm, calculated as follow: H = a·ln (DBH)-b), in control (c) and thinned (t) plots, respectively. (Q): pure oak; (QA): oak mixed with alder; (QB): oak mixed with two valuable broadleaves; (QBA): oak mixed with two valuable broadleaves and alder.
| Stand | Age (yrs) |
Total tree density (n ha-1) |
Oak (%) |
Total BA (m2 ha-1) |
Oak (BA%) |
DBH (cm) |
Oak DBH (cm) |
Oak Hm (m) |
|---|---|---|---|---|---|---|---|---|
| Qc | 37 | 730 | 100 | 32.45 | 100 | 23.8 | 23.8 | 19.5 |
| Qt | 37 | 222 | 100 | 20.14 | 100 | 34.0 | 34.0 | 25.5 |
| QAc | 32 | 370 | 100 | 19.19 | 100 | 25.7 | 25.7 | 17.5 |
| QAt | 37 | 169 | 82 | 19.43 | 85 | 38.3 | 39.1 | 26.6 |
| QBc | 32 | 487 | 63 | 22.54 | 63 | 24.3 | 24.3 | 23.0 |
| QBt | 32 | 423 | 58 | 24.99 | 58 | 27.4 | 27.6 | 24.7 |
| QBAc | 32 | 339 | 69 | 19.80 | 65 | 27.3 | 26.6 | 25.6 |
| QBAt | 32 | 233 | 64 | 21.03 | 72 | 33.9 | 36.0 | 24.7 |
We evaluated stem quality for all the oak trees according to four classes applied in tree farming plantations ([32]): A, veneer; B, high quality saw timber; C, law quality saw timber; and D, wood for energy. We used a Pearson’s χ2 test to compare the observed tree distribution in the different stem classes.
Climate data
We used climate data for the period 1990-2014 from the Poggio al Vento meteorological station (312 m a.s.l.), very close to the study area (about 0.5 Km). Precipitation data from 2015 to 2019 were reconstructed from three meteorological stations near to the study area (Il Palagio: 315 m a.s.l. - 43° 36′ N, 11° 25′ E) applying linear regressions separately for each month, while for temperature reconstruction we used data from Casa Rota meteorological station (200 m a.s.l - 43° 39′ N, 11° 32′ E). We calculated the standardised precipitation-evapotranspiration drought index (SPEI) through potential evapotranspiration (PET) according to the Thornthwaite equation implemented in the R package “SPEI” ([47]) with monthly and seasonal time scales using the meteorological stations’ data. The use of SPEI allows to quantify the effects of droughts on tree growth, capturing the main impact of increased temperature on water demand.
Dendrochronological analysis
We selected trees within the eight stands to include all species mixtures and silvicultural options. Fifteen straight crop trees with vigorous and balanced crowns in the dominant layer were chosen in each stand. For each tree, we extracted two cores at breast height using a 5-mm-diameter increment borer. The cores were mounted on wooden supports, air-dried, and sanded with progressively finer sandpaper (200P and 600P) to obtain a smooth surface, and the tree-ring widths from bark to pith were measured with a 0.01-mm precision by a computer-linked mechanical platform (LINTAB™ 6, Rinntech e.K., Heidelberg, Germany) under a stereoscope using the software package TSAP-Win™ scientific version 4.6x (Time Series Analysis and Presentation, Frank Rinn, Heidelberg, Germany). Each ring width chronology was statistically verified for cross-dating and measurement errors using the “glk” function of the package “dplR” in R ([6], [38]). This function assesses the Gleichläufigkeit (glk) as pairwise comparison of all records in the data set, and returns a matrix whose upper triangle reports the glk of each possible combination of records. The global glk can be calculated as the mean. The chronologies that cross-dated poorly with the master site chronology errors were either corrected (when possible) or discarded, leaving in all cases the same number of trees for each stand.
We applied a one-step detrending to each mean tree-ring series to remove age-related growth trends and competition effects according to the standard dendrochronological procedures using the package “dplR” ([5]). The mean correlation between trees (r.bt) was computed to assess the synchronization in the annual growth patterns among sampled trees and the resulting common signal strength of the mean growth chronologies. We tested the chronology reliability using the Expressed Population Signal (EPS), including only those series with a high common signal (EPS ≥ 0.85). The R package “PointRes” was used to compute the “pointer years”, i.e., those years with remarkable growth at the stand level, thus providing quantitative information on the growth response of trees to extreme events ([43]). We used three preceding years in calculating relative growth changes.
One-way analysis of variance (ANOVA) was applied to analyse the differences in tree growth (expressed as BAI) among species mixture, comparing three 5-year periods after thinning to the 5 years before to account for its long-term effect. We checked the multiple comparison correction of the significance levels via the Bonferroni method. The normal distribution of data was tested by applying the Kolmogorov-Smirnov test and the Barlett test for the homogeneity of variance. When the normality test failed, we performed the non-parametric Kruskal-Wallis test for analysis of variance by ranks and the Wilcoxon-Mann Whitney (W) non-parametric test for independent samples.
Growth responses to climate
To assess the influence of climate on tree-ring growth, the establishment phase of the plantations (first ten years) was excluded from the analysis, as at this stage the climatic signal is not well retained in tree rings (e.g., due to strong competition with understory). We analysed climate-growth relationships at the monthly timescale using Pearson’s correlation coefficients for each climatic variable (precipitation, SPEI, and mean temperature), testing their significance through the 95% percentile range method after a bootstrap with 1000 replications using the “treeclim” package in R ([48]). We used fourteen monthly climatic variables from October of the year before growth (t-1) to November of the year of growth (t). This temporal window includes the previous autumn as climatic condition preconditioning tree-ring growth in the next growing season (e.g., water reserve from autumn-winter precipitation inputs stored in the soil), and the current autumn until November, considering that the cambial activity continues during autumn when favourable climatic conditions occur, as we observed in our sampling site.
For precipitation and SPEI, we also investigated climate-growth relationships at the seasonal scale using Pearson’s correlations after testing the normal distribution with the Kolmogorov-Smirnov and Shapiro-Wilk tests. Since we were not concerned with the simultaneous testing of all correlations, we did not apply the Bonferroni correction ([35]). For seasonal variables, we computed twelve and nine different seasons from the same temporal window for two specified season lengths in one-month steps (three and six months, respectively).
To consider the effect of thinning, we defined critical years as those with an extraordinary departure (± 1 standard deviation) from the mean of the main climatic predictors ([23]) over the period 2004-2019. To assess drought-related growth dynamics, we compared raw basal-area increments (BAIs) during these critical years to those observed in the years before and after. Any potential influence of different growing conditions at the stand level was removed by standardizing each raw BAI chronology by dividing it by its mean. We calculated resistance (Rt, the inverse of growth reduction during the episode - eqn. 1), resilience (Rs, the capacity to reach pre-episode growth levels - eqn. 2), and recovery (Rc, the growth increase relative to the minimum growth during the episode - eqn. 3) indices linked to components of growth stability - avoiding the overlap of consecutive drought years, as follows ([19], [27]):
where D0 is the raw basal-area increment corresponding to the year of drought, Dpre and Dpost are the average raw basal-area increments from 1 to 3 years before and after drought, respectively.
Additionally, we used a linear mixed-effects model (LMM) to assess the influence of the main climatic predictors on tree growth (BAI) including species mixture and treatment (thinning vs. control) as random effects. We considered these two factors as crossed random effects because they can be used to create distinct groupings, contrary to nested random effects which appear when there is any hierarchy in the grouping of the observations. We standardized the explanatory variable (BAI) to have mean=0 and standard deviation=1 before analysis, ensuring that the estimated coefficients were all on the same scale and thus making it easier to compare effect sizes. We used the marginal R squared (R2m) values to consider the fixed effects, while the conditional R squared values (R2c) for fixed plus the random effects ([30]).
We performed all the analyses mentioned above in the R software environment ([38]).
Results
Stand characteristics and stem quality
The main effect due to thinning is a reduced tree density and a higher mean diameter growth (Tab. 1). Consequently, the basal area was similar between control and thinned plots characterized by the same mixture, except the pure ones (Qc and Qt).
The presence of alder increased the oak growth due to its N-fixing effect, while the other broadleaves and, especially, the narrow-leaf ash caused a high competition level on oak trees. Indeed, the higher mean values of oak DBH were found in the thinned plots with alder (39.1 and 36.0 cm in QAt and QBAt, respectively) and the lower in the control plots, both pure (23.8 cm in Qc) and with other broadleaves (24.3 cm in QBc). For the same reasons, the differences in oak DBH between control and thinned plots were greater in the stands with alder (13.4 cm in QA and 9.4 cm in QBA) or pure (10.2 cm in Q) in comparison of the stands with the other broadleaves (3.3 cm in QB).
The stem quality of oak trees showed high variability among the plots. However, stem quality in the thinned plots was higher, with most stems classified in class B. On the contrary, in control plots most of the stems were in classes C and D. Generally, only few trees were classified in class A, from 0% in all the control plots to 4.3% (QBt), 7.2% (QBAt), 9.6% (Qt), to 26.5% in the QAt plot.
In the thinned plots with alder, the majority of trees were in class A + B (73% in QAt and 79% in QBAt - Tab. 2), while in the thinned plots without alder, the percentage of trees in class A + B significantly decreased (48% in Qt and 44% in QB). The presence of broadleaves seemed also to improve the stem quality (A + B) in control plots (46% in QBAc and 31% in QBc).
Tab. 2 - Oak trees distribution in four stem quality classes. (A): veneer; (B): high quality saw timber; (C): law quality saw timber; (D): wood for energy ([32]). Pearson χ2 test per 7 degrees of freedom (8 rows = plots; 2 columns = classes A+B and C+D). (*): significant with χ2 = 51.3 and p<0.01; (Q): pure oak; (QA): oak mixed with alder; (QB): oak mixed with two valuable broadleaves; (QBA): oak mixed with two valuable broadleaves and alder.
| Stand | Class A | Class B | Class C | Class D | Class A + B | Class B + C |
|---|---|---|---|---|---|---|
| Qc | 0 | 14 | 18 | 37 | 14* | 55* |
| Qt | 2 | 8 | 6 | 5 | 10* | 11* |
| QAc | 0 | 0 | 18 | 17 | 0* | 35* |
| Qat | 4 | 7 | 3 | 1 | 11* | 4* |
| QBc | 0 | 9 | 14 | 6 | 9* | 20* |
| QBt | 1 | 9 | 6 | 7 | 10* | 13* |
| QBAc | 0 | 10 | 6 | 6 | 10* | 12* |
| QBAt | 1 | 10 | 3 | 0 | 11* | 3* |
Growth patterns
A total of 120 trees and 223 cores were used to compute the mean stand chronologies (Tab. 3). The length of chronologies spans from 25 to 31 years, with mean BAI ranging from 12.3 ± 5.4 cm² (standard deviation) for Qc stand to 27.6 ± 13.0 cm² for Qt. The Gleichläufigkeit (glk) values ranged from 0.70 to 0.77, and mean sensitivity (MS) from 0.297 for QBAc stand to 0.387 for QAc, without significant differences among species mixtures or between thinned vs. unthinned stands. First-order autocorrelation prior standardization (AC1_raw) was not very high though still suitably removed in standardized series (AC1_std). After detrending, all the mean stand indexes exhibited a strong common growth signal, as revealed by the high values of EPS statistic (Tab. 3). Considering the total 223 cores, the glk statistic remained high (0.70), indicating a high percentage of common signs of year-to-year growth change. A stronger common growth signal was also found after detrending (r.bt = 0.40 and EPS = 0.99).
Tab. 3 - Main dendrochronological statistics of the eight stands sampled. DBH classes range of the dominant/co-dominant trees cored, mean basal area increment (BAI) ± standard deviation (sd), Gleichläufigkeit (glk), mean sensitivity (MS) and first-order serial autocorrelation (AC1_raw), computed on the whole length of the raw BAI chronologies; AC1_index, mean inter-serial correlation (r.bt) and expressed population signal (EPS), computed for the indexed BAI chronologies. (Q): pure oak; (QA): oak mixed with alder; (QB): oak mixed with two valuable broadleaves; (QBA): oak mixed with two valuable broadleaves and alder.
| Stand | Time span | max / min (yrs) | mean ± sd (yrs) | No. cores/ trees | BAI ± sd (cm2) | glk | MS | AC1 raw | AC1 index | r.bt | EPS |
|---|---|---|---|---|---|---|---|---|---|---|---|
| Qc | 1987-2019 | 32 / 22 | 30 ± 3 | 27/15 | 12.3 ± 5.4 | 0.70 | 0.315 | 0.48 | 0.14 | 0.46 | 0.95 |
| Qt | 1987-2019 | 32 / 27 | 31 ± 1 | 28/15 | 27.6 ± 13.0 | 0.74 | 0.333 | 0.54 | 0.13 | 0.54 | 0.97 |
| QAc | 1991-2019 | 29 / 22 | 26 ± 2 | 30/15 | 16.1 ± 7.3 | 0.77 | 0.316 | 0.47 | 0.16 | 0.55 | 0.96 |
| QAt | 1987-2019 | 32 / 27 | 31 ± 2 | 27/15 | 26.2 ± 17.2 | 0.76 | 0.387 | 0.61 | 0.16 | 0.44 | 0.95 |
| QBc | 1989-2019 | 31 / 23 | 29 ± 2 | 26/15 | 16.9 ± 7.9 | 0.72 | 0.314 | 0.55 | 0.13 | 0.47 | 0.95 |
| QBt | 1989-2019 | 31 / 22 | 27 ± 3 | 28/15 | 20.0 ± 9.1 | 0.72 | 0.303 | 0.66 | 0.13 | 0.58 | 0.97 |
| QBAc | 1989-2019 | 31 / 24 | 28 ± 2 | 27/15 | 20.8 ± 9.6 | 0.70 | 0.297 | 0.60 | 0.13 | 0.47 | 0.95 |
| QBAt | 1989-2019 | 31 / 22 | 28 ± 3 | 30/15 | 25.3 ± 12.2 | 0.75 | 0.306 | 0.57 | 0.15 | 0.50 | 0.96 |
The good coherence in synchronization patterns of all tree-ring chronologies points to similar factors affecting the growth of pedunculate oak in the different species mixtures analysed. Moreover, the effect of thinning significantly influenced the synchronization among the chronologies over time, increasing it especially in the long period (e.g., the period 2012-2019 with glk = 0.79 compared to 2004-2011 with glk = 0.63). This pattern was confirmed by the correlation matrix obtained by comparing these two periods (Tab. 4).
Tab. 4 - Correlation matrix among the chronologies for the two period after thinning: 2004-2011 and 2014-2019. (Q): pure oak; (QA): oak mixed with alder; (QB): oak mixed with two valuable broadleaves; (QBA): oak mixed with two valuable broadleaves and alder; (*): p<0.05; (**): p<0.01; (***): p<0.001.
| Period | 2004 - 2011 | 2012 - 2019 | ||||||||||||
|---|---|---|---|---|---|---|---|---|---|---|---|---|---|---|
| Stand | Qt | QAc | QAt | QBc | QBt | QBAc | QBAt | Qt | QAc | QAt | QBc | QBt | QBAc | QBAt |
| Qc | 0.95*** | - | 0.89** | - | - | - | - | 0.89** | - | 0.95*** | 0.95*** | 0.94*** | 0.88** | 0.94*** |
| Qt | - | - | 0.77* | - | - | - | 0.73* | - | - | 0.94 | 0.87** | 0.89** | 0.83** | 0.96*** |
| QAc | - | - | - | - | - | - | - | - | - | - | - | - | - | - |
| QAt | - | - | - | - | - | - | - | - | - | - | 0.94*** | 0.97*** | 0.91** | 0.97*** |
| QBc | - | - | - | - | 0.77* | 0.88** | 0.88** | - | - | - | - | 0.87** | 0.97*** | 0.96*** |
| QBt | - | - | - | - | - | 0.79* | 0.93*** | - | - | - | - | - | 0.82** | 0.92** |
| QBAc | - | - | - | - | - | - | 0.81* | - | - | - | - | - | - | 0.93*** |
Overall, oak tree-ring growth after thinning, expressed as basal area increment (BAI), was significantly higher in thinned stands (Fig. 2), especially in those pure and mixed with alder (+10.4% and +10.9% for QB and QBA, p < 0.01; +36.3% and +39.3% for QA and Q, p < 0.001 - Fig. 3a). Considering the three 5-year periods after thinning and compared to the control stands, a significant long-term increase in BAI compared to the 5 years before thinning was detected only in the QA-mixture stands.
Fig. 2 - Mean raw and indexed BAI chronologies for each stand. (Q): pure oak; (QA): oak mixed with alder; (QB): oak mixed with two valuable broadleaves; (QBA): oak mixed with two valuable broadleaves and alder. Dashed and continuous lines indicate thinned and unthinned mean stand chronologies, respectively. The years 2001, 2003 indicate the date of thinning and the year 2012 the main negative pointer year.
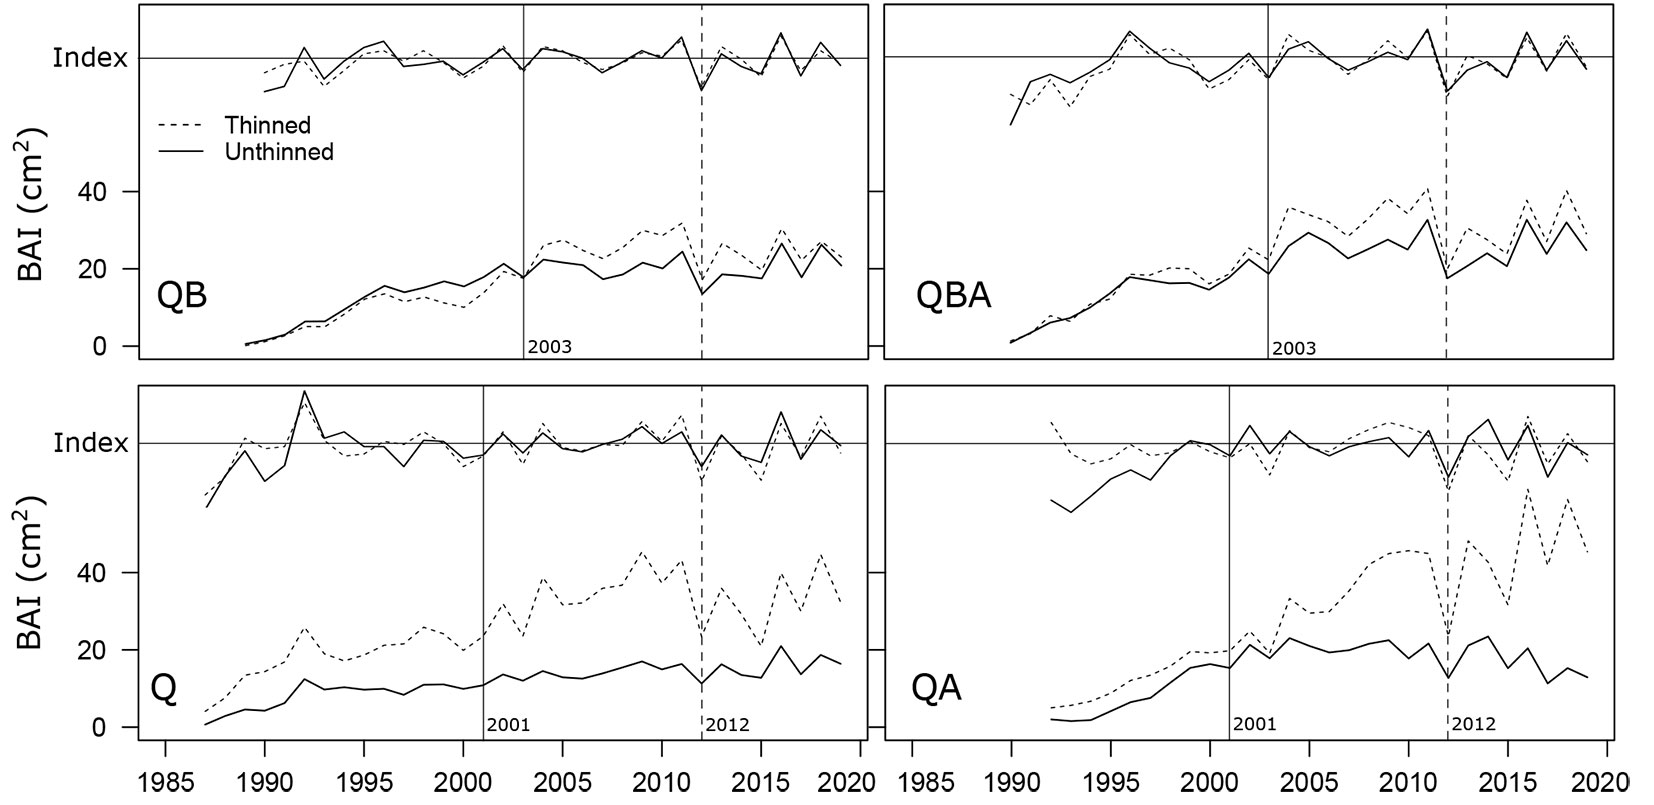
Fig. 3 - (a) Mean ± standard deviation values of raw BAI for thinned vs. unthinned stands for each species mixture. Asterisks indicate significant differences between thinned vs. unthinned stands for each species mixture. (**): p < 0.01; (***): p < 0.001). (b) Percentage differences between the three 5-years periods after thinning (post) and the five years before (pre), comparing thinned vs. unthinned stands. (Q): pure oak; (QA): oak mixed with alder; (QB): oak mixed with two valuable broadleaves; (QBA): oak mixed with two valuable broadleaves and alder.
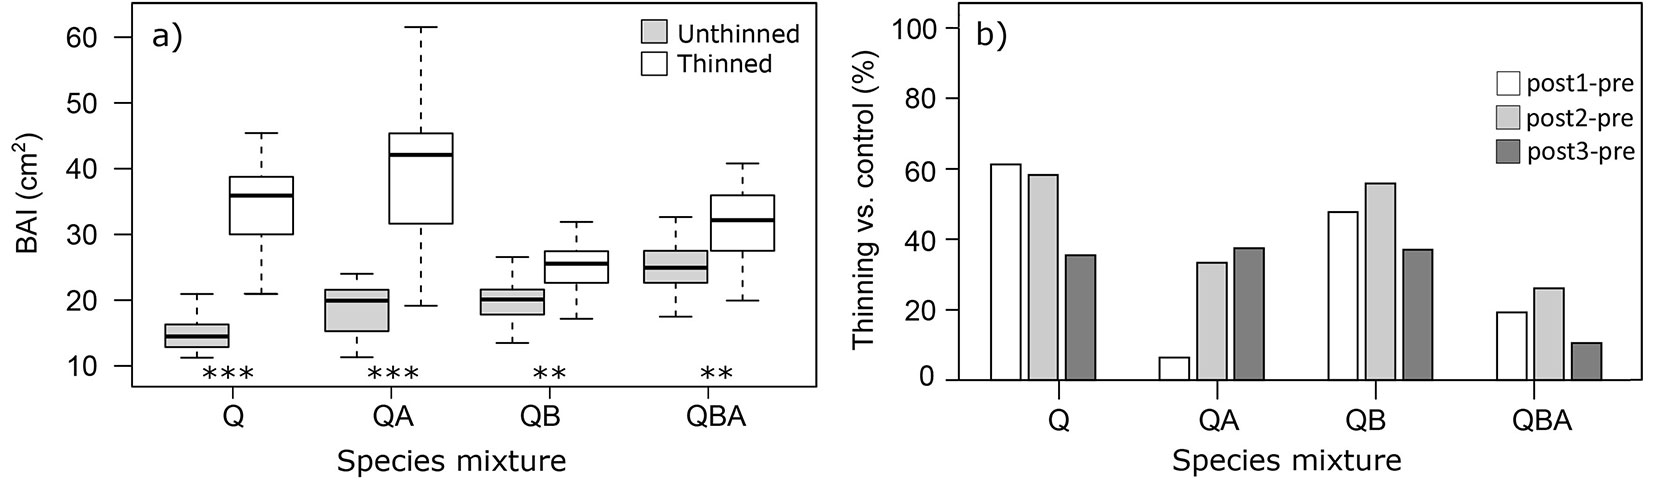
The mixture with broadleaves (QB) and the pure Q stands favoured the thinning-induced oak growth during the first 5 years, 2004-2008 vs. 1996-2000 for QB and 2002-2006 vs. 1994-1998 for Q (+47.7 and +61.3%, respectively with p < 0.01 - Fig. 3b). On the other hand, when alder is present (as in QBA and QA stands), the positive effect of thinning on radial growth after the first five years was lower.
On the other hand, increasing the time after the thinning intervention (5 and 10 years after, long-term effect), QA stands had an increase in thinning-induced growth in oak trees: 2007-2011 (+26.8%, p < 0.001) and 2012-2016 (+31.0%, p < 0.001) compared with 1994-1998 (Fig. 3b).
Growth responses to climate
Climate-growth correlations
Climate-growth relationships for each stand showed a similar picture among the different species mixtures for precipitation, SPEI, and mean temperature (Fig. 4 - see also Fig. S1 in Supplementary material). The effect of thinning appeared as the main common pattern characterizing the tree growth responses to precipitation and SPEI. On the monthly scale, precipitation in June and May were the main variables significantly correlated with tree growth expressed as BAI. This common signal was confirmed by the seasonal climate-growth correlations, with mjj (May-June-July of the current year) producing the highest correlation coefficients. Furthermore, jfm (January-February-March of the current year) was the other 3-month variable showing significant correlations with most of the mean standardized chronologies (Fig. 4a). The effect of thinning was even more evident when increasing the timescale of seasonal precipitation variables from 3 to 6 months, producing a higher number of significant climate-growth correlations compared with unthinned stands for each species mixture (Fig. 4a).
Fig. 4 - Significant Pearson’s correlation coefficients between standardized mean stand chronologies and (a) precipitation and (b) standardized precipitation-evapotranspiration index (SPEI) variables at monthly (1 month) and seasonal (3 and 6 months) time scales. Dark and light grey indicate the significant coefficients of thinned and unthinned stands, respectively. Lowercase and uppercase letters on the y-axis refer to the current year of growth and the year before, respectively (j=January to n=November of the current year; O=October to D=December of the previous year of growth). (Q): pure oak; (QA): oak mixed with alder; (QB): oak mixed with two valuable broadleaves; (QBA): oak mixed with two valuable broadleaves and alder.
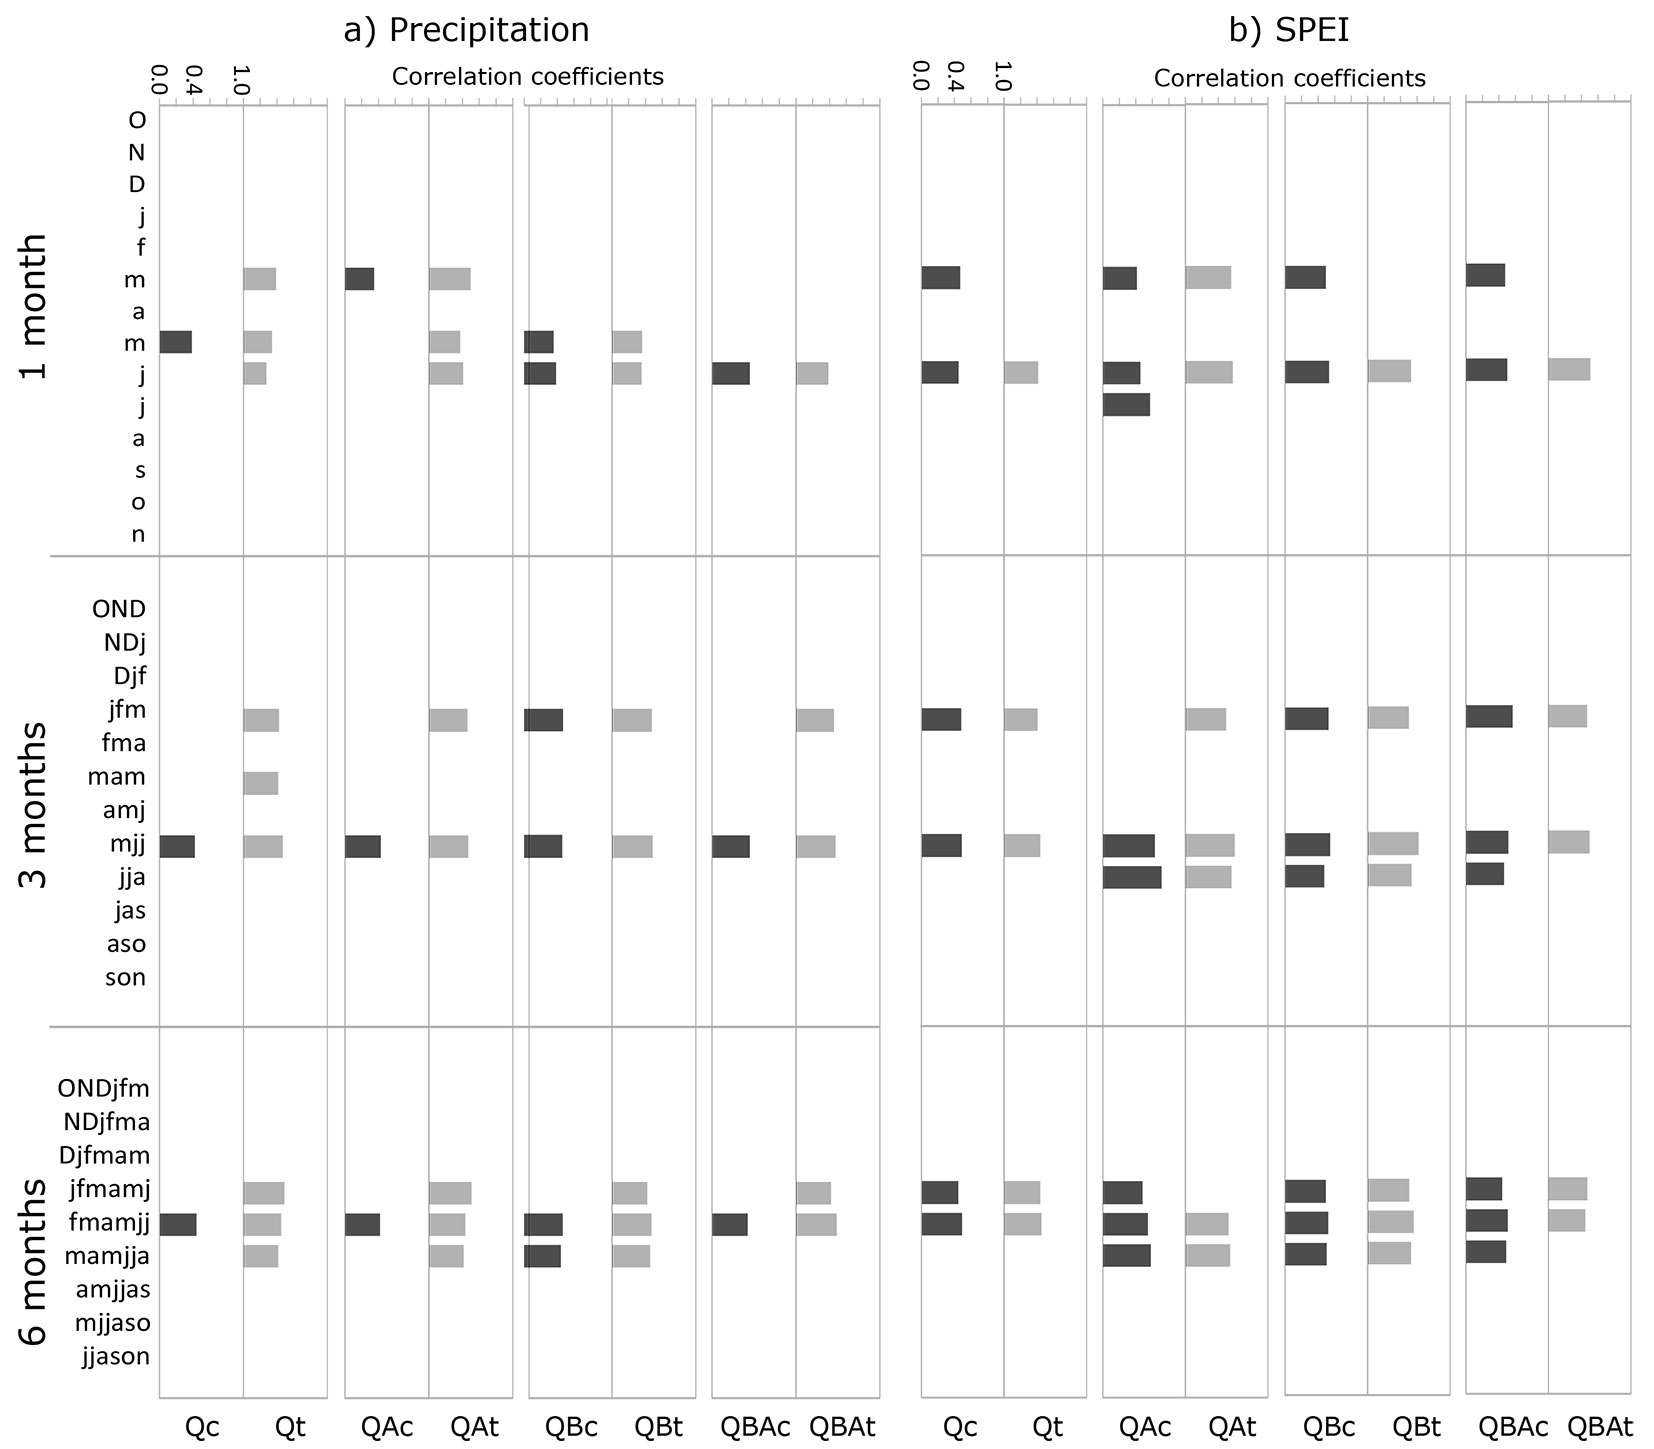
Regarding SPEI, the general pattern of correlations with growth appeared almost like that of precipitation, with j (June), mjj (May-June-July) and fmamjj (seasonal drought period of 6 months from February to July of the current year) as the main variables significantly correlated with tree growth (Fig. 4b). In addition, when SPEI variables were tested, more significant correlations were found than with precipitation, both at the monthly and seasonal scale (Fig. 4b).
Correlations between mean temperature and tree growth were much less significant than those between growth and precipitation or SPEI, without evident differences among species mixture and between thinned and unthinned stands. These low significant correlations were clearer at the seasonal scale, without significant correlations for seasonal periods of 6 months. March and June temperatures were the main common variables negatively correlated with tree growth (Fig. S1 in Supplementary material).
Climate-driven growth dynamics
Including the main significant climatic predictors that resulted from the climate-growth correlation analysis in the linear mixed-effects model (LMM), we obtained contrasting results when the two variables “treatment” and “species mixture” were added as random effects. The only effect of treatment as random variable was much more significant than that of the species mixture both for precipitation and SPEI predictors, as expected. The 3-month variables mjj (May-June-July) was the primary climatic drivers for tree growth, expressed as BAI, both for precipitation and SPEI, explaining 62.1% and 63.6% of the total variance, respectively (Tab. S1 in Supplementary material). Including the species mixture in the LMM weakly improved the random effect of treatment, slightly increasing both the R2c and the variance explained by this random effect, as reported in Tab. S1 (Supplementary material).
The year 2012 resulted as the negative pointer year, which coincides with the lowest June and May-June-July precipitation and SPEI values, which were below the critical thresholds (lower than the mean by one standard deviation). The percentage of trees showing the negative pointer year in 2012 was high in all the stands sampled, ranging from 76% in QBc to 96% in QBt and Qt.
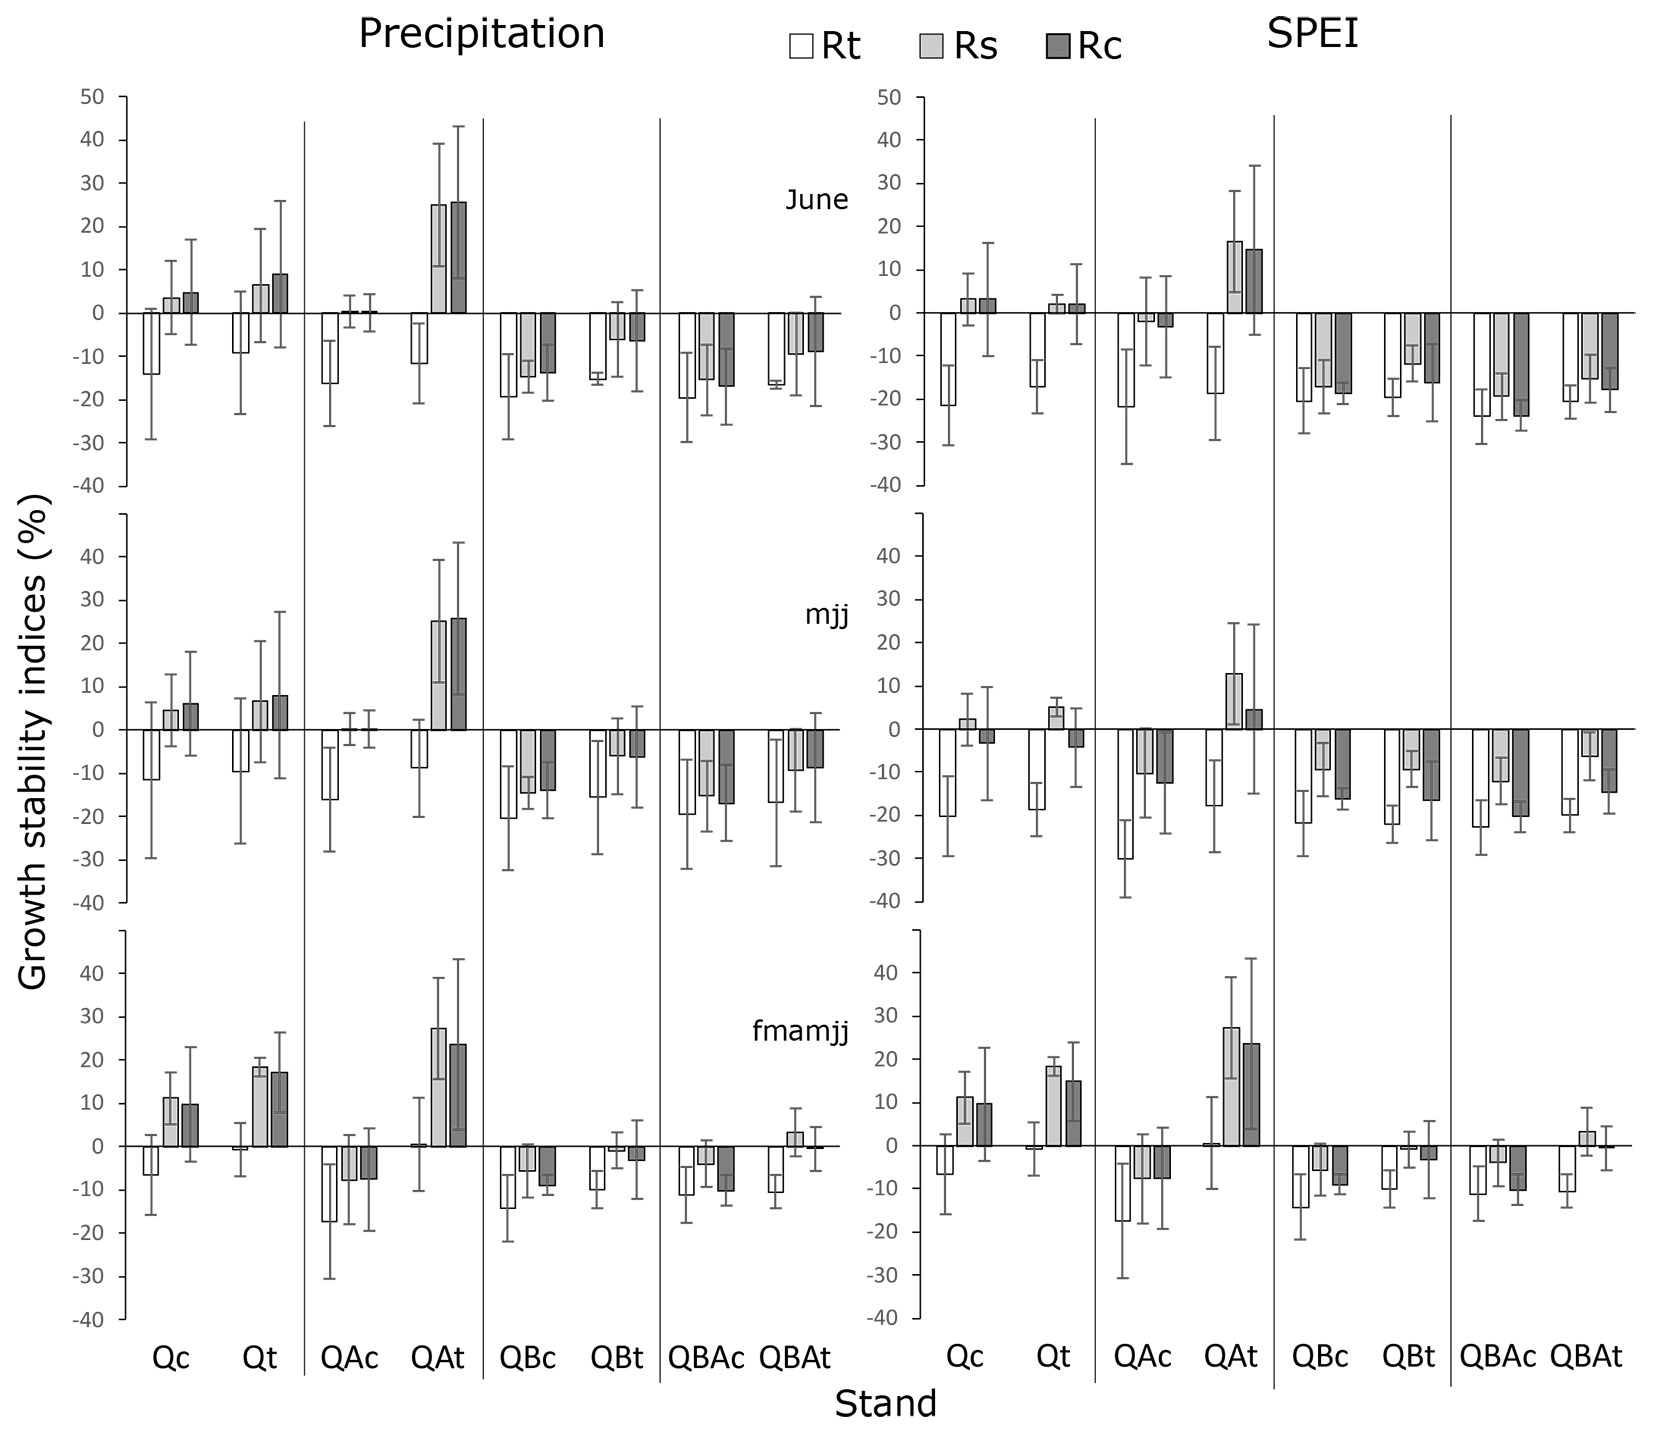
Regarding the components of growth stability, resistance indices (Rt) showed a strong reduction during the critical years, especially considering the predictors with the shortest time scale (monthly and 3 months), both for precipitation and SPEI (Fig. 5). The low resistance of tree growth to long-term drought appeared less pronounced in pure stands. Increasing the time scale of both climatic predictors from monthly to 6 months, the effect of thinning on resistance indices appeared more significant especially in the mixture with alder (QAt), with an increase of about 64%. Resilience indices (Rs) in the mixture with alder revealed the highest growth levels after the critical years, considering all the main predictors for precipitation and mainly 6 months for SPEI, but only in the thinned stands (Fig. 5). The pure stands (Q) showed positive values which increased as the time scale of both climatic predictors increased (from monthly to 6-months period), though this increase was less pronounced than for thinned stand mixed with alder (QA - Fig. 5). The effect of thinning on resilience indices when increasing the time scale of both climatic predictors was positive in all stands except for the mixture QB, increasing the growth rates mainly in the pure Q stand (+70%), followed by QA and QAB mixtures (+23% and +17%, respectively). The recovery index (Rc) showed a pattern similar to resilience index, with the highest values again in the mixture with alder after thinning (QAt) followed by pure Q stands (Fig. 5). In this case, increasing the timescale of climatic predictors from monthly to 6-months periods showed that the effect of thinning on the growth recovery after critical years was more significant for the pure Q stand (+63%), followed by QA, QAB, and QB mixtures (+19%, +15% and +11%, respectively).
Fig. 5 - Resistance (Rt), resilience (Rs) and recovery (Rc) indices linked to components of growth stability (% ± SE) in basal area increments averaging from 1 to 3 years before and after critical years. (Q): pure oak; (QA): oak mixed with alder; (QB): oak mixed with two valuable broadleaves; (QBA): oak mixed with two valuable broadleaves and alder.
Discussion
Effects of thinning and mixture on growth dynamics and stem quality
The selection of native pedunculate oak as target species in the reforestation planning provided very satisfactory results, especially considering all the degradation processes occurred in the opencast mining areas at our study site. The percentage of seedlings rooting was higher than 95%, with high growth rates during the early stages and mortality around 25% ([10]). Survival of planted pedunculate oak trees also reached high values, in line with the survival rates (70-80%) often achieved in recently restored coal mine planting ([11]). After about 40 years since the establishment, the stands show high growth rates and good health, demonstrating the success of the restoration. Indeed, although spontaneous forests regeneration is feasible and may be desirable when site conditions are favourable ([12]), the reforestation process at our study site seemed to be faster than the natural colonization by native trees. In this regard, a dynamic successional process of colonization by spontaneous tree and shrubs species (e.g., Acer campestre L. and Cornus sanguinea L.) started only a few years ago (data not shown).
According to many studies on the reforestation of degraded lands, we found a significant impact of thinning and species composition on planted trees ([39], [2], [18], [31]). The increasing coherence in synchronization since the last thinning among the tree-ring chronologies, as well as the increase in their correlation coefficients, points to similar thinning effects affecting the growth of pedunculate oak in the long period. However, the thinning-induced growth rate of oak trees was different among species, as shown in Fig. 3b.
The positive effect of thinning in terms of increase of growth rates in the first 5 years after planting was more significant in the pure oak stand and in the mixed stand without alder. In these stands, both oak and other broadleaf tree competitors were felled, thus allowing for free crown growth and development of the selected trees. On the contrary, in the stands with alder (QA and QBA), the growth response to thinning in the following 5 years was lower because the alder, a less competitive species but still able to influence the oaks’ growth, has been widely released. On the other hand, 10 and 15 years after planting (long-term effect), the thinning-induced growth rate of oak trees increased in the mixed stands with alder. In this case, the positive effect of thinning may be mainly attributed to the soil improvement (N-fixing effect) and the beginning of alder self-thinning and mortality, significantly reducing the competition between species ([31]). Moreover, 10 and 15 years after the establishment, in mixed stands with broadleaves (QB and QBA), ash showed higher growth and response to thinning than oak, becoming again competitive with oak.
In many mixed plantations where pedunculate oak was intercropped with alder species, after the first period of about 10-15 years, natural mortality (self-thinning) of alder trees was observed ([10], [2]). This phenomenon is caused by the progressive increase in the competition for light exerted by oak, which has large crown and thus shading effect. The initial mortality of alder trees can be considered an advantage because it allows to delay the first thinning for oak and adopt more flexible management criteria. These advantages are generally higher in poor than in fertile soils ([22], [20]) and enable rapid development and improvement of stem quality of various tree species as observed in central Italy ([10]) and in England ([9]).
The availability of N can increase for a non-N-fixing species growing in a mixture with an N-fixing species, inducing an enhancement of water use efficiency and productivity ([2]). The increase in N availability for a non-N-fixing species such as pedunculate oak can be driven by the decomposition of plant and microbe tissues with a consequent N release into the soil ([14]). At a nearby site, in a mixed stand of pedunculate oak with alder, a significantly higher soil N content was found compared to that in a pure pedunculate oak stand (+52% - [8]).
The significant reduction in the growth rate of oak trees in the pure stand may suggest that the positive effect of the first thinning is over and consequently, additional thinning intervention are needed.
The effect of thinning and mixture on stem quality is evident. The best results were obtained in thinned and mixed stands with alder, where more than 70% of the stems were suitable for industry transformation (classes A and B). Thinning resulted in a high quality of the selected tree stems, maintaining free crowns, and reducing the growth stress due to the competition with neighbors ([10], [31]). In addition, the presence of alder can affect, mainly in the juvenile phases, the shape of the oak stems due to both its rapid growth and the conical shape of the crown. As observed in other studies ([9], [10], [20]), the use of tree nurse species such as alder has favored a robust and straight growth of oaks.
Effects of thinning and mixture on climate-growth relationships
The positive influence on tree growth of June and May-June-July precipitation during the current year of ring formation confirmed the high sensitivity to spring-early summer rainfall, as typically reported in other studies on this oak species ([41], [42], [40]). Correlations between tree-ring growth and monthly and seasonal climatic variables of the previous year were not significant, confirming that pedunculate oak is not significantly conditioned by climate during the previous year, according to findings for this species in a lowland forest of Northern Spain ([41]). Similarly, Bose et al. ([3]) found that precipitation and water balance in the current year, particularly during summer and excluding the northern sites, were more relevant for growth of pedunculate oak than the climatic conditions occurring the summer of the previous year.
In any case, the influence of climatic factors on oak tree growth was significantly influenced by thinning-induced effects, resulting in the main pattern of climate-growth relationships common among species mixtures. Both correlation analysis and linear mixed-effects models (LMM) confirmed this pattern, above all when increasing the timescale of the climatic variables from monthly to a period of 6-months. Indeed, in the thinned stands we found a large number of significant correlations between climate and tree growth for each species mixture. Likewise, LMM showed that assessing the influence of the main climatic predictors, the effect of treatment on tree growth was much more significant than that of the species mixture. Considering the precipitation cumulated over 3- and 6-month periods, the effect of thinning was significant in allowing trees to utilize rainfall in winter to early spring (from January to March) and until August. Thinned stands usually have higher net under-canopy precipitation than unthinned stands because of a lower interception by the tree canopy ([25]). For broadleaves, this may allow an increase in the proportion of water reaching the soil and available for trees, thereby enhancing growth rates, particularly during the growing season. On the other hand, the competition for water availability can make trees growing in high-density stands more vulnerable to drought ([26]).
During the critical years, oak trees experienced the negative effect of drought with a significant growth reduction (low resistance), mainly when drought occurred as monthly and 3-months events (June and May-June-July). On the other hand, the resistance of trees appeared less affected when considering the effect of drought or rainfall reduction over six consecutive months from February to July, especially when pedunculate oak was in pure stands. In the frame of the European pedunculate oak tree-rings network, Bose et al. ([3]) found that pedunculate oak did not experience growth decline in response to summer water shortage but only to spring and winter drought. At our study site, the seasonal-driven growth decline during the critical drought years seemed to be slightly shifted towards the early summer months (May-June-July or seasonal period of 6 months from February to July of the current year). Moreover, summer drought can affect more negatively oak growth compared with northern latitudes, as our study site is closer to the southern limit of the species’ range and therefore to the precipitation limit of its ecological niche ([16]).
The reduced influence of long-term drought events on tree resistance is more evident when comparing pure with mixed stands without thinning. We observed the same pattern for both resilience and post-drought recovery. Additionally, these two indices were positive only for oak trees from the pure stand. These results suggest that in high-density stands, the inter-specific competition in mixed stands is stronger than the intra-specific competition in pure oak stands. Other studies have highlighted the importance of stand composition for tree- and stand-level drought responses. In Central Europe, intraspecific and interspecific interactions had contrasting effects on silver fir and Norway spruce forests, with spruce being less resistant to severe droughts when mixed with fir and beech ([4]). At our study site, a general seasonal-driven growth decline could result in a competitive advantage for other broadleaf tree species over pedunculate oak.
The thinning effect slightly mitigated radial growth reductions of oak trees during drought (resistance), as already reported in other Quercus and broadleaf species ([44]) and produced a general improvement in the magnitude of resilience and post-drought growth recovery. Overall, the positive impact of thinning on growth performance of trees after drought has been demonstrated for several species and regions ([44] and references therein). The larger flow of under-canopy water in thinned stands, as well as the increase in light availability and better photosynthetic capacity due to the leaves’ water potential increase, may have enhanced growth rates ([33], [31]). In particular, the improved interception of light rainfall by the tree canopy during critical years (e.g., summer drought) may significantly increase the amount of water reaching the soil ([25]).
Regarding the species mixture, oak trees in the pure stand showed a significant increase in the magnitude of resilience and post-drought growth recovery, especially considering the effect of drought over 6 consecutive months. This might suggest a gradual acclimation to drought after exposure to prolonged events. Resistance and acclimation to prolonged drought have been proven for Norway spruce growing mixed with European beech in a 5-year throughfall exclusion experiment ([36]). In our case, the competition for resources among the released trees could be decreased after a prolonged drought, balancing their long-term growth recovery rates.
Pedunculate oak trees mixed with alder (N-fixing species) significantly improved their resilience and post-drought recovery after both short- and long-term drought or rainfall reduction. On the other hand, when mixed with other broadleaves, N availability in the soil for oak trees most likely decreased due to the competition with narrow-leaved ash, and wild cherry.
Conclusion
Thinning was the main factor affecting growth performance and drought-driven growth dynamics of pedunculate oak trees at our study site. The mixture of pedunculate oak with Italian alder (N-fixing species), combined with thinning, appeared the most advantageous management option, promoting satisfactory tree stem quality, long-term basal area increments, and an improvement in the magnitude of resilience and post-drought recovery of growth. In contrast, the presence of other broadleaves reduced oak tree growth rates, mainly due to the strong interspecific competition with narrow-leaved ash trees.
The mixture of pedunculate oak with Italian alder in the reforestation of abandoned mines has also additional advantages. The characteristics of the latter species (N-fixing, medium-lived tree, self-thinning, etc.) allows to delay the age of the first thinning of the stand, and therefore its mixture with oak can be considered the best management option for the environmental and productive recovery of opencast lignite mines.
Acknowledgements
We are grateful to the personnel of ENEL co., especially Enzo Leprai, for sites access and collaboration. We wish to thank Claudio Bidini (CREA - Research Centre for Forestry and Wood) for his help in the fieldwork.
References
CrossRef | Gscholar
CrossRef | Gscholar
Gscholar
Gscholar
CrossRef | Gscholar
CrossRef | Gscholar
Gscholar
CrossRef | Gscholar
Authors’ Info
Authors’ Affiliation
Gianluigi Mazza 0000-0002-2744-2330
Leonardo Papini
Francesco Pelleri 0000-0003-2055-0280
CREA Research Centre for Forestry and Wood, Arezzo (Italy)
Corresponding author
Paper Info
Citation
Manetti MC, Mazza G, Papini L, Pelleri F (2022). Effects of mixture and management on growth dynamics and responses to climate of Quercus robur L. in a restored opencast lignite mine. iForest 15: 391-400. - doi: 10.3832/ifor4108-015
Paper history
Received: Apr 01, 2022
Accepted: Jul 27, 2022
First online: Oct 05, 2022
Publication Date: Oct 31, 2022
Publication Time: 2.33 months
Copyright Information
© SISEF - The Italian Society of Silviculture and Forest Ecology 2022
Open Access
This article is distributed under the terms of the Creative Commons Attribution-Non Commercial 4.0 International (https://creativecommons.org/licenses/by-nc/4.0/), which permits unrestricted use, distribution, and reproduction in any medium, provided you give appropriate credit to the original author(s) and the source, provide a link to the Creative Commons license, and indicate if changes were made.

Web Metrics
Breakdown by View Type
Article Usage
Total Article Views: 29462
(from publication date up to now)
Breakdown by View Type
HTML Page Views: 24064
Abstract Page Views: 2963
PDF Downloads: 1877
Citation/Reference Downloads: 4
XML Downloads: 554
Web Metrics
Days since publication: 1359
Overall contacts: 29462
Avg. contacts per week: 151.75
Article Citations
Article citations are based on data periodically collected from the Clarivate Web of Science web site
(last update: Mar 2025)
Total number of cites (since 2022): 1
Average cites per year: 0.25
Publication Metrics
by Dimensions ©
Articles citing this article
List of the papers citing this article based on CrossRef Cited-by.
Related Contents
iForest Similar Articles
Research Articles
Scots pine’s capacity to adapt to climate change in hemi-boreal forests in relation to dominating tree increment and site condition
vol. 14, pp. 473-482 (online: 18 October 2021)
Research Articles
Growth-climate relations and the enhancement of drought signals in pedunculate oak (Quercus robur L.) tree-ring chronology in Eastern Hungary
vol. 11, pp. 267-274 (online: 29 March 2018)
Research Articles
Species interactions in pure and mixed-species stands of silver fir and European beech in Mediterranean mountains
vol. 14, pp. 1-11 (online: 02 January 2021)
Research Articles
Impact of climate change on tree-ring growth of Scots pine, common beech and pedunculate oak in northeastern Germany
vol. 9, pp. 1-11 (online: 13 October 2015)
Research Articles
Effect of restoration methods on natural regeneration in the Brazilian Atlantic Forest
vol. 18, pp. 23-29 (online: 15 February 2025)
Research Articles
Optimizing silviculture in mixed uneven-aged forests to increase the recruitment of browse-sensitive tree species without intervening in ungulate population
vol. 11, pp. 227-236 (online: 12 March 2018)
Technical Advances
Improved estimates of per-plot basal area from angle count inventories
vol. 7, pp. 178-185 (online: 17 February 2014)
Research Articles
Long-term effects of thinning and mixing on stand spatial structure: a case study of Chinese fir plantations
vol. 14, pp. 113-121 (online: 08 March 2021)
Research Articles
Tree-oriented silviculture: a new approach for coppice stands
vol. 9, pp. 791-800 (online: 04 August 2016)
Research Articles
Tree aging does not affect the ranking for water use efficiency recorded from δ13C in three Populus deltoides × P. nigra genotypes
vol. 12, pp. 272-278 (online: 21 May 2019)
iForest Database Search
Search By Author
Search By Keyword
Google Scholar Search
Citing Articles
Search By Author
Search By Keywords
PubMed Search
Search By Author
Search By Keyword


