Co-benefits of biomass and biodiversity in a protected mountain forest of West Java, Indonesia
iForest - Biogeosciences and Forestry, Volume 16, Issue 2, Pages 62-69 (2023)
doi: https://doi.org/10.3832/ifor4068-015
Published: Mar 05, 2023 - Copyright © 2023 SISEF
Research Articles
Abstract
Tropical mountain forests are relatively less disturbed and store a large amount of carbon in tree biomass. A high level of species diversity compared to the boreal and temperate forests is also maintained and indicates a positive relationship with tree biomass on a small scale or at plot level. This study aimed to estimate above-ground biomass stocks (AGB) and disentangle the influence of forest structure and attributes on AGB in a small mountain forest. Forty 400 m² plots were randomly established in Takokak Nature Reserve (TNR), a 60-ha protected area at an elevation between 1150-1560 m a.s.l., located in West Java, Indonesia. All trees within the plot were identified, and their respective diameter at breast height (DBH) was measured. AGB was calculated using a global allometric model. Five independent variables, i.e., stem density, stem density of large trees (DBH >50 cm), community weighted mean wood density, rarefied species richness, and Fisher’s alpha index, were analysed using a linear model. Our results showed that AGB in TNR was comparable to other forest types in Indonesia and acted as carbon storage in the mountain regions. AGB in the TNR reached 486 Mg ha-1, of which 75% was contributed by large trees (DBH >50 cm). Three species, i.e., Liquidambar excelsa (Altingiaceae), Schima wallichii (Theaceae), and Lithocarpus sp. (Fagaceae), represent at least 70% of the total biomass in the study site. We also found that forest structures and traits, i.e., stem density, stem density of large trees, and community weighted mean wood density, drive AGB variations but not tree diversity indices. However, although diversity indices were not correlated to AGB, we found that TNR is home for endemic and threatened species on the IUCN Red List. Therefore, we suggest that the management strategies of the tropical forests should include both the conservation of the carbon stock and biodiversity.
Keywords
Carbon Balance, Climate Change, Climate Mitigation, Endemic Tree, Nature Reserve REDD+, Threatened Species
Introduction
Tropical forests represent only 12% of the global land surface, but they host more than 50.000 tree species ([41]) and about two-thirds of the world’s flowering plant species ([29]). Trees, particularly large trees, are essential structures and often play a pivotal role in forest biomass and C dynamics ([24]). They also store large quantities of carbon in the form of biomass ([42], [3], [34]) by sequestering carbon from the air through photosynthesis and storing it in the trunk, branches, and leaves. Trees are also crucial for soil carbon. Therefore, tropical forests are essential for carbon cycling ([23]) and climate regulation ([7]).
The discussion of how tree diversity enhances carbon stocks in tropical forests has been a prominent research topic in recent years ([37], [31], [43], [26]). To some extent, diversity is expected to lead to facilitation and niche complementarity, increasing productivity and supporting biomass accumulation ([45]). However, studies have found inconsistent results in those relationships. For instance, using Fisher’s alpha metric, Sullivan et al. ([43]) reported the absence of diversity-carbon relationships across tropics at a 1 ha scale. However, they detected a weak positive relationship in tropical forests of Asia, while Amazonia and Africa were absent. Another study in Neotropics reported a positive effect of rarefied species richness on AGB across 59 forest sites from Mexico to Bolivia ([31]). A weak negative relationship was detected in Barro Colorado Island ([37]). They reported species richness (i.e., species number) was negatively correlated with carbon storage in the natural forest but positive in the mixed-species plantation forest. These inconsistent results suggest that tree diversity-carbon relationships may depend on forest type and structure, study scale, diversity measures, and habitat heterogeneity ([37], [26]).
While tree diversity-carbon relationships were inconsistent, AGB was correlated with forest structure ([24], [26]), and stem density is the prominent driver of AGB ([31]). Individual tree size variation typically shapes forest structure, primarily due to large trees influencing AGB ([42], [3]). Across the tropics, 70% of AGB variation was explained by the density of large trees (DBH >70 cm - [42]). Another pan-tropical study reported that large trees could predict forest structure properties related to AGB, such as mean diameter, basal area, Lorey’s height, and community-weighted wood density ([4]). This shows that stem density and large trees are expected to drive AGB variation, including mountain forests.
Another driver of AGB variation is functional traits. Wood density is a functional trait used as a good predictor of AGB through an allometric model ([11]). The value of wood density or its variation are linked to tree growth, tree mortality rates, and carbon investment ([10]). It correlates with morphological, mechanical, physiological, and ecological properties. Further, community-weighted wood density was found to be affected by human activities. For example, in Amazonian forests, Berenguer et al. ([6]) reported that the average wood density in human-modified forests was significantly lower than in undisturbed forests, affecting their ability to store carbon in the future. Studies in the undisturbed forests, either in lowland or mountain forests in Indonesia, showed a high range value of AGB from 242 to 418 Mg ha-1 ([12], [14], [35], [34]), and it is also significantly higher than human-modified forests.
While the number of tropical trees carbon studies is increasing, more studies are still needed to advance our understanding of the drivers of tropical AGB, especially in a mountain forests, i.e., a forest with an elevation of 1000 m a.s.l. or higher ([46]). By far, mountain forests are less explored and still less coverage for forest carbon monitoring than other tropical lowland forests in Indonesia ([8]). Several studies showed that above-ground tree biomass greatly varied across mountains ([20], [34]). Therefore, to predict the future global carbon balance, we need to understand the drivers of AGB variation in mountain regions, especially on a local scale. This study used data from a 60-ha protected mountain forest in Cianjur (Indonesia) to examine the influence of structural, functional, and compositional parameters on AGB. Therefore, the aims of the study were to (i) estimate AGB stocks and (ii) disentangle the influence of tree diversity, forest structure, and functional traits on AGB in a small protected mountain forest in Indonesia.
Materials and methods
Study site
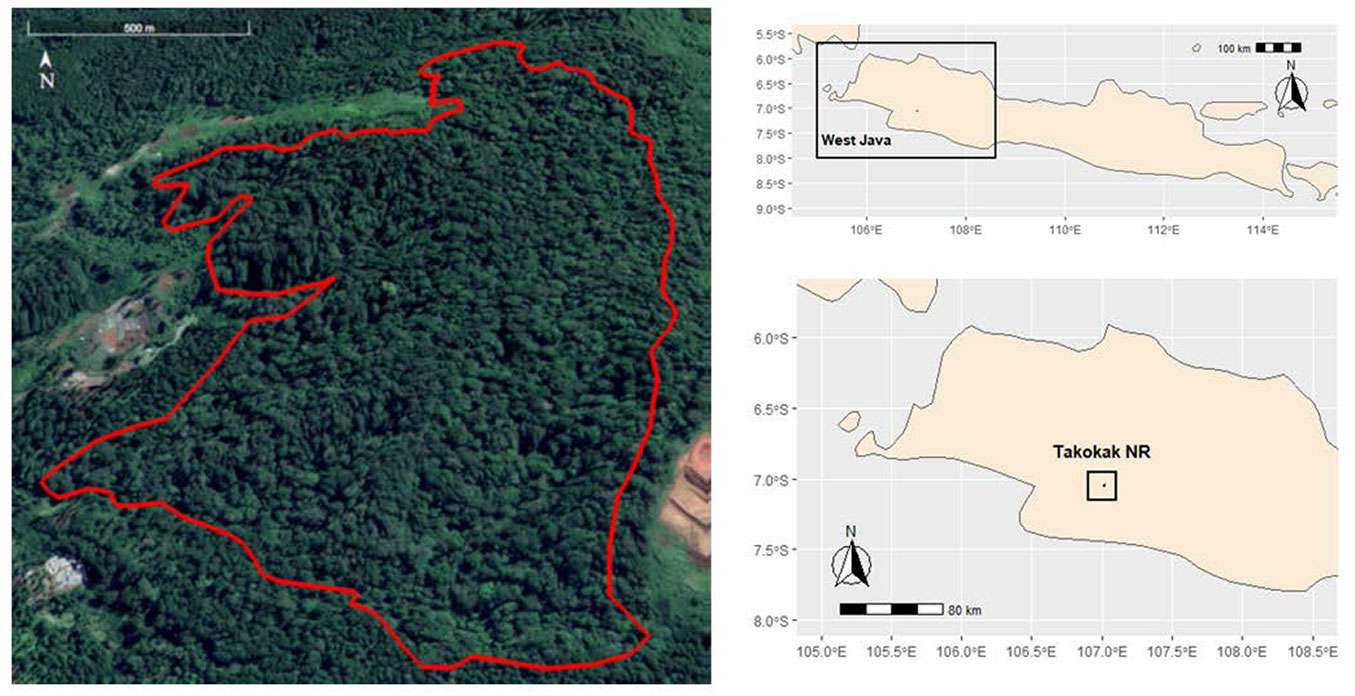
We carried out the study in the mountain forest of Takokak Nature Reserve (TNR), which lies between 107° 12′ 15″ - 107° 42′ 15″ E and 07° 02′ 25″ - 07° 03′ 06″ S (Fig. 1). The forest of the TNR is estimated at ca. 60 ha and is located in Cianjur Regency, West Java, Indonesia. The minimum and maximum daily temperature reached 20 °C and 30 °C, respectively, with annual rainfall of about 4993 mm ([5]) and classified as Af climate, which refers to a humid tropical climate with minimum annual precipitation of 60 mm yr-1 ([21]). The topography of the forest consists of a rolling hilly landscape with the lowest and highest elevation of 1150 and 1560 m a.s.l., respectively. The forest hosts typical Indonesian mountain flora, e.g., Liquidambar exelsa (Altingiaceae), Castanopsis argentea (Fagaceae), Schima wallichii (Theaceae), Quercus spp. (Fagaceae), Litsea spp. (Lauraceae), and Dacrycarpus imbricatus (Podocarpaceae). Our study also found an endangered Dipterocarp species, Dipterocarpus retusus, that grows well in the forest ([25]). The forest is also suitable for endemic fauna, such as Sus vitasus, Gallus gallus varius, Spilornis colaplidua, Macaca fascicularis, Trachypithecus auratus, Hylobates moloch, Presbytis comata, Spizaetus bartelsi, and Halcyon cianopentris ([5]).
Fig. 1 - Map of the study site at Takokak Nature Reserve, West Java, Indonesia. The solid red line in the left panel shows the border of the nature reserve.
Biomass and tree height estimation
We established forty 20 × 20 m² plots at random within the TNR, equal to 2.7% of sampling intensity. All trees with a diameter at breast height (DBH) ≥10 cm were systematically recorded, mapped, and identified to the lowest possible taxonomic level within the plots. All trees were grouped into three DBH classes, i.e., small (10-30 cm), medium (30-50 cm), and large trees (>50 cm) following classification done in the nearby mountain site by Rozak et al. ([34]). Trees were identified by parabotanist, and herbarium vouchers were deposited in Herbarium Bogor Botanic Gardens. A total of 601 trees were identified at species (85.4%) and genus (14.6%) levels. Moreover, we identified about 70 tree species from 32 families (Tab. S1 in Supplementay material).
The above-ground biomass of each species (AGBi, eqn. 1) was estimated using a generic allometric model ([11]). The variable used in the model were DBH (in cm), wood density (WD, in g cm-3), and tree height (H, in m). We utilised the generic allometric model because it was reported to be more accurate than the local models ([38]). Variable WD of each species was taken from the Global Wood Density Database ([10]). If species were not present in the database or identified to genus level only, the genus-level average was used to estimate the wood density ([40]). The tree height of each species (Hi, eqn. 2) was estimated using a generic model developed for the Southeast Asia region based on DBH data ([16]). We used a regional tree height allometric because tree DBH-height relationships differ significantly between regions, affecting AGB estimation ([16]). Those two equations related to biomass estimation are as follows (eqn. 1, eqn. 2):
We also calculated community weighted mean wood density for each plot (CWDj, eqn. 3) as a plant functional trait variable ([27]). We weighted the wood density of each plot (WDj) by the total basal area of each plot (BAj); therefore, the equation is as follows (eqn. 3):
Data analysis
Tab. 1 - All variables observed across the forty 0.04-ha plots with units, the average value, minimum value (Min), first quantile value, third quantile value, and maximum value (Max).
| Variable | Unit | Average | Min | 1st quantile | 3rd quantile | Max |
|---|---|---|---|---|---|---|
| Biomass | Mg ha-1 | 486.08 | 32.89 | 264.55 | 579.96 | 1638.37 |
| Diameter at breast height | cm | 34.05 | 10.00 | 19.00 | 42.70 | 157.20 |
| Wood density | g cm-3 | 0.58 | 0.30 | 0.53 | 0.65 | 0.87 |
| Stem | ha-1 | 247.11 | 19.35 | 149.61 | 338.59 | 469.01 |
| Basal area | m2 ha-1 | 50.00 | 9.75 | 33.25 | 61.00 | 127.25 |
| Rarefied richness | species | 3.31 | 2.26 | 2.85 | 3.54 | 4.79 |
| Fisher’s alpha | - | 14.75 | 2.08 | 5.04 | 13.39 | 117.45 |
Linear models (eqn. 4) were developed to test the relationship between forest structure (i.e., stem density - X1, and stem density of trees DBH >50 cm - X2), tree functional trait (i.e., community weighted mean wood density, CWD - X3), and species richness indices (i.e., rarefied richness, X4 and Fisher’s alpha, X5) on above-ground biomass (AGB, Y). Two variables, AGB and Fisher’s alpha, were log-transformed to fulfil the normality assumption and, therefore, minimise heteroscedasticity of residuals. We also performed a backward stepwise selection removing the nonsignificant variables from the full model ([47]). Since our data have varying value ranges (Tab. 1), all variables were standardised by subtracting the value by its mean and dividing it by two standard deviations of each plot ([17]). Variance Inflation Factor (VIFj, eqn. 4) was calculated to assess the collinearity of the variables ([39]). VIF was calculated based on the coefficient of determination (Rj2) of the linear model (eqn. 4):
We found VIF <5 in the full model, indicating no collinearity effects (Fig. S1 in Supplementary material). The model was then inspected and validated for normality of the residuals (Fig. S2, Fig. S3). Pearson’s correlation coefficients were also conducted to investigate the strength of a linear association between two variables ([22]). All analyses were carried on in R ([32]), benefiting the RStudio platform. The rarefied richness and Fisher’s alpha were estimated using the “vegan” package ([28]), and wood density data were collected by utilising the “BIOMASS” package ([33]) from the global wood density database ([10]). Data of AGB in plot level were corrected by its respective plot inclination and presented as mean with a 95% confidence interval after 1000 bootstrap replication.
Results
Biomass stock in Takokak Nature Reserve
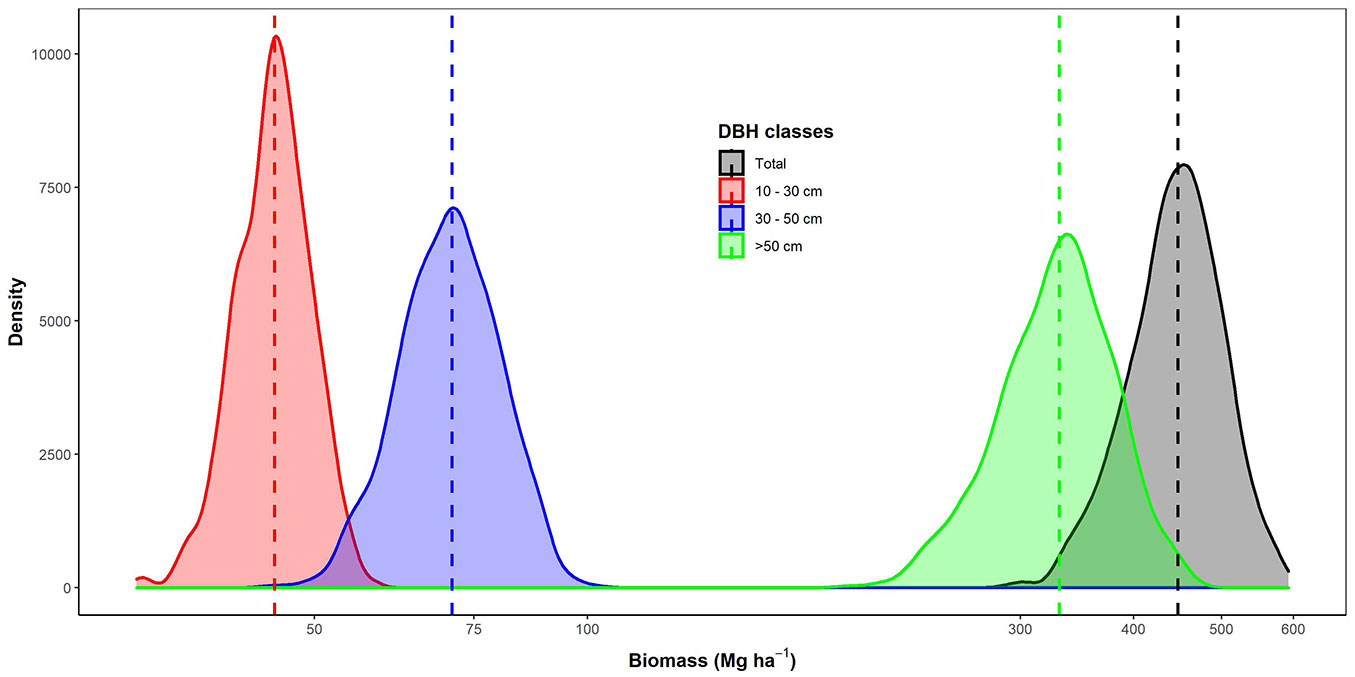
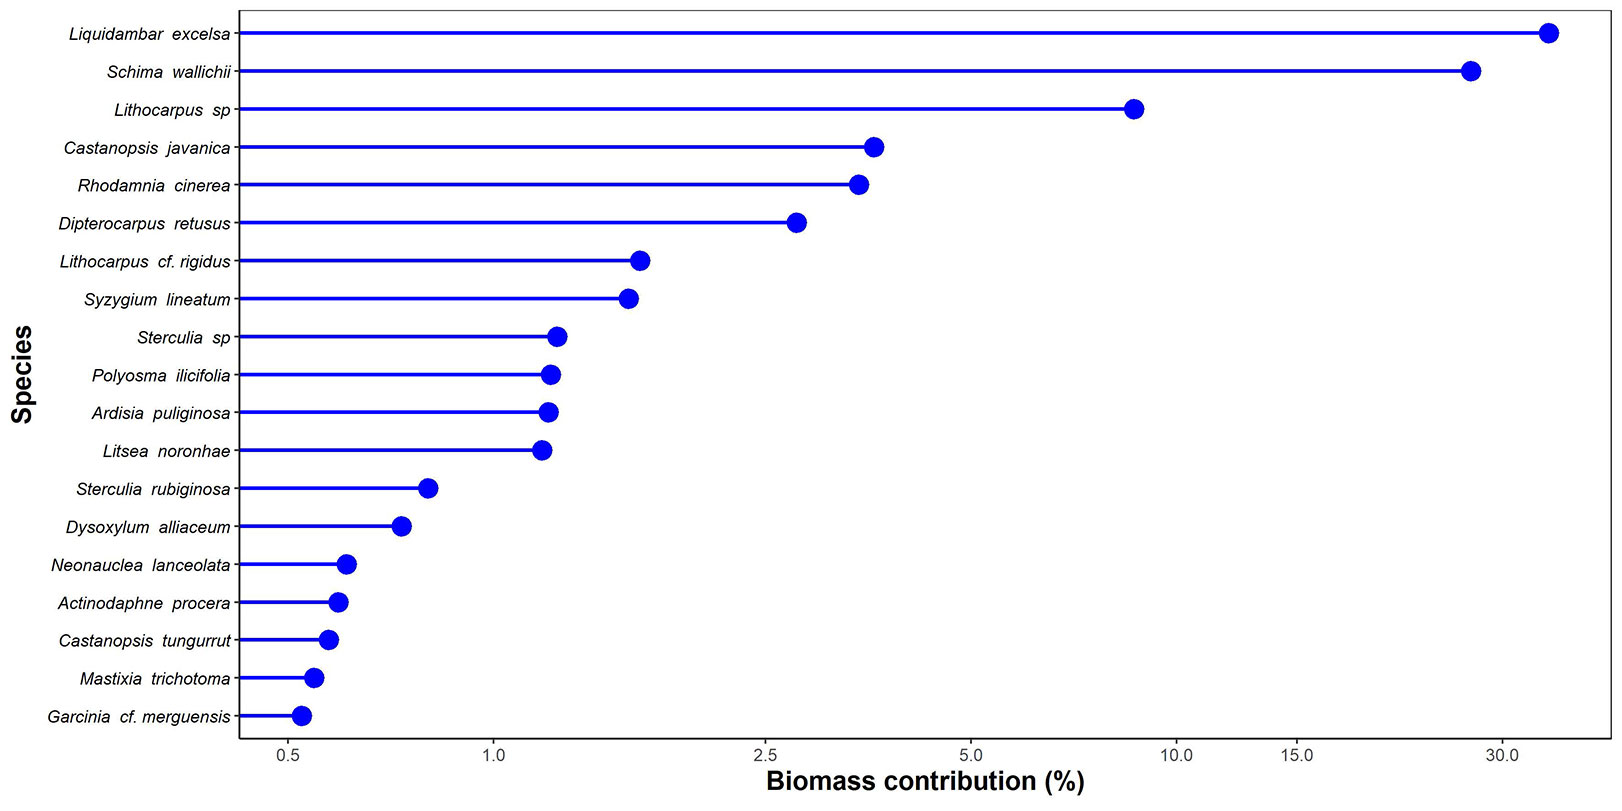
Estimated AGB in the TNR reached 448 Mg ha-1 (95% CI: 345-551 Mg ha-1 - Fig. 2). Large trees contributed ca. 75% to the total biomass that reached 331 Mg ha-1 (95% CI: 239-428 Mg ha-1). Small and medium trees only contributed 10% (45 Mg ha-1, 95% CI: 37-54 Mg ha-1) and 16% (71 Mg ha-1, 95% CI: 55-89 Mg ha-1) to the total AGB, respectively. Of those stocks, only three species, i.e., Liquidambar excelsa (Altingiaceae), Schima wallichii (Theaceae), and Lithocarpus sp. (Fagaceae), represented 71% of the total biomass (Fig. 3).
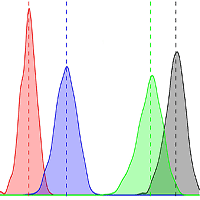
Fig. 2 - Biomass variation for each diameter class. Vertical lines show their mean biomass for each diameter class, respectively.
Drivers of biomass in Takokak Nature Reserve
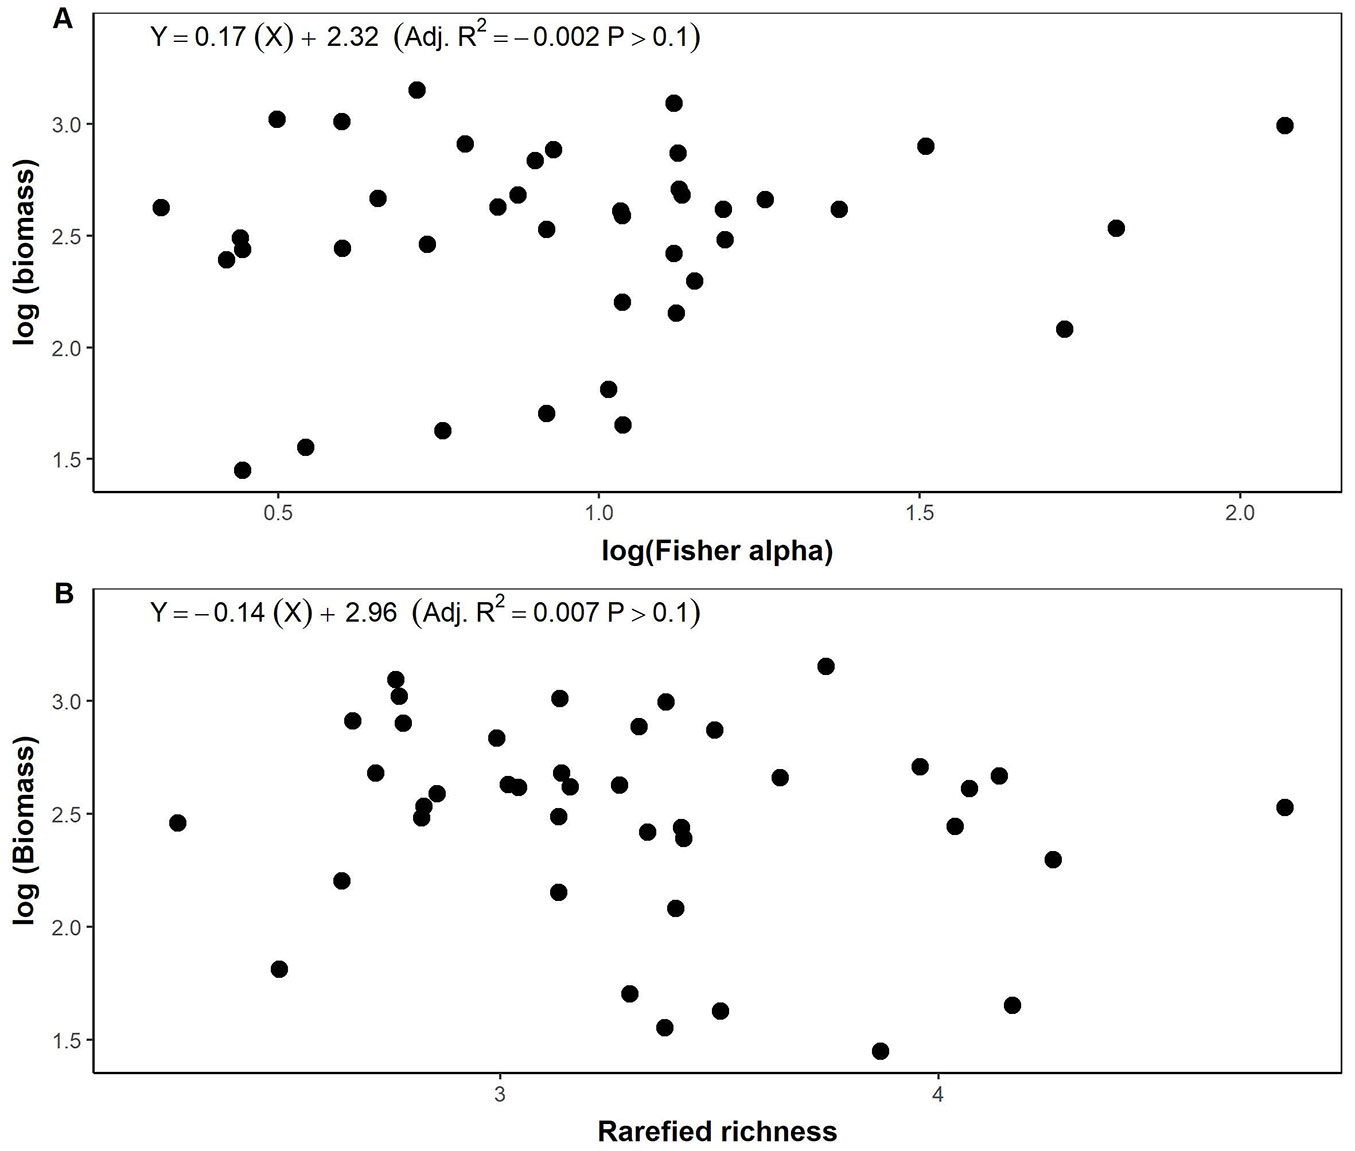
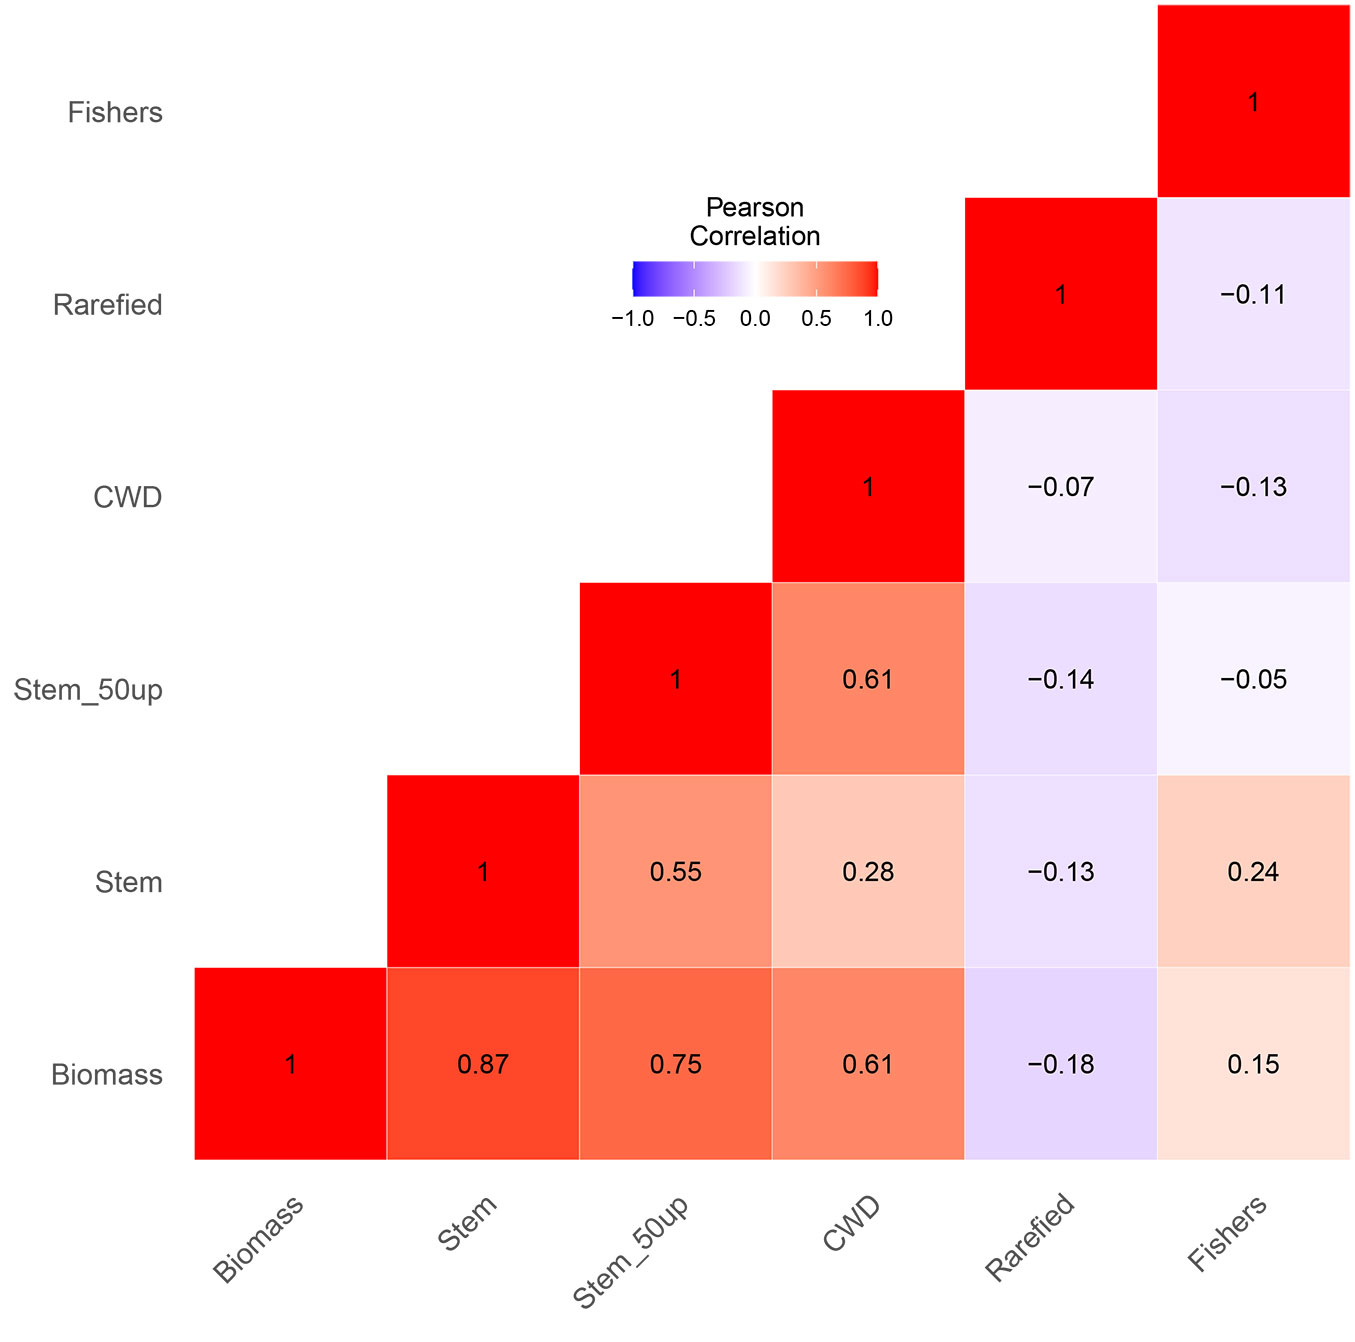
The explanatory variables in the full model explained 90% of the total variance of AGB (Tab. 2). Stem density, large trees, and CWD were the main drivers explaining AGB variation (Adj. R² = 0.90, p-value <0.001 - Tab. 2). We found no significant influence of rarefied richness and Fisher’s alpha on the AGB full model (Tab. 2). Analysed separately, the respective diversity indices, i.e., Fisher’s alpha (Adj. R² = -0.01, p-value >0.1) and rarefied richness (Adj. R² = 0.01, p-value >0.1), did not significantly explain the variation of AGB (Fig. 4). The results of the full linear model (Tab. 2) were in line with the Pearson’s correlation analysis (Fig. 5). Stem density, stem density of trees DBH >50 cm, and CWD had significant effects on AGB with Pearson’s coefficient values of 0.87, 0.75, and 0.60, respectively.
Tab. 2 - Statistical summary of the linear model of the full model and after backward stepwise selection. (***): p<0.0001; (**): p<0.001; (*): p<0.01.
| Model | Response | Predictor | Estimate | Standard error |
t-value | Pr(>|t|) | AICc | Adjusted R2 |
p-value |
|---|---|---|---|---|---|---|---|---|---|
| Full model | AGB | Intercept | -1.59e-16 | 2.50e-02 | 0.00 | 1.00 | -23.22 | 0.90 | <2.2e-16 |
| Stem | 6.54e-01 | 6.42e-02 | 10.19 | 7.24e-12*** | |||||
| Stem 50up | 1.96e-01 | 7.45e-02 | 2.63 | 0.013* | |||||
| CWD | 3.07e-01 | 6.41e-02 | 4.78 | 3.29e-05*** | |||||
| Rarefied | -4.45e-02 | 5.14e-02 | -0.87 | 0.393 | |||||
| Fisher | 4.35e-02 | 5.40e-02 | 0.80 | 0.43 | |||||
| Backward stepwise selection | AGB | Intercept | -1.55e-16 | 2.48e-02 | 0.00 | 1.00 | -27.15 | 0.90 | <2.2e-16 |
| Stem | 6.74e-01 | 6.06e-02 | 11.13 | 3.34e-13*** | |||||
| Stem 50up | 1.92e-01 | 7.31e-02 | 2.63 | 0.013* | |||||
| CWD | 3.01e-01 | 6.34e-02 | 4.74 | 3.31e-05*** |
Fig. 4 - The relationship be-tween (A) log(biomass) and log(Fisher’s alpha) and (B) rarefied richness.
Fig. 5 - Pearson’s correlation among variables. Numbers indicate Pearson’s coefficient values. (Biomass): aboveground biomass; (CWD): community weighted mean wood density; (Fishers): Fisher’s alpha; (Rarefied): rarefied richness; (Stem): stem density; (Stem_50up): stem density of tree DBH >50 cm.
Discussion
Our study aims to estimate the amount of AGB stocks in a small protected lower montane forest in West Java (Indonesia), namely Takokak Nature Reserve (TNR). This study also evaluates the possible factors affecting the AGB in this area. The influencing factor will become essential information for forest managers and related stakeholders for maintaining optimum AGB within the study location in particular and Indonesian tropical montane forest in general.
Above-ground biomass in montane forests
AGB stocks in our study site reached 447 Mg ha-1 and were dominantly driven by the biomass of big trees (Fig. 2). Our estimated AGB was found to be relatively higher than other montane forests in Indonesia. In the montane forest of Central Sulawesi, AGB was estimated in the range of 301-323 Mg ha-1 ([12]). While, in the montane forest of Mount Rinjani (Lombok), the AGB was estimated at 92-242 Mg ha-1 ([14]). The average potential of AGB stocks in Takokak NR was also relatively higher than in the surrounding mountains of our study site. For instance, in Mount Salak (West Java), the average AGB only reached 365 Mg ha-1 ([2]), and in Mount Gede Pangrango (West Java) reached 375 Mg ha-1 ([34]). Further, AGB in our study site was comparable to the Dipterocarp forest of Malinau (North Kalimantan), reaching 482 Mg ha-1 ([36]). Although these comparisons might be confounded by differences in the size of plots sampled across previous studies, our results were relatively higher but not significantly different (to America and Asia forests) to the estimated at pan-tropical moist lowland forests that reached 288, 418, and 393 Mg ha-1 in Neotropical, Palaeotropical, and Asia forests, respectively ([42]).
The total amount of AGB is mainly contributed from three dominant tree species, i.e., Liquidambar excelsa, Schima wallichii, and Lithocarpus sp., representing 71% of the total biomass at the plot level (Fig. 3). These three species are frequently found in mountain ecosystems in West Java Indonesia ([46]). In our study site, those species have the highest basal area of 25.9, 20.3, and 6.99 m² ha-1, respectively (Tab. S1 in Supplementary material). Those species can reach large diameters and are tall in height; consequently, they will have a large canopy where most photosynthetic carbon gain is concentrated ([31]), determining their biomass ([16], [11]). This result confirms the hyper-dominant of large tree species in determining the AGB ([42], [34]), which is in line with other studies in investigating the influence of large trees on forest biomass ([3], [24]).
The influence of forest attributes and structures on AGB in montane forest
Our analysis of the influence of tree diversity indicates a non-statistically significant species richness-AGB relationship (Fig. 4). This result is consistent with other studies in tropical forests that also reported a lack of weak relationships ([31], [43]). However, this is true on a larger scale (plot of >1 ha - [43]). To some extent, biodiversity is expected to increase productivity through the facilitation and niche complementarity of the species. Therefore, biodiversity loss will lead to biomass loss ([9]). In our case, we worked at a small spatial scale (plot of 20 × 20 m), and we expected a positive relationship between species richness and AGB. The contrary results between other studies and ours, perhaps due to the low species richness (Tab. 1) captured within the plot caused by the dominance of a few big trees that regulate AGB in our study site (Fig. 2).
Stem densities, either small or large trees, positively drove the AGB variation (Tab. 2). Our results align with Ullah et al. ([44]). The positive influence of stem density on AGB is linked with the ability of each tree to optimise resource utilisation, such as nutrients and light. It leads to higher productivity, which increases AGB ([1]). We found that tree density averaged 247 stem ha-1 (Tab. 1) and was relatively lower than in other mountain ecosystems in West Java. For example, stem density in Mount Ciremai, Mount Gede Pangrango, and Mount Halimun Salak reached 598, 989, and 750 stem ha-1, respectively ([2], [35], [34]). Therefore, although stem density in our study site is relatively lower, the AGB is comparable to other ecosystems, perhaps due to the hyperdominance of large trees (Fig. 5) as found elsewhere in the tropics ([3], [24]).
CWD was found to positivFig. 5ly correlate with the AGB variation (Fig. 5). This trait was related to its specific wood density and basal area: the higher the specific wood density and the larger the basal area, the higher AGB. CWD can be interpreted as physiological trade-offs related to resource availability ([27]). In our case, resource availability can be defined as rapid growth due to water availability. Our study site has high annual precipitation, reaching 4993 mm yr-1 ([5]); therefore, the tree can use the resources available to grow optimally, particularly for trees with DBH >50 cm (Tab. 2). These large trees can reach the top of the canopy and maximise the sunlight for photosynthesis due to greater total leaf area ([24]). Large trees also can maximise the ability of their deep root systems to absorb water and nutrient in the soil ([30]). The combination of those factors then will ultimately lead to higher productivity and AGB.
Biomass and biodiversity conservation in montane forest
Assessing the relationships between tree species richness and AGB is crucial for the effective management of the tropical forest, such as carbon sequestration and biodiversity conservation within the Reducing Emissions from Deforestation and forest Degradation (REDD+) framework scheme ([15]). Although species richness indices were not significantly related to AGB (Tab. 2), it consists of important species for conservation. In our study site, several recorded species composing the montane flora (the complete list of the species is available in Tab. S1) are known to be endemic to Java (e.g., Pinanga javana, Arecaceae) and categorised as Threatened species by IUCN Red List, such as Dipterocarpus retusus, Dipterocarpaceae (Endangered, EN), Castanopsis tungurrut, Fagaceae (Endangered, EN), and Lithocarpus indutus, Fagaceae (Vulnerable, VU) ([19]). These species are an important component of montane forests in Java and have significant conservation value as flagship species for promoting biodiversity conservation. Considering that TNR is a relict montane forest in West Java, apart from Mount Gede Pangrango and Mount Halimun Salak, the populations of these species could contain valuable genetic resources for future conservation programs such as population enhancement or reintroduction as well as habitat restoration. The forest area in Java has been severely affected by deforestation and degradation. West Java, where the TNR was located, had lost around 40% of its montane forest since 1990 ([18]). Therefore, TNR has a significant value in carbon storage and biodiversity conservation for endemic and threatened tree species under these circumstances and could be classified as Important Plants Areas (IPA) in the tropics ([13]).
Conclusion
Our study provided an AGB estimation in a mountain rainforest and disentangled the effect of forest structures and attributes on AGB. We found that the AGB in TNR was comparable to other forest types in Indonesia. We also found that three variables, i.e., stem density, stem density of large trees, and community weighted mean wood density, drive AGB variation. Further, no correlation was found between AGB and species diversity indices, indicating a neutral influence of biodiversity on carbon balance in the forests. However, our study site was diverse in tree diversity and it is home to several endemic and threatened trees listed in IUCN Red List. Therefore, conservation strategies of mountain forests should be applied simultaneously between carbon-centred- and biodiversity- conservations.
Acknowledgements
AHR, YWCK, and DIJ contribute equally to this work as the main contributor. AHR, YWCK, and DIJ designed the project, conducted fieldwork, and performed the analysis. AHR wrote the first draft of the manuscript. AHR, YWCK, and DIJ wrote, revised, and approved the manuscript.
We want to thank the Balai Besar Konservasi Sumberdaya Alam (BBKSDA) of West Java (Indonesia) of the Ministry of Environment and Forestry for supporting this research. We would also like to thank Pak Kusnadi of the Herbarium Bogor Botanic Gardens, and Pak Ade Suarna, Pak Ayi Sudrajat, and Pak Syaripudin of Takokak for their essential help during the fieldwork.
This study was carried out in the framework of “Conservation assessment of Indonesian tree species towards the Global Tree Assessment”, a joint project in 2020 between the Research Centre for Plant Conservation and Botanic Gardens of Indonesian Institute of Sciences (LIPI) and the Botanic Gardens Conservation International (BGCI).
References
CrossRef | Gscholar
CrossRef | Gscholar
CrossRef | Gscholar
CrossRef | Gscholar
CrossRef | Gscholar
CrossRef | Gscholar
CrossRef | Gscholar
CrossRef | Gscholar
CrossRef | Gscholar
CrossRef | Gscholar
CrossRef | Gscholar
CrossRef | Gscholar
CrossRef | Gscholar
CrossRef | Gscholar
Gscholar
Authors’ Info
Authors’ Affiliation
Research Centre for Plant Conservation, Botanic Gardens, and Forestry, National Research and Innovation Agency -BRIN, Kusnoto Building, Jl. Ir. H. Juanda No. 18, Bogor, West Java 16122 (Indonesia)
Decky Indrawan Junaedi 0000-0001-5846-6135
Research Centre for Ecology and Ethnobiology, National Research and Innovation Agency - BRIN, Kawasan Sains dan Teknologi Dr. Ir. Soekarno, Jl. Jakarta - Bogor Km 46, Bogor, West Java 16911 (Indonesia)
Corresponding author
Paper Info
Citation
Rozak AH, Kusuma YWC, Junaedi DI (2023). Co-benefits of biomass and biodiversity in a protected mountain forest of West Java, Indonesia. iForest 16: 62-69. - doi: 10.3832/ifor4068-015
Academic Editor
Gianluca Piovesan
Paper history
Received: Jan 20, 2022
Accepted: Dec 05, 2022
First online: Mar 05, 2023
Publication Date: Apr 30, 2023
Publication Time: 3.00 months
Copyright Information
© SISEF - The Italian Society of Silviculture and Forest Ecology 2023
Open Access
This article is distributed under the terms of the Creative Commons Attribution-Non Commercial 4.0 International (https://creativecommons.org/licenses/by-nc/4.0/), which permits unrestricted use, distribution, and reproduction in any medium, provided you give appropriate credit to the original author(s) and the source, provide a link to the Creative Commons license, and indicate if changes were made.
Web Metrics
Breakdown by View Type
Article Usage
Total Article Views: 24705
(from publication date up to now)
Breakdown by View Type
HTML Page Views: 19336
Abstract Page Views: 3155
PDF Downloads: 1859
Citation/Reference Downloads: 1
XML Downloads: 354
Web Metrics
Days since publication: 1085
Overall contacts: 24705
Avg. contacts per week: 159.39
Article Citations
Article citations are based on data periodically collected from the Clarivate Web of Science web site
(last update: Mar 2025)
(No citations were found up to date. Please come back later)
Publication Metrics
by Dimensions ©
Articles citing this article
List of the papers citing this article based on CrossRef Cited-by.
Related Contents
iForest Similar Articles
Research Articles
Approaches to classifying and restoring degraded tropical forests for the anticipated REDD+ climate change mitigation mechanism
vol. 4, pp. 1-6 (online: 27 January 2011)
Editorials
Change is in the air: future challenges for applied forest research
vol. 2, pp. 56-58 (online: 18 March 2009)
Research Articles
Predicting impacts of climate change on forest tree species of Bangladesh: evidence from threatened Dysoxylum binectariferum (Roxb.) Hook.f. ex Bedd. (Meliaceae)
vol. 10, pp. 154-160 (online: 25 May 2016)
Research Articles
Voluntary carbon credits from improved forest management: policy guidelines and case study
vol. 11, pp. 1-10 (online: 09 January 2018)
Commentaries & Perspectives
What happened to forests in Copenhagen?
vol. 3, pp. 30-32 (online: 02 March 2010)
Research Articles
Predicting the effect of climate change on tree species abundance and distribution at a regional scale
vol. 1, pp. 132-139 (online: 27 August 2008)
Research Articles
Assessing food sustainable intensification potential of agroforestry using a carbon balance method
vol. 12, pp. 85-91 (online: 24 January 2019)
Research Articles
An assessment of climate change impacts on the tropical forests of Central America using the Holdridge Life Zone (HLZ) land classification system
vol. 6, pp. 183-189 (online: 08 May 2013)
Research Articles
Model-based assessment of ecological adaptations of three forest tree species growing in Italy and impact on carbon and water balance at national scale under current and future climate scenarios
vol. 5, pp. 235-246 (online: 24 October 2012)
Research Articles
Seeing, believing, acting: climate change attitudes and adaptation of Hungarian forest managers
vol. 15, pp. 509-518 (online: 14 December 2022)
iForest Database Search
Search By Author
Search By Keyword
Google Scholar Search
Citing Articles
Search By Author
Search By Keywords
PubMed Search
Search By Author
Search By Keyword

