Predicting impacts of climate change on forest tree species of Bangladesh: evidence from threatened Dysoxylum binectariferum (Roxb.) Hook.f. ex Bedd. (Meliaceae)
iForest - Biogeosciences and Forestry, Volume 10, Issue 1, Pages 154-160 (2016)
doi: https://doi.org/10.3832/ifor1608-009
Published: May 25, 2016 - Copyright © 2016 SISEF
Research Articles
Abstract
The impact of climate change on ecosystems, especially at the species level, can be currently observed in many parts of the world. Species distribution models (SDMs) are widely used to predict the likely changes in the distribution of species in future climate change scenarios. The aim of the present study is to predict the effect of climate change on a valuable threatened tree species Dysoxylum binectariferum in the northeastern part of Bangladesh using the maximum entropy (MaxEnt) model on species’ occurrence data. The future distribution of D. binectariferum was predicted under two scenarios from the IPCC 5th assessment (RCP 4.5, and RCP 8.5) in 2050 and 2070. Model results showed that approximately 32% (2177 km2) of the studied area is currently suitable for this species to grow. However, future predictions obtained by the model projected a complete loss of suitable habitat for D. binectariferum in the studied area by both 2050 and 2070. Therefore, urgent measures are required for the conservation of D. binectariferum in northeastern Bangladesh. The application of species distribution models to simple inventory data (such as the occurrence of the species) may provide policymakers and conservationists with a useful tool for the prediction of future distribution (at both local and regional scales) of poorly known species with high preservation concerns.
Keywords
Habitat Distribution Modeling, Potential Distribution Areas, Reintroduction, MaxEnt, Conservation
Introduction
The geographic distribution of a species is the geographic pattern of its occurrence across a territory and is highly influenced by geographic and environmental factors. Species distribution models (SDMs) can play a significant role in understanding the spatial/geographic pattern of species distribution. SDMs are based on the relationship between the presence records of species and environmental variables, including the climatic ones ([13]). These SDMs are widely used in diverse fields of research, such as biogeography, conservation biology, ecology, evolution, epidemiology, invasive species management, and other fields ([38], [29], [11]).
A number of species worldwide are currently affected by climate change, displaying accelerated changes such as habitat shift towards higher latitudes and altitudes ([27]). In recent years, the importance of understanding the mechanism underlying climate-driven changes in species distribution has been discussed with high concern ([25]). Climate change has already directly affected the distribution and phenology of many species ([21]). This is expected to result in some species being threatened, vulnerable, or even endangered ([36]). Endangered tree species often play an important ecological role in forests, e.g., providing the habitat for many species ([41]). The number of endangered trees is reported to increase worldwide owing to climate change ([7]). To sustainably manage landscape habitats and ecosystems, effective conservation strategies are to be enforced, and this must be done by taking into consideration the spatial pattern of occurrence of threatened species. Therefore, predicting species distribution has become an important part of conservation planning, and a number of SDMs have been developed to this purpose ([15]).
Bangladesh has a unique assemblage of tropical tree species which are currently facing the threat of extinction owing to habitat loss. Climate change is likely to accelerate the process. Unfortunately, to the best of our knowledge, no study has evaluated the impact of climate change on the forest tree species of Bangladesh, and in particular on the distribution of threatened species. Recently, Alamgir et al. ([2]) conducted a study on the potential effect of climate change on the habitat distribution of the Asian elephant and Hoolock gibbon in the Bangladesh forest ecosystems. According to the IUCN Red List, there are 106 threatened plant species in Bangladesh ([19]). Among these, D. binectariferum (Roxb.) Hook.f.ex Bedd., locally known as rata or rangi rata, grows in the semi-evergreen hilly forests of Bangladesh. This species is highly valued owing to the diversity of its uses. In a recent study, Jain et al. ([18]) found that the bark of D. binectariferum could be a new source of anticancer drugs. However, no conservation efforts have been made over the years to protect this valuable resource. The main objective of this study is to assess the potential geographic distribution of D. binectariferum in future climate change scenarios. The results will be useful in planning conservation strategies, thereby enhancing the resilience of this threatened forest tree species to climate change.
Materials and methods
Study area
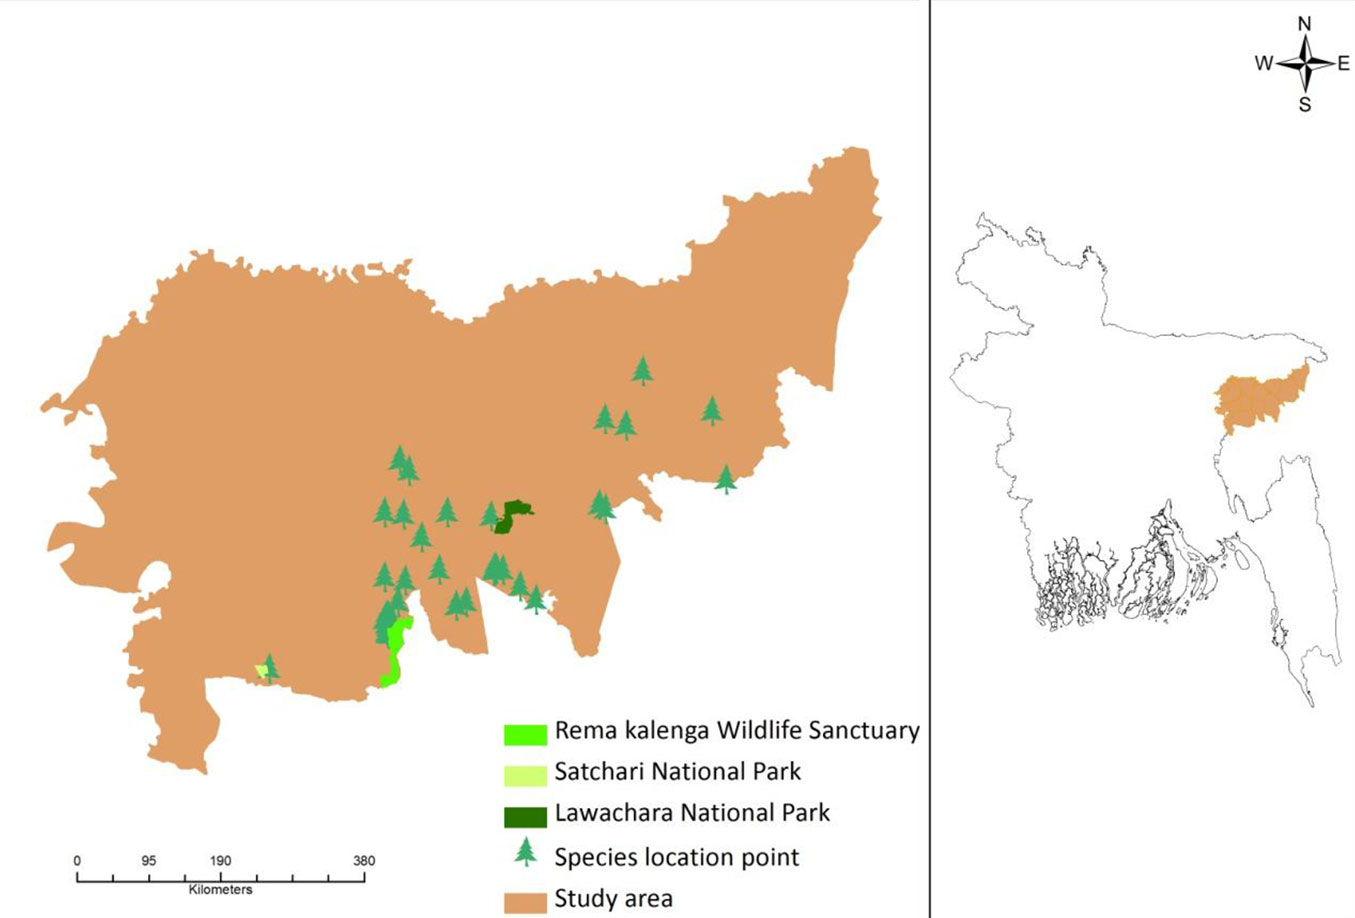
This study was conducted in the north-eastern part of Bangladesh, a region that is experiencing an increasing trend of temperature and rainfall over time ([1]). The area comprises two different districts (Moulvibazar and Habiganj), which are considered the major biodiversity hotspots of Bangladesh ([34]), and include three protected areas currently managed under an Integrated Protected Area Co-management (IPAC) system: the Lawachara National Park, the Rema-Kalenga Wildlife Sanctuary, and the Satchari National Park (SNP - Fig. 1). Few scattered forest areas still exist adjacent to these protected areas.
Fig. 1 - Map of the study area showing the D. binectariferum location points and the three protected areas inside the region (left panel). The geographic location of the area analyzed in this study (Moulvibazar and Habiganj districts) is also shown (right panel).
In the Lawachara National Park, 167 plant species, 26 mammalian species (including 5 non-human primates), 246 bird species, 4 amphibian, and 6 reptile species have been recorded so far ([24]). The forest is semi-evergreen ([6]) with a canopy height varying from 10 m to 30 m. The top canopy mainly comprises Tectona grandis, Artocarpus chaplasha, Tetrameles nudiflora, Hopea odorata, and Toona ciliata. The second canopy comprises Syzygium grande, Syzygium jambos, Syzygium cumini, Gmelina arborea, Ficus benghalensis, Dillenia pentagyna, Grewia asiatica, Ficus infectoria, and many more plant species. The understory includes Bambusa tulda, Alstonia scholaris, Eupatorium odoratum etc. together with several ferns and epiphytes ([23]). The original indigenous mixed tropical evergreen vegetation was logged in the 1920s. The soil of Lawachara is alluvial brown sandy clay loam to clay loam ([23]).
SNP has more than 200 plant species ([24]). Acidic soils (sandy loam to silt clay) dominate this area and the relief is characterized by a gently undulating plain changing to a hilly topography. The prominent vegetation type in SNP is mixed tropical evergreen forest ([5]). The relatively undisturbed forest is almost entirely restricted to the national park. At present, areas outside the reserved forest are being extensively converted into agricultural fields, fruit orchards, human settlements, sungrass (Saccharum spontaneum) fields including plantations of fast-growing timber species. Most plantations are dominated by exotic species such as Acacia spp., Eucalyptus camaldulensis, Tectona grandis, Albizia falcataria and Elaeis guineensis, forerunners of the palm oil industry in the country planted in this area during the mid-seventies ([24]).
Rema-Kalenga wildlife sanctuary has 167 bird species, 37 species of mammals, and 638 plant species ([24]). The soil texture is sandy loam to silty clay and acidic. The terrain of the national park is undulating with slopes and hillocks, locally called tila, ranging from 10-50 m, scattered in the forest. The forest is drained by a number of small, sandy-bedded streams ([23]).
Studied species and data
The genus Dysoxylum includes approximately 80 species growing naturally in SE Asia, Southern China, New Guinea, Eastern and Northern Australia, New Caledonia, Fiji, and the Indian subcontinent (Sri Lanka, Bhutan, Nepal, India, and Bangladesh - [28]). In Bangladesh, Dysoxylum binectariferum is a tree species growing up to 9 m in height, naturally distributed in semi-evergreen forests of hilly regions, and currently threatened by overexploitation. It is mostly used for building and furniture, and is considered an important source of Ayurvedic medicine in India, mainly for its use in treating rheumatism ([26]). A recent study showed that D. binectariferum has anticancer treatment potential ([18]).
Data on the presence of D. binectariferum in the two aforementioned districts were collected by field surveys conducted in 2013-2014, totaling 69 records. Global Positioning System (GPS) was used to record the presence point in the field. The GPS coordinates were then converted to decimal degree format.
Climate data
Nineteen bioclimatic variables ([17] - Tab. 1) with 30-second (1 km) spatial resolution were obtained from the WorldClim dataset (⇒ http://www.worldclim. com), and used to detect the most influential variables associated with the present and future distribution of D. binectariferum. Future climate scenario data for the years 2050 and 2070 (based on IPCC 5th assessment data) were downloaded from the WorldClim dataset (⇒ http://www.worldclim. com), and used to project the potential distribution of the species under climate change. These data sets were downscaled and calibrated using WorldClim 1.4 as baseline “current” climate data. Two future greenhouse gas concentration trajectories, called as Representative Concentration Pathways (RCP) 4.5 and RCP 8.5 were selected for the periods 2050 and 2070, respectively. The RCP 4.5 is a relatively stable scenario where the total radiative forcing reaches 4.5 W m-2 by 2100 and further stabilises owing to the adoption of green technologies ([39]). Contrastingly, in RCP 8.5 emissions continue to increase throughout the 21st century ([22]). In this scenario, radiative forcing is predicted to reach up to 8.5 W m-2 by 2100 ([32]). A Global Circulation Model (GCM), known as “Hadley Global Environment Model 2 Carbon Cycle” (HadGEM2-CC) and widely employed for simulating RCPs ([33]), was used in this study. To reduce the influence of highly correlated variables, a multi-collinearity test was conducted to check cross-correlation among variables. Variables showing pairwise Pearson’s correlation coefficient |r| ≥ 0.8 were excluded from the analysis (Tab. 2). Based on such criterion, 14 bioclimatic variables were excluded and only 5 bioclimatic variables were used in the final model to predict the effect of climate change on the future distribution of D. binectariferum (Tab. 1).
Tab. 1 - List of the bioclimatic variables included in the initial and final MaxEnt model.
| Variable | Description | Final model | |
|---|---|---|---|
| Yes | No | ||
| BIO1 | Annual Mean Temperature | - | - |
| BIO2 | Mean Diurnal Range (Mean of monthly max temp - min temp) | - | x |
| BIO3 | Isothermality (BIO2/BIO7)·100 | - | x |
| BIO4 | Temperature Seasonality (standard deviation·100) | - | x |
| BIO5 | Max Temperature of Warmest Month | - | x |
| BIO6 | Min Temperature of Coldest Month | - | x |
| BIO7 | Temperature Annual Range (BIO5-BIO6) | x | - |
| BIO8 | Mean Temperature of Wettest Quarter | - | x |
| BIO9 | Mean Temperature of Driest Quarter | - | x |
| BIO10 | Mean Temperature of Warmest Quarter | x | - |
| BIO11 | Mean Temperature of Coldest Quarter | x | x |
| BIO12 | Annual Precipitation | - | x |
| BIO13 | Precipitation of Wettest Month | - | x |
| BIO14 | Precipitation of Driest Month | - | x |
| BIO15 | Precipitation Seasonality (Coefficient of Variation) | x | - |
| BIO16 | Precipitation of Wettest Quarter | - | x |
| BIO17 | Precipitation of Driest Quarter | x | - |
| BIO18 | Precipitation of Warmest Quarter | - | x |
| BIO19 | Precipitation of Coldest Quarter | - | x |
Tab. 2 - Pairwise correlation matrix (Pearson’s correlation coefficients, r) between bioclimatic variables. Variables showing |r| ≥ 0.8 were discarded from the analysis, and only BIO7, BIO 10, BIO 11, BIO 15, BIO 17 were included in the model.
| Variable | BIO19 | BIO1 | BIO2 | BIO3 | BIO4 | BIO5 | BIO6 | BIO7 | BIO8 | BIO9 | BIO10 | BIO11 | BIO12 | BIO13 | BIO14 | BIO15 | BIO16 | BIO17 | BIO18 |
|---|---|---|---|---|---|---|---|---|---|---|---|---|---|---|---|---|---|---|---|
| BIO19 | 1.00 | -0.66 | 0.04 | 0.95 | -0.45 | -0.92 | 0.24 | -0.65 | -0.83 | -0.06 | -0.58 | -0.06 | 0.77 | 0.69 | 0.72 | -0.25 | 0.73 | 1.00 | 0.70 |
| BIO1 | - | 1.00 | -0.54 | -0.68 | -0.15 | 0.61 | 0.41 | 0.07 | 0.77 | 0.70 | 0.80 | 0.70 | -0.46 | -0.42 | -0.58 | 0.21 | -0.44 | -0.66 | -0.41 |
| BIO2 | - | - | 1.00 | 0.08 | 0.84 | 0.19 | -0.94 | 0.71 | -0.09 | -0.92 | -0.16 | -0.92 | -0.25 | -0.26 | 0.12 | -0.41 | -0.27 | 0.04 | -0.27 |
| BIO3 | - | - | - | 1.00 | -0.42 | -0.93 | 0.21 | -0.63 | -0.81 | -0.10 | -0.56 | -0.10 | 0.81 | 0.74 | 0.73 | -0.16 | 0.78 | 0.95 | 0.74 |
| BIO4 | - | - | - | - | 1.00 | 0.63 | -0.95 | 0.95 | 0.36 | -0.79 | 0.20 | -0.79 | -0.58 | -0.54 | -0.19 | -0.19 | -0.57 | -0.45 | -0.56 |
| BIO5 | - | - | - | - | - | 1.00 | -0.42 | 0.81 | 0.83 | -0.08 | 0.61 | -0.08 | -0.90 | -0.84 | -0.72 | -0.04 | -0.88 | -0.92 | -0.85 |
| BIO6 | - | - | - | - | - | - | 1.00 | -0.87 | -0.10 | 0.92 | 0.08 | 0.92 | 0.45 | 0.43 | 0.07 | 0.29 | 0.45 | 0.24 | 0.45 |
| BIO7 | - | - | - | - | - | - | - | 1.00 | 0.51 | -0.64 | 0.28 | -0.64 | -0.78 | -0.73 | -0.43 | -0.21 | -0.76 | -0.65 | -0.75 |
| BIO8 | - | - | - | - | - | - | - | - | 1.00 | 0.21 | 0.79 | 0.21 | -0.64 | -0.57 | -0.58 | 0.23 | -0.60 | -0.83 | -0.57 |
| BIO9 | - | - | - | - | - | - | - | - | - | 1.00 | 0.37 | 1.00* | 0.15 | 0.14 | -0.20 | 0.26 | 0.15 | -0.06 | 0.17 |
| BIO10 | - | - | - | - | - | - | - | - | - | - | 1.00 | 0.37 | -0.34 | -0.29 | -0.30 | 0.27 | -0.32 | -0.58 | -0.31 |
| BIO11 | - | - | - | - | - | - | - | - | - | - | - | 1.00 | 0.15 | 0.14 | -0.20 | 0.26 | 0.15 | -0.06 | 0.17 |
| BIO12 | - | - | - | - | - | - | - | - | - | - | - | - | 1.00 | 0.99 | 0.85 | 0.38 | 1.00 | 0.77 | 0.96 |
| BIO13 | - | - | - | - | - | - | - | - | - | - | - | - | - | 1.00 | 0.85 | 0.50 | 1.00 | 0.69 | 0.96 |
| BIO14 | - | - | - | - | - | - | - | - | - | - | - | - | - | - | 1.00 | 0.31 | 0.85 | 0.72 | 0.81 |
| BIO15 | - | - | - | - | - | - | - | - | - | - | - | - | - | - | - | 1.00 | 0.45 | -0.25 | 0.44 |
| BIO16 | - | - | - | - | - | - | - | - | - | - | - | - | - | - | - | - | 1.00 | 0.73 | 0.96 |
| BIO17 | - | - | - | - | - | - | - | - | - | - | - | - | - | - | - | - | - | 1.00 | 0.70 |
| BIO18 | - | - | - | - | - | - | - | - | - | - | - | - | - | - | - | - | - | - | 1.00 |
Prediction modeling
For the prediction modeling, the maximum entropy (MaxEnt) model ([30]) was chosen due to its better performance with small sample sizes as compare with other SDMs ([10]). The MaxEnt model uses presence-only data to predict species distribution based on the theory of maximum entropy ([30]). A total of 500 runs were set for model building. For the studied species, 75% of the presence point data (52 points) was used to calibrate the model, while the remaining 25% (17 points) was used for validation purposes. The area under the curve (AUC) was used to assess the accuracy of the model. Generally, AUC values range from 0 to 1. A high AUC value indicates that the model is performing well. The output from the model gave AUC values ranging from 0 to 1, where 0 indicates a lower probability of distribution and 1 indicates a higher probability or suitability of distribution. To ensure the model’s robustness, 3 replicated model trials were executed with a threshold rule of 10 percentile training presence; this means that 10% of each species records with the lowest predicted values will fall into the absence regions delineated by the model, while the presence regions will encompass the other 90% of records having the highest predicted values. The output distribution records of the MaxEnt model based on the AUC value were further classified into two groups of suitability: Not suitable (<25% of occurrence) and suitable (>25% of occurrence). The jackknife procedure of the MaxEnt model was used to find out which variables had the greatest influence. Jackknife is a statistical estimator of a parameter obtained by systematically leaving out each observation from a dataset, calculating the estimate of the importance and then finding the average of those calculations ([9]). As MaxEnt is a presence/background point-based model, the maximum number of background points was set at 10.000. As only presence data were provided in the model for the species studied (no absence data were available), using background points the model will assume that the species is equally likely to be found anywhere in the landscape analyzed. This means that every pixel has the same probability of being selected as background in the geographic space; likewise, every environment has the same probability of being selected as background, according to its frequency in the environmental space ([31]).
Results
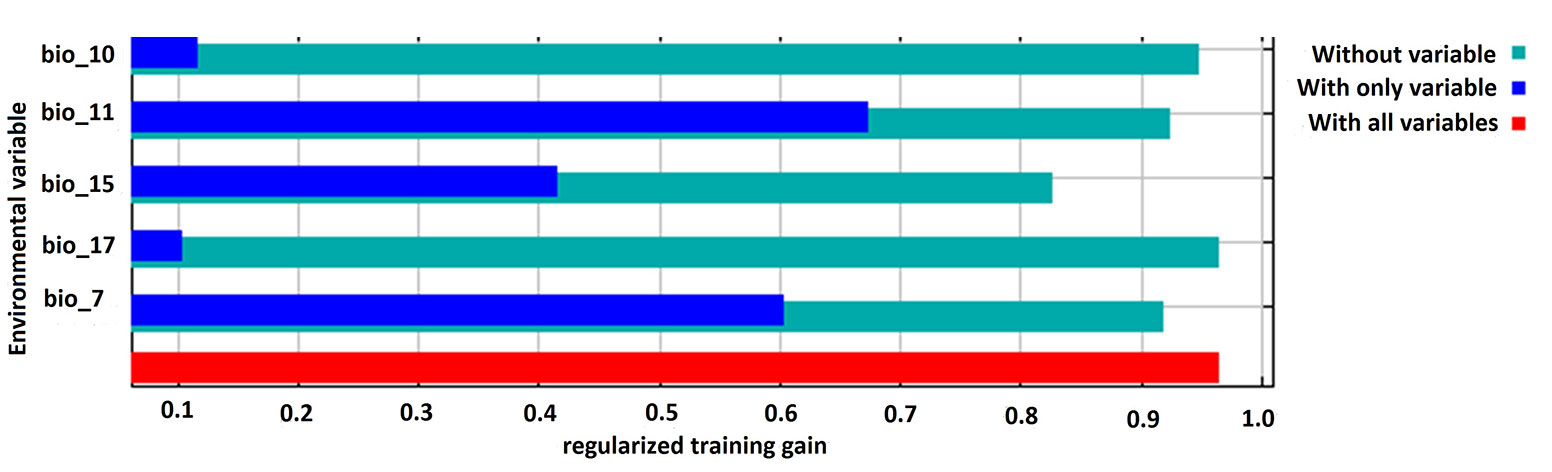
The performance of the model applied was high, with a mean AUC value of 0.89 for the training and test dataset, indicating that the selected variables provided a satisfactory prediction of the distribution of this threatened tree species. Amongst the five bioclimatic input variables, annual temperature range (BIO7) and mean temperature of coldest quarter (BIO11) were the two most influential factors that collectively contributed to 71.6% of the model’s variance, followed by precipitation seasonality (BIO15). Precipitation in the driest quarter (BIO17) made the lowest contribution to the model. The Jackknife test showed that the mean temperature of the coldest quarter (BIO11) had the highest training gain when considered independently. However, the training gain decreased when precipitation seasonality (BIO 15) was excluded from the model (Fig. 2).
Fig. 2 - Result of the jackknife test for assessing the relative contribution of the environmental variables used as predictors to the habitat model. (BIO10): Mean temperature of warmest quarter; (BIO11): mean temperature of coldest quarter; (BIO15): precipitation seasonality; (BIO17): precipitation of driest quarter; (BIO7): temperature annual range.
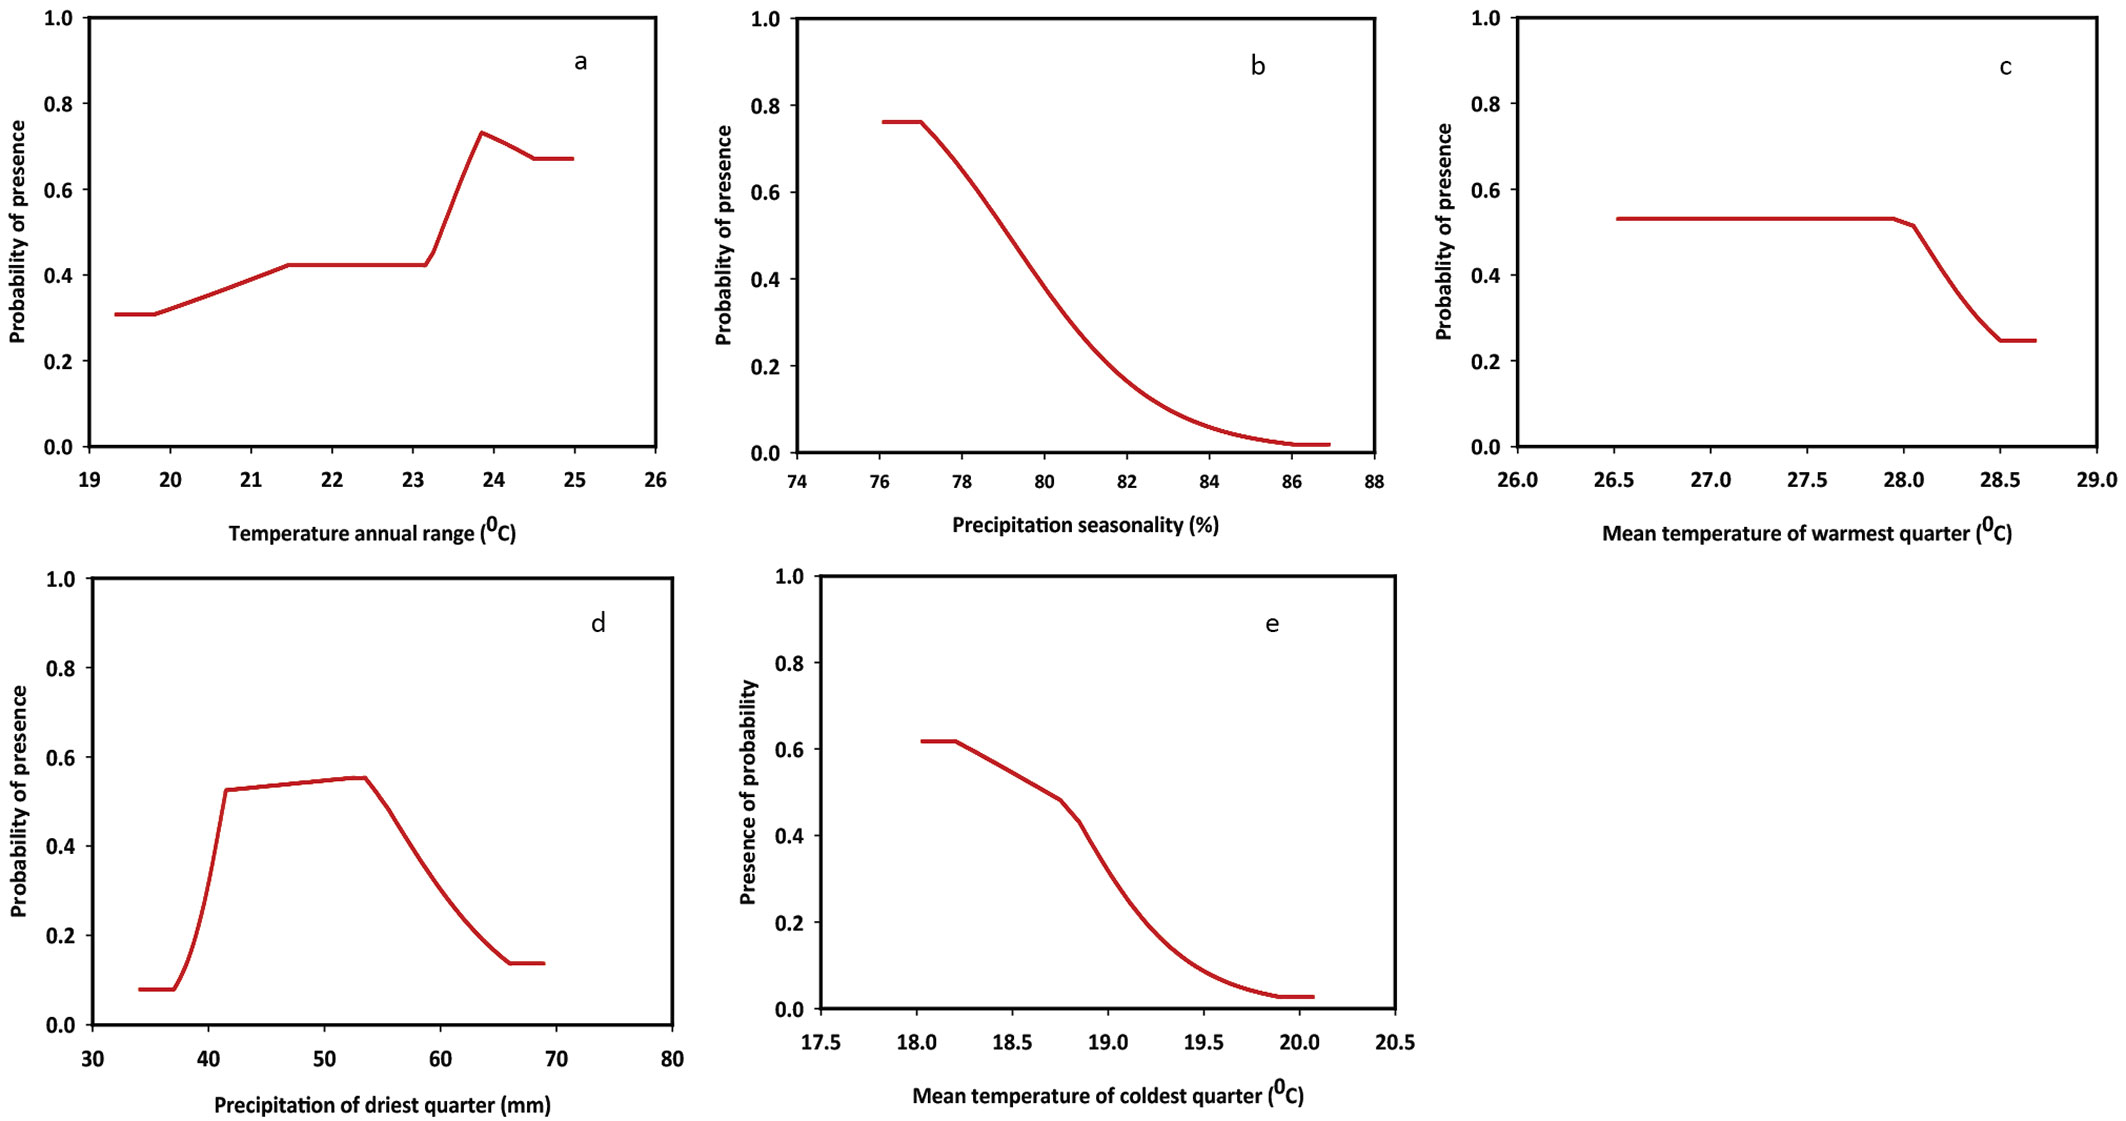
The responses of the species to changes in bioclimatic variables are summarized in Fig. 3. Response curves were obtained by changing the value of each predictor variable while retaining all other variables at their average sample value. As displayed in Fig. 3, the distribution of D. binectariferum is highly controlled by both temperature and precipitation. Annual range of temperature (BIO7) was used to examine whether species distribution was affected by different ranges of extreme temperature conditions. Indeed, the probability of presence of the species in the study area increased with increased annual range of temperature, and was found to be the highest between 23 and 25 °C. Mean temperature of the warmest quarter (BIO10) provides the mean temperatures during the warmest three months of the year, which can be used for examining how such environmental factors affect the seasonal distribution of different species. In our case, D. binectariferum started declining when the temperature exceeded 27 °C during the warmest month. Mean temperature of the coldest quarter (BIO11) provides the mean temperatures during the three coldest months of the year. The probability of the presence of the studied species was high in areas where winter temperature is around 18 °C. Contrastingly, D. binectariferum showed a declining trend at temperatures higher than 18 °C. Precipitation seasonality (BIO15) reflects the rainfall variability, with larger percentages representing a greater variability in precipitation. Based on our results, the studied species was unable to tolerate higher variability (>78%) of rainfall. Furthermore, precipitation of the driest quarter (BIO17) represents the total precipitation during the driest three months of the year. As for this variable, D. binectariferum showed a higher probability of presence in areas characterized by a dry season with rainfall between 40 and 50 mm (Fig. 3).
Fig. 3 - Response curves of bioclimatic variables from the MaxEnt model. (a) Temperature annual range; (b) precipitation seasonality; (c) mean temperature of warmest quarter; (d) precipitation of driest quarter; (e) mean temperature of coldest quarter.
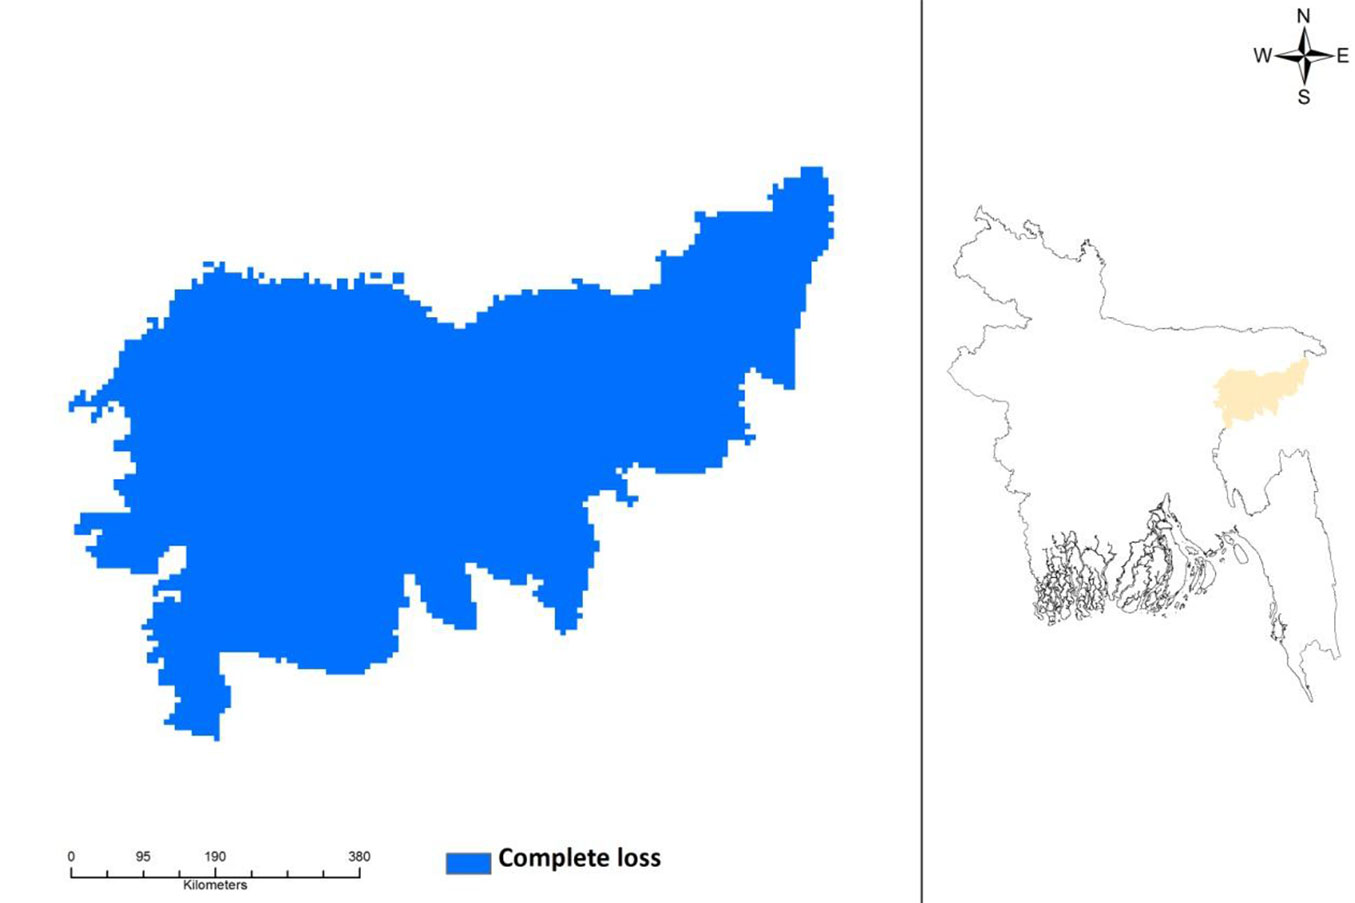
The potential current distribution of D. binectariferum predicted by the MaxEnt model is shown in Fig. 4. Based on model’s predictions, about 2177 km2 (32%) of the studied area is currently suitable for this species. By overlaying the maps of the three protected areas (Lawachara National Park, Satchari National Park, and Rema-Kalenga Wildlife Sanctuary) on the district map, it may be easily noticed that the species is mostly located in and around these protected areas. Considering the impact of climate change on this species, the predicted distribution under IPCC future climate scenarios (RCP4.5 and RCP 8.5) in 2050 and 2070 suggests a complete loss of suitable habitats for the species (Fig. 5).
Fig. 4 - Current potential distribution of Dysoxylum binectariferum in the north-eastern part of Bangladesh as predicted by the MaxEnt model applied to presence data (left panel). The geographic location of the area analyzed in this study (Moulvibazar and Habiganj districts) is shown in orange (right panel).
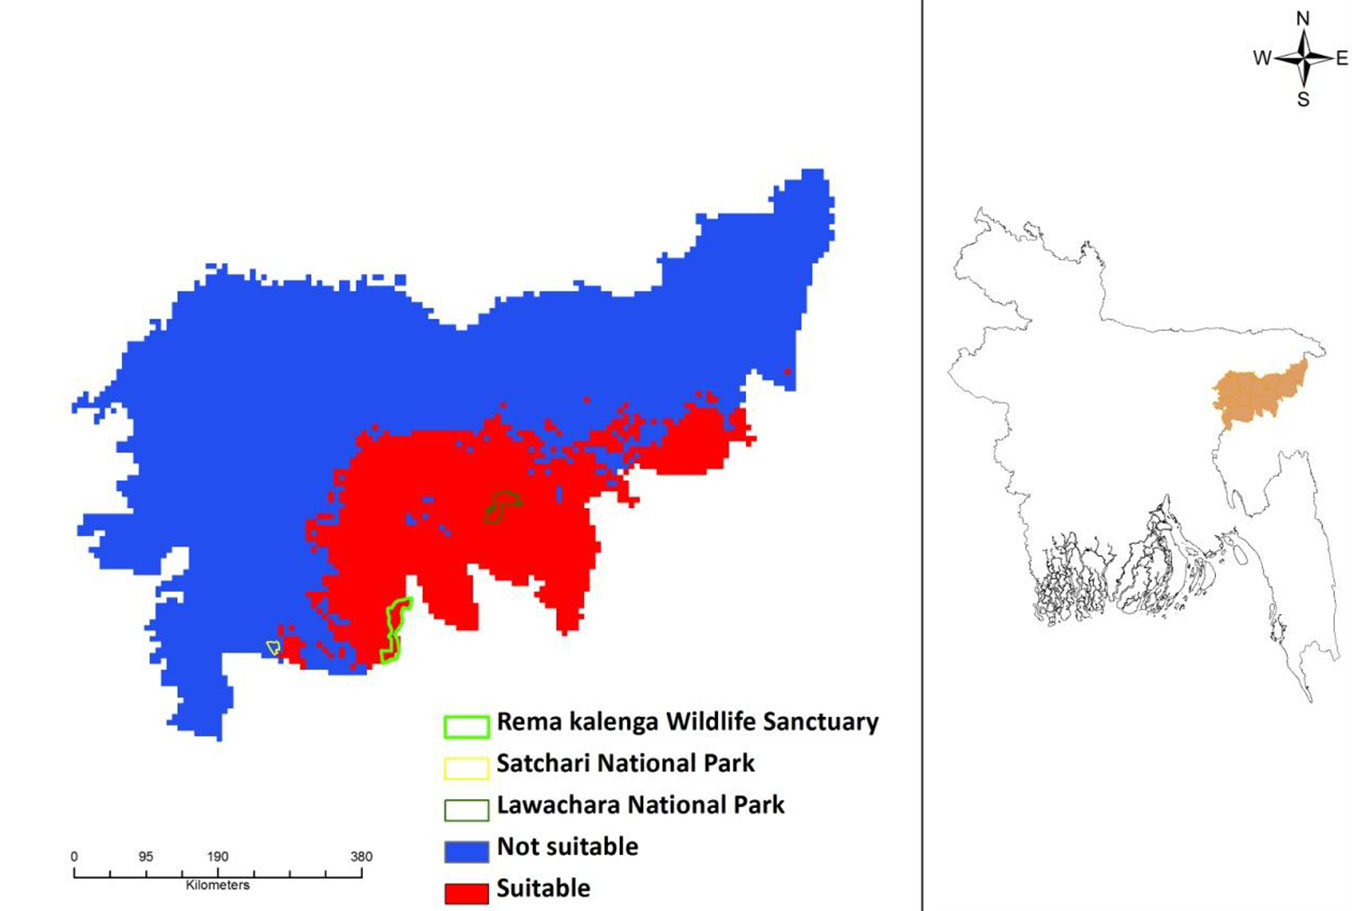
Fig. 5 - Complete loss of habitat in predicted future distribution of Dysoxylum binectariferum in northeastern Bangladesh under climate change scenarios RCP4.5 (2050), RCP4.5 (2070), RCP8.4 (2050), RCP8.4 (2070), as projected by the MaxEnt model applied to presence data (left panel). The geographic location of the area analyzed in this study (Moulvibazar and Habiganj districts) is shown in orange (right panel).
Discussion and conclusions
Conservation activities in most tropical regions have often failed owing to a lack of proper knowledge of the target species in terms of habitat suitability. The application of species distribution models (SDMs) to simple inventory data (such as the presence of a species) may provide policymakers and conservationists with predictions of future distribution of the target species at both local and regional scales. This will in turn lead to an improved understanding of the factors influencing species distribution in the light of climate change ([14]). In this study, we showed the effectiveness of such habitat suitability models for the conservation of poorly known species by providing important information about local distribution and habitat preference, subject to climate change. An intricate relationship between forests and climate change was observed at a global scale ([20]). SDMs have been proven to be important tools in assessing the distribution and potential relationship between species and bioclimatic variables ([40]). In the last decade, several studies have been conducted on the effects of climate change on forests and ecosystems ([40], [4]). These authors demonstrated that climate change affects forests species and hypothesized that the rate of future climate change may lead to a mass extinction of species, with a consequent forest habitat degradation or loss. The results of this study support the findings of previous studies mentioned above. Indeed, modeling results showed that the suitable habitats of D. binectariferum are likely to be reduced or loss under future climate change scenarios. On a regional scale, Bangladesh has already experienced substantial changes in its forest ecosystem and is highly susceptible to any future changes owing to its particular geo-climatic location. For example, Alamgir et al. ([2]) concluded that the habitat of Asian elephant is expected to remain constant (i.e., 38%) throughout 2050 and 2070, whilst the habitat of the Hoolock gibbon will be reduced between 82% and 100% under the IPCC climate change scenario. Furthermore, Trisurat et al. ([37]) found that approximately 31 tree species will lose their suitable habitat by 2100 in southeastern Asia. Bakkenes et al. ([3]) found that more than 16% of European land area is likely to face local species loss that may exceed 50% by 2050. Studies have shown that climate change may also directly or indirectly affect endangered or rare tree species in different ways, including decline in numbers, genetic loss, and even extinction ([7], [8]).
In this Anthropocene era, humans are intensely altering the environments of plants and wildlife. Forest loss and degradation will significantly affect plant habitats in terms of size and quality, and this trend is expected to persist in the future ([12]). Illegal logging, encroachment and forest clearance are predominantly responsible for habitat destruction in most tropical forest areas ([35]). Conservation of habitats is the most effective action of biodiversity conservation, thereby helping prevent extinction of species. Currently, forests are facing rapid reduction due to the increased rate of land-use change, mainly for agricultural purposes. Such changes are also taking place in the study area, threatening the existence of D. binectariferum. The livelihood of the people living near the forest at the study site is highly dependent on forest resources, e.g., via illegal logging ([1]). Indeed, D. binectariferum has high timber value which makes it an attractive source of income through illegal logging, directly resulting in its status of threatened species. Such increasing habitat degradation calls for new approaches aimed to gain an insight into species distribution. The combined effect of climate change and and habitat destruction could not be investigated in the present study owing to a lack of data.
The findings of this study can be considered as crucial information regarding climate change research on the forest species of Bangladesh. The approach used in this study can be applied to other tree species with high preservation concerns. The results may provide useful guidelines for government and non-government organisations who are responsible for the conservation and management of forest resources. Nevertheless, this study has some limitations. For instance, the choice of the SDM and emission scenarios can lead to overestimation or underestimation of the future distribution of the selected species. Therefore, we recommend the MaxEnt model used in this study to be used in conjunction with other SDMs and emissions scenarios. Nonetheless, we consider the results of this empirical study as an early warning of the effect of climate change on the future distribution of endangered species, which may help conservation managers in designing policies that may reduce the vulnerability of threatened or rare tree species.
Protection of threatened or rare species is unfeasible without the protection of their habitats. Protection of a forest habitat can be undertaken using different approaches. Apart from establishing protected or reserve areas, landscape connectivity between non-protected areas should also be taken into account. To this purpose, the addition of new areas seems to be an effective approach ([16]). Additionally, the active participation of the local, forest-dependent people is fundamental, especially in developing countries, as successful forest conservation is not possible without their active participation ([35]). To engage the local people in the decision-making process of conserving forests, a participatory approach or co-management system should be introduced. The Government of Bangladesh has prioritized the above-mentioned issues, so most of the protected areas of Bangladesh are now under a co-management system. Finally, an awareness programme should also be prioritized to address climate change issues and protect the valuable forest resources of Bangladesh for future generations.
Acknowledgements
We acknowledge the support from the Forest Department staff of the Sylhet Forest Division of Bangladesh during tree location searching. We are grateful to two anonymous reviewers for their useful comments and feedback that improved the quality of the paper. Special thanks to Nerys Lloyd Mullally, Bangor University, UK for editing the manuscript.
References
Gscholar
CrossRef | Gscholar
CrossRef | Gscholar
Gscholar
CrossRef | Gscholar
Gscholar
Gscholar
Gscholar
Gscholar
CrossRef | Gscholar
Authors’ Info
Authors’ Affiliation
School of Agriculture and Food Science, The University of Queensland (Australia)
School of Environment, Natural Resources and Geography, Bangor University (UK)
School of Earth and Environmental Sciences, University of Adelaide (Australia)
Department of Forestry and Environmental Science, Shahjalal University of Science and Technology (Bangladesh)
Corresponding author
Paper Info
Citation
Sohel SI, Akhter S, Ullah H, Haque E, Rana P (2016). Predicting impacts of climate change on forest tree species of Bangladesh: evidence from threatened Dysoxylum binectariferum (Roxb.) Hook.f. ex Bedd. (Meliaceae). iForest 10: 154-160. - doi: 10.3832/ifor1608-009
Academic Editor
Rupert Seidl
Paper history
Received: Feb 19, 2015
Accepted: Jan 20, 2016
First online: May 25, 2016
Publication Date: Feb 28, 2017
Publication Time: 4.20 months
Copyright Information
© SISEF - The Italian Society of Silviculture and Forest Ecology 2016
Open Access
This article is distributed under the terms of the Creative Commons Attribution-Non Commercial 4.0 International (https://creativecommons.org/licenses/by-nc/4.0/), which permits unrestricted use, distribution, and reproduction in any medium, provided you give appropriate credit to the original author(s) and the source, provide a link to the Creative Commons license, and indicate if changes were made.

Web Metrics
Breakdown by View Type
Article Usage
Total Article Views: 58148
(from publication date up to now)
Breakdown by View Type
HTML Page Views: 46908
Abstract Page Views: 5090
PDF Downloads: 4600
Citation/Reference Downloads: 43
XML Downloads: 1507
Web Metrics
Days since publication: 3709
Overall contacts: 58148
Avg. contacts per week: 109.74
Article Citations
Article citations are based on data periodically collected from the Clarivate Web of Science web site
(last update: Mar 2025)
Total number of cites (since 2017): 10
Average cites per year: 1.11
Publication Metrics
by Dimensions ©
Articles citing this article
List of the papers citing this article based on CrossRef Cited-by.
Related Contents
iForest Similar Articles
Research Articles
Potential natural vegetation pattern based on major tree distribution modeling in the western Rif of Morocco
vol. 17, pp. 405-416 (online: 22 December 2024)
Research Articles
Spatial modeling of the ecological niche of Pinus greggii Engelm. (Pinaceae): a species conservation proposal in Mexico under climatic change scenarios
vol. 13, pp. 426-434 (online: 16 September 2020)
Research Articles
Estimating the distribution characters of Larix kaempferi in response to climate change
vol. 13, pp. 499-506 (online: 01 November 2020)
Research Articles
Climate change may threaten the southernmost Pinus nigra subsp. salzmannii (Dunal) Franco populations: an ensemble niche-based approach
vol. 11, pp. 396-405 (online: 15 May 2018)
Research Articles
Predicting the effect of climate change on tree species abundance and distribution at a regional scale
vol. 1, pp. 132-139 (online: 27 August 2008)
Research Articles
Predicting the impacts of climate change on the distribution of Juniperus excelsa M. Bieb. in the central and eastern Alborz Mountains, Iran
vol. 11, pp. 643-650 (online: 04 October 2018)
Research Articles
Ensemble modeling of Pinus cembroides Zucc. distribution under future CMIP6 climate scenarios in northern Mexico
vol. 19, pp. 1-8 (online: 10 January 2026)
Research Articles
Distribution and habitat suitability of two rare saproxylic beetles in Croatia - a piece of puzzle missing for South-Eastern Europe
vol. 11, pp. 765-774 (online: 28 November 2018)
Research Articles
Hemlock woolly adelgid niche models from the invasive eastern North American range with projections to native ranges and future climates
vol. 12, pp. 149-159 (online: 04 March 2019)
Review Papers
Impacts of climate change on the establishment, distribution, growth and mortality of Swiss stone pine (Pinus cembra L.)
vol. 3, pp. 82-85 (online: 15 July 2010)
iForest Database Search
Search By Author
Search By Keyword
Google Scholar Search
Citing Articles
Search By Author
Search By Keywords
PubMed Search
Search By Author
Search By Keyword


