Effect of dust accumulation on Quercus cerris L. leaves in the Ezer forest, Lebanon
iForest - Biogeosciences and Forestry, Volume 15, Issue 4, Pages 322-330 (2022)
doi: https://doi.org/10.3832/ifor3959-015
Published: Aug 23, 2022 - Copyright © 2022 SISEF
Research Articles
Abstract
Air pollution arising from different sources represents a serious environmental threat to all living organisms, including vegetation. Monitoring air contamination levels is necessary to detect pollution levels, regulate atmospheric pollution, and ultimately improve ambient air quality. The current study evaluated the effects of air pollutants with a focus on dust and some biochemical and physiological properties of Quercus cerris L., which is growing in Lebanon’s Ezer forest, threatened by the presence of a public road on its northern side. The studied parameters include leaf extract pH, stomatal conductance, relative water content, hydrogen peroxide, proline, carotenoids, and air pollution tolerance index. These parameters can provide reliable information about the tolerance status of plants towards pollutants. Three sites with different exposure to vehicular activities were used to conduct this study, including a control site (unpolluted) and two polluted sites (S1 and S2). The results showed a significant reduction in stomatal conductance and relative water content at polluted sites compared with the control site. Hydrogen peroxide, proline, and carotenoids showed the highest levels at the S2 site, which is indicative of the fact that Quercus cerris undergoes established physiological and biochemical changes in response to environmental stress. Based on the air pollution tolerance index (4.97-9.85) Quercus cerris is categorized as a sensitive species that can be used as a biological monitor of environmental pollution. Thus, the development and implementation of efficient environmental action plans based on biomonitoring should be considered for protecting the forests.
Keywords
Ezer Forest, Quercus cerris L., Dust, Physiological Parameters, Biochemical Parameters, Bioindicator
Introduction
Air pollution represents one of the gravest environmental concerns that the globe is facing nowadays. It takes place when fumes, gases, and particulate matter are introduced into the atmosphere in a way that makes them noxious to human health and ecosystems.
Pollutants present in the atmosphere may originate from natural sources, like forest fires, or anthropogenic sources like chemical industries, fossil fuel burning, and vehicular activities ([38], [20]). Carbon monoxide (CO) is an odorless and colorless gas that is mainly released in the ambient air from vehicles and other machinery that burn fossil fuels ([46]). Sulfur dioxide (SO2) is a colorless gas and reactive air pollutant with a strong odor that primarily gets into the atmosphere from the burning of fossil fuels by power plants and vehicle engines. Smaller contributors to SO2 emissions include volcanoes, locomotives, and industrial processes such as mining ([48]). Nitrogen dioxide (NO2) is a nasty-smelling gas that is considered a significant air pollutant because it contributes to the formation of photochemical smog. Main sources of nitrogen dioxide emissions include power plants and automobile exhaust ([47]). NO2 and SO2 can react with water present in the atmosphere to form acid rain that harms waterways and forests. In addition to these common gaseous pollutants, dust contamination represents another significant environmental problem ([28]). The origin of dust pollution can be natural, like forest fires, volcanoes, soil particles resuspension, or anthropogenic, like mining activities, construction sites, agricultural practices, campfires, and vehicular activities ([16]). Vehicle-related dust particles are released into the atmosphere from vehicle exhaust systems, and as a consequence of brake wear, tire wear, and road dust resuspension due to the passing vehicles ([28]).
A review of the literature reveals that air pollutants adversely affect the physiological and biochemical processes in plants, causing leaf injuries, stomatal closure, and premature leaf senescence. Air pollutants can also hamper the photosynthetic activities by reducing the total chlorophyll contents, which will lead to a decline in carbohydrates production. Furthermore, the generation of reactive oxygen species (ROS) will cause various effects on plants, from the oxidative damage of macromolecules to the variation of antioxidant synthesis rates ([29], [31], [20]). Many studies indicated the effects of pollutants on many plant properties, including the leaf extract pH, relative water content (RWC), stomatal conductance (gs), air pollution tolerance index (APTI), hydrogen peroxide (H2O2), proline content, and carotenoid content ([19], [2], [31], [3]). The change of the leaf pH under polluted conditions was related to the type of pollutant. Acidic pollutants can cause an acidic pH change in the leaf. This pH decline is greater in more sensitive plants. Additionally, dust dissolution in the cell sap was found to increase the pH of the leaf extract ([26], [31]). Leaf stomata are small pores that open and close to allow for gas and water exchange between the leaf and its environment. The degree of opening of stomata was found to change in response to diverse environmental stresses such as pollution. However, the phenomenon is complicated because the same contaminant can cause stomata to close or to open under different situations. Robinson et al. ([33]) indicated that exposure to low levels of gaseous pollutants such as SO2 may cause stomatal opening. These same contaminants can also induce stomatal closure, but usually at greater exposure levels. On the other hand, the accumulation of dust on leaf surfaces can cause stomata clogging and decrease stomatal conductance ([16]). Calculation of the APTI provides information on the sensitivity of the studied species to air pollution. APTI values are obtained from a formula based on four physiological and biochemical parameters, including leaf pH, RWC, ascorbic acid content, and total chlorophyll content of plant leaves. The study of each parameter separately does not present an accurate picture of the resistivity status of plants, but the APTI value deduced from their combination will be more reliable. Plants having low APTI values are considered sensitive to environmental pollution and may serve as bioindicators of air contamination. Plant species with high APTI values are considered resistant to pollution, which are recommended for plantation near pollution-causing sources and along roads to reduce pollution levels and potentially minimize human exposure to noxious contaminants ([21]). RWC is an essential physiological factor that indicates the health of a plant and improves its tolerance under oxidative conditions. Under air pollution conditions, RWC was found to vary depending on the plant species. Agbaire & Akporhonor ([2]) reported that tolerant plant species have the capacity to maintain high RWC under pollution stress, while less resistant species showed a decrease in their RWC. Hydrogen peroxide (H2O2) is a reactive oxygen species that is produced in plant cells under normal conditions, but increased levels indicate oxidative stress ([18]). Proline and carotenoids are stress-associated molecules that scavenge harmful ROS and protect plants from oxidative damage ([18]). Some researchers observed a decrease in the oxidative stress scavenger levels in species from a contaminated environment, while others reported an increase ([6], [2], [42]). Thus, a combination of the measured parameters can be used as useful indicators of ambient air pollution stress. On the other hand, trees improve air quality by removing a considerable amount of contaminants from the atmosphere. They have relatively large leaf areas, onto which particles are intercepted and retained (deposited) and gaseous air pollutants are absorbed ([6], [31]). Trees have a vital role in diminishing the atmospheric concentration of carbon dioxide (CO2), which is a greenhouse gas. Indeed, trees open their stomatal pores and absorb CO2 from the atmosphere to perform the photosynthesis process and ultimately assist in decreasing atmospheric greenhouse effects. Trees can also absorb water-soluble gases like SO2 and convert them into innoxious metabolites ([39]). Muthu et al. ([28]) also noted that large dust particles can be readily captured and filtered by tree leaves. Therefore, the exploitation of trees for monitoring and reducing environmental pollution has attracted considerable interest.
Lebanon is facing drastic environmental deterioration due to weak environmental legislation, uncontrolled industrial and vehicular activities, use of low-quality fuels, and lack of road maintenance. The Ezer forest, also known as Iron oak forest or Turkey oak forest, is located in the north of Lebanon. It is well distinguished by the remarkable abundance of over 4500 Quercus cerris trees and its faunal wildlife. Turkey oak (Quercus cerris L., Fagaceae) is the most abundant native species in Lebanon. Its Arabic name, Al-Ezer, reportedly derived from Aramaic, means pillar in reference to the trunk of the tree. In addition to its use for temporary construction and charcoal production, the tree has also been employed in traditional medicine to treat various infectious diseases ([44]).
However, the natural processes of the forest are disturbed by the presence of an unpaved public road recently constructed on its northern side. Smithers et al. ([41]) noticed that vegetation could be impacted by vehicle pollution, even at distances up to 200 m from roads. In addition, the authors warned that the detrimental effects of roadside pollution may increase wildlife mortality and have cumulative results like heavy metals accumulation and early senescence of sensitive species. It has also been reported that falling dust can occur up to one kilometer away from unpaved roads ([16]). Furthermore, the middle of the forest is considered a campsite where all kinds of vehicles enter and threaten the wildlife of the forest.
To evaluate the condition of the forest, this research study was performed at three distinct sites located at different distances from the unpaved road. Amounts of dust on Quercus cerris leaves were estimated to determine if they originate from the nearby road and if their levels decrease farther from the road. In addition, the levels of three major gaseous pollutants (CO, SO2, and NO2) were determined at experimental sites and compared with those of the control site. The effects of vehicular movement on the unpaved road and impacts of camping activities on the pH, gs, RWC, H2O2, proline, and carotenoids in Quercus cerris leaves were also assessed. The APTI value of Quercus cerris was also calculated to evaluate its tolerance level and consider its use as a bioindicator of atmospheric pollution.
Material and methods
Area of study
The study was conducted in the Ezer forest (34° 28′ 15″ N, 36° 12′ 25″ E), located in the Akkar district at 1300-1500 m above sea level. The climate is classified as Mediterranean and has four distinct seasons. The annual average rainfall is about 852.3 mm, while the annual ambient temperature generally ranges from 18 °C to 32 °C in summer and from 2 °C to 10 °C in winter. The forest, extending over an area of one square kilometer, is mainly dominated by Quercus cerris L. that are 150-200 years old. The oak trees of interest grow in sandy clay loam soil where they are up to 30 m tall with a trunk up to 2 m in diameter.
Sampling sites
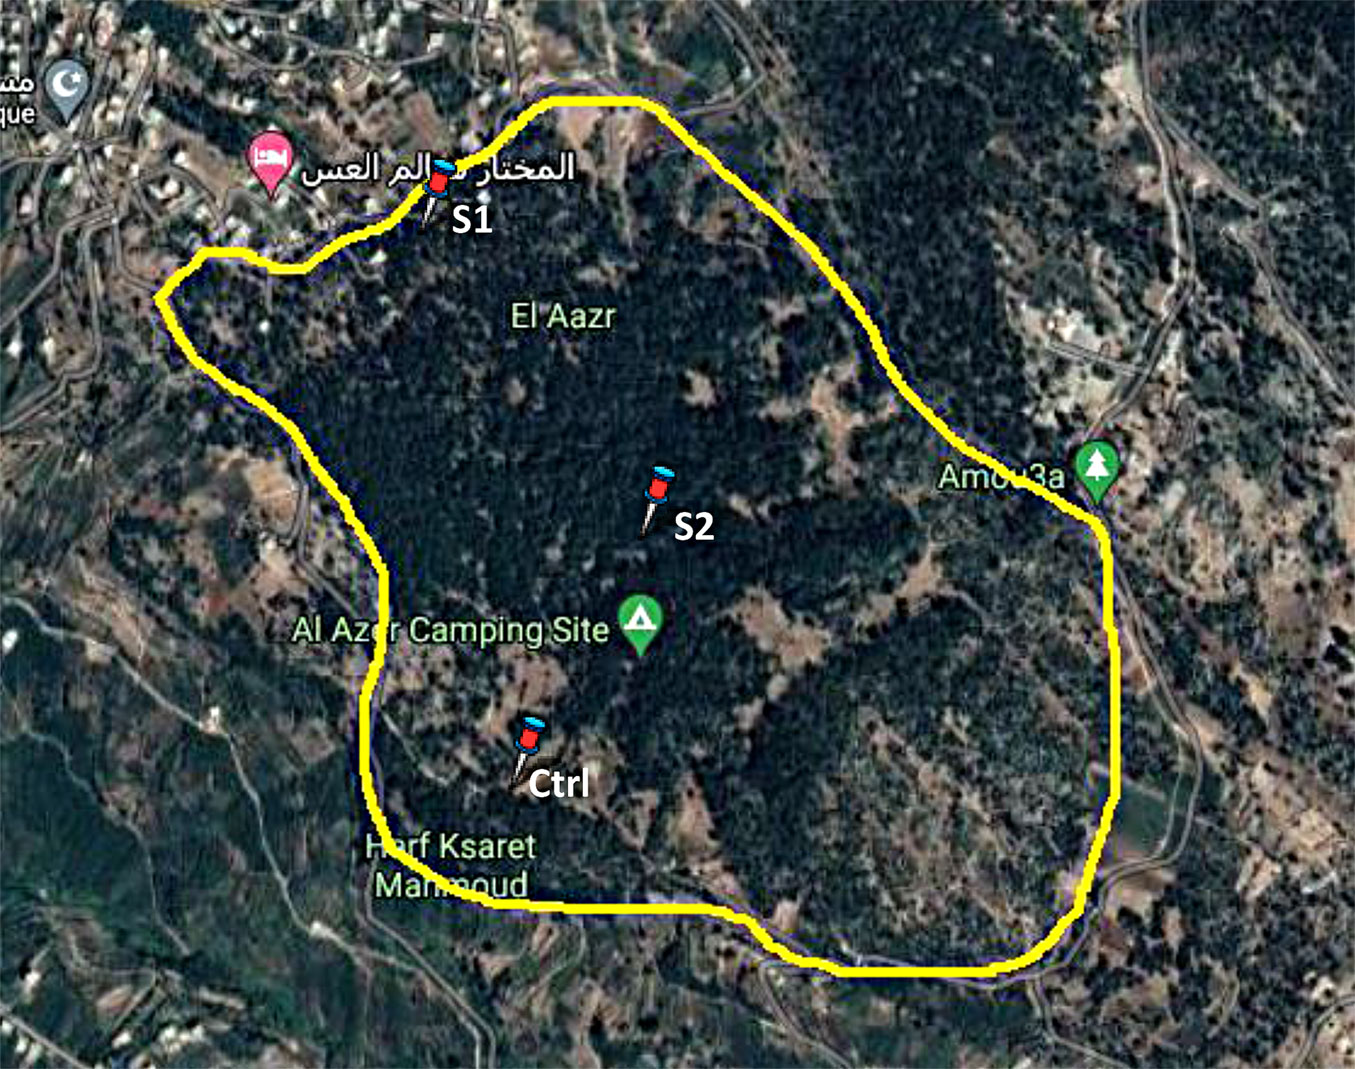
Three sampling sites were chosen. The northern side of the forest, which is the closest area to the unpaved public road and contains very dense trees, was selected as a severely polluted area (Site 1, S1). The middle of the forest, situated at a distance of 350 m from the public road, which is used for camping, was selected as a moderately polluted area (Site 2, S2). The western part of the forest, with similar ecological status but relatively far from the two experimental sites, at a distance of 530 m from the public road, was designated as a control area (Ctrl site - Fig. 1). This study was carried out from June to October 2020.
Fig. 1 - Locations of sampling points in the Ezer forest. (S1): Site 1, severely polluted area; (S2): Site 2, moderately polluted area; (Ctrl): Control site ([10]).
The fresh leaves were collected randomly from experimental and control sites, such that 12 Quercus cerris trees were selected from each site and around 20 leaves exposed to full sun were collected from each tree ([15]). The leaves were kept in polyethylene bags in an icebox and taken immediately to the laboratory of the Lebanese Agricultural Research Institute for analysis. Leaves were preserved in a freezer in the laboratory until they were analyzed, within 24 hours of their sampling.
Samples labeled “S1” were collected from the public roadside trees, samples with “S2” were collected from the middle of the forest and finally samples with the mark “Ctrl” were the control samples.
Air pollutants determination
The amounts of dust deposited on tree leaves were determined by weighing the collected leaves with dust and then weighing them after washing with distilled water ([19]).
The levels of CO, NO2, and SO2 in the ambient air of the studied area were determined using a precision pump (GV-100S® Gas Sampling Pump Kit, Gastec Corp., Kanagawa, Japan) equipped with detector tube packages.
Stomatal conductance
Stomatal conductance was measured using a leaf porometer. Stomatal conductance was measured from water vapor and measurements were carried out each month at 11:00 am, close to the solar noon. The sensor head was placed on the top of the leaf, making sure to not have a desiccant chamber facing upward. Recordings were shown on the screen of the leaf porometer.
Leaf extract pH
The pH of the leaf extract was determined by homogenizing 5 g of dried leaves in 40 mL of distilled water. This was then filtered, and the pH was determined by a digital pH meter ([2]).
Relative water content determination
The RWC was determined by the methodology of Agbaire & Akporhonor ([2]) and calculated using the following formula (eqn. 1):
where FW is the fresh weight of leaves (g), DW is the dry weight (g) and TW is the turgid weight (g).
Air pollution tolerance index determination
To estimate the resistance power of Quercus cerris L. against atmospheric pollution, the APTI was determined ([31]). APTI is calculated by analyzing four parameters using the following formula (eqn. 2):
where A is the ascorbic acid content (mg g-1), T is the total chlorophyll (mg g-1), P is the pH of leaf extract, and R is the relative water content (%).
Hydrogen peroxide content
The H2O2 content was determined as described by Karatas et al. ([17]). Briefly, fresh leaves were homogenized with 0.1% trichloroacetic acid in an ice bath followed by centrifugation for 15 minutes at 3000×g. The supernatant was then collected and mixed with 10mM potassium phosphate buffer (pH 7.0) and 1M potassium iodide. The absorbance was read at 390 nm by using a UV spectrophotometer.
Proline content
Available proline was estimated following the method used by Agbaire ([3]). The powdered leaves were heated in pure ethanol for 20 minutes. The ethanolic extract was then mixed in screw cap tubes with ninhydrin reaction mix. The tubes were then heated at 95 °C in a block heater for 20 minutes and afterward centrifuged for 1 minute at 3000×g. Finally, the absorbance was measured at 520 nm. The concentration of proline was then determined using a calibration curve ([3]).
Carotenoid content
To determine carotenoid content, fresh leaves were immersed in methanol and conserved in the dark until total discoloration. The absorbance was then measured at 470 nm ([14]).
Statistical data analysis
Experiments were performed in three replicates and data were presented as mean ± standard deviation (SD). The data were analyzed statistically using the Student t-test to determine the significant differences between experimental and control sites, which were believed to be significant when p < 0.05. Repeated measures one-way ANOVA was also used to validate the monthly variation of the studied parameters.
Results and discussion
Air quality monitoring data indicated that CO, SO2, and NO2 amounts were below detection levels in the three selected sites throughout the study. The uppermost dust deposition levels recorded throughout the study were observed at the S1 site, followed by S2 site, and then at the Ctrl site (Fig. 2, Fig. 3). The higher deposition of dust at experimental sites may be due to the resuspension of road dust particles and through wind-driven processes, where winds blow across the surface of the ground, then uplift dust particles and carry them to places adjacent to the source of emission. Apart from the natural wind-driven process, vehicular movement on the unpaved road may play an important part in the dust pollution. Dust particles could be generated from auto exhausts and non-exhaust emissions, which reside mainly in the movement of vehicles along an unpaved road and pulverization of dust by the force of wheels ([28]). It has been reported that a vehicle traveling once a day for a year on an unpaved road generates one ton of dust into the air for every one mile of driving. This dust can move 500 feet (152.4 m) away from the dusty road ([7]). Kameswaran et al. ([16]) indicated that unpaved dusty roads with vehicular traffic generate greater amounts of dust than paved roadways. Non-exhaust vehicle emissions also compromise the tire-brake-road eroded particles resulting from the interaction of tires with the surface of the road and wearing down the brakes ([1]). Moreover, vehicles entering, parking lots near the recreation site (S2), suspension of soil particles by the vehicle tires through aerodynamic forces, and campfires could be other possible reasons for high dust levels at the S2 site. Furthermore, the levels of deposited dust vary with the distance of the trees from the unpaved road, such that trees growing along the unpaved road (S1 site) experienced the highest dust levels, followed by S2, and then the Ctrl site. The effects of dust on plants, starting at the physiological and biochemical levels and progressing up to the morphological level, which is manifested by the appearance of visible damage on leaves, have been recorded by several authors ([6], [23]). Dust particles have many adverse effects on plants. Some of these effects include noticeable marks of damage, regarding leaf colors, shapes, width, and length. Dust particles can induce necrotic lesions, yellowing, black patches on leaves, and in extreme cases, premature leaf senescence ([31]). Many studies noted that the deposition of alkaline dust with pH values higher than 9 can induce direct leaf injuries. Moreover, dust bearing high levels of magnesium oxide can elevate the erosion rate of epicuticular wax, resulting in its degradation ([29], [31]). Dust can also cause biochemical and physiological changes that are invisible, like stomatal closure and inhibition of photosynthetic machinery, which negatively affect plant growth. Seyyednejad et al. ([36]) and Leghari & Zaidi ([22]) reported significant reduction in leaf numbers, area, length, breadth, and length of petiole under polluted conditions. Dust pollution can also alter the biochemical processes resulting in a significant modification of the synthesis rate and accumulation of oxidative stress markers and scavengers ([11], [35]). The results of our study concur with the findings of other researchers ([30]). They reported higher dust deposition on the leaves of all the studied plant species growing on the edge of heavy-traffic roads when compared with those from control sites. Lewis et al. ([23]) also observed in their study that the levels of dust deposition decreased as the distance from the unpaved road increased.
Fig. 2 - Variation of dust deposition in the three selected sites along the studied months. Each value is a mean of three samples ± standard deviation. (*): p < 0.05; (**): p < 0.01; (***): p< 0.001.
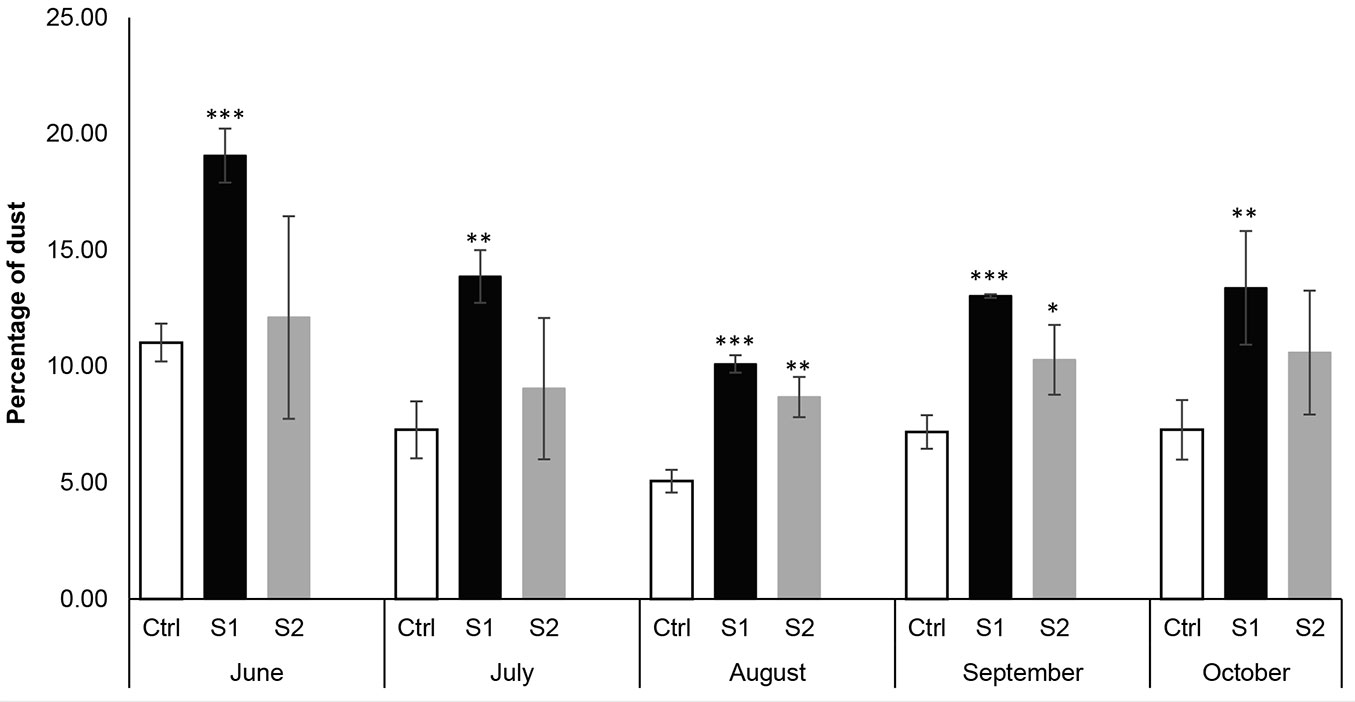
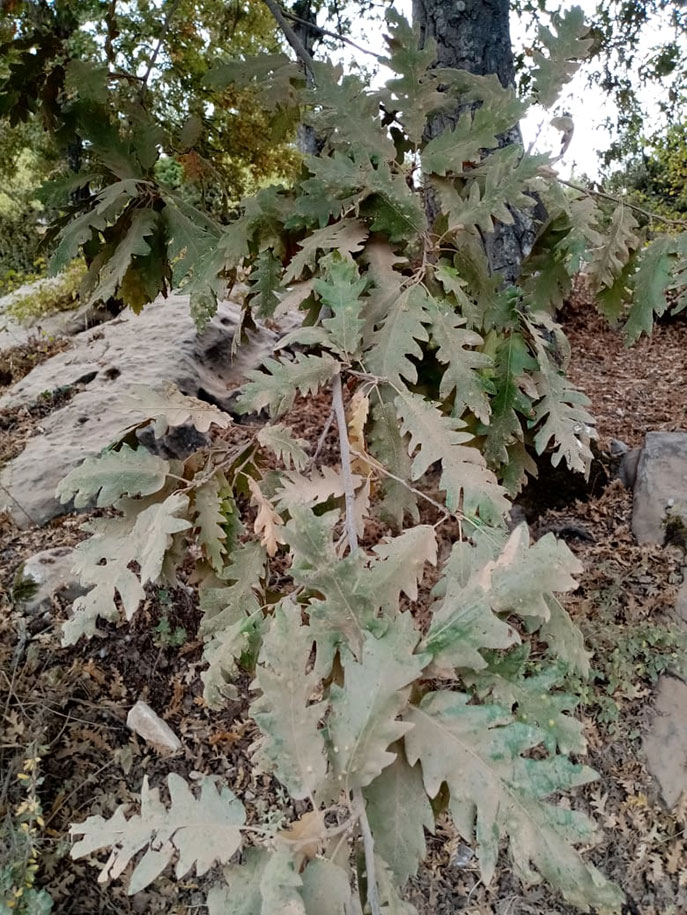
Fig. 3 - Quercus cerris leaves growing near the unpaved public road at the S1 site are covered with dust particles.
Variations in some physiological characteristics of Quercus cerris leaves sampled from the contaminated sites and Ctrl site are shown in Fig. 4. Stomatal conductance is the measure of the rate of carbon dioxide (CO2) assimilation into the leaf and water vapor exiting through the stomata of a leaf. Stomatal apertures alter in response to a variety of internal and environmental agents to achieve successful regulation of gas exchange in leaves. In the present study, we observed that there was a considerable reduction in stomatal conductance of Quercus cerris growing at the polluted sites, S1 and S2 (Fig. 4a). The highest decrease was recorded in the severely polluted site, S1. This may be due to the deposition of dust on the leaves. In fact, the deposition of dust on leaf surfaces can cause stomata clogging, thus reducing CO2 uptake by leaves and ultimately resulting in a significant decrease in the photosynthesis process ([16]). Apart from adversely affecting gaseous exchange, dust deposited on leaves can decrease sunlight penetration and consequently influence the photosynthesis rate ([29], [16]). On the other hand, dust particles of a size range lower than the diameter of stomata (8-12 μm) can enter through stomatal pores, interact with spongy mesophyll cells, disrupt the photosynthetic reaction center, and impede the overall plant growth ([35]). The results of the present study are consistent with the findings of Lewis et al. ([23]). They reported a decrease in stomatal conductance of Hesperidanthus suffrutescens leaves growing near an unpaved road and bearing high amounts of dust as compared with those growing at a certain distance from the road with lighter dust contamination.
Fig. 4 - Variation of (a) stomatal conductance, (b) relative water content and (c) pH of Quercus cerris leaves collected from polluted and control sites. Each value is a mean of three samples ± standard deviation. (*): p < 0.05; (**): p < 0.01; (***): p< 0.001.
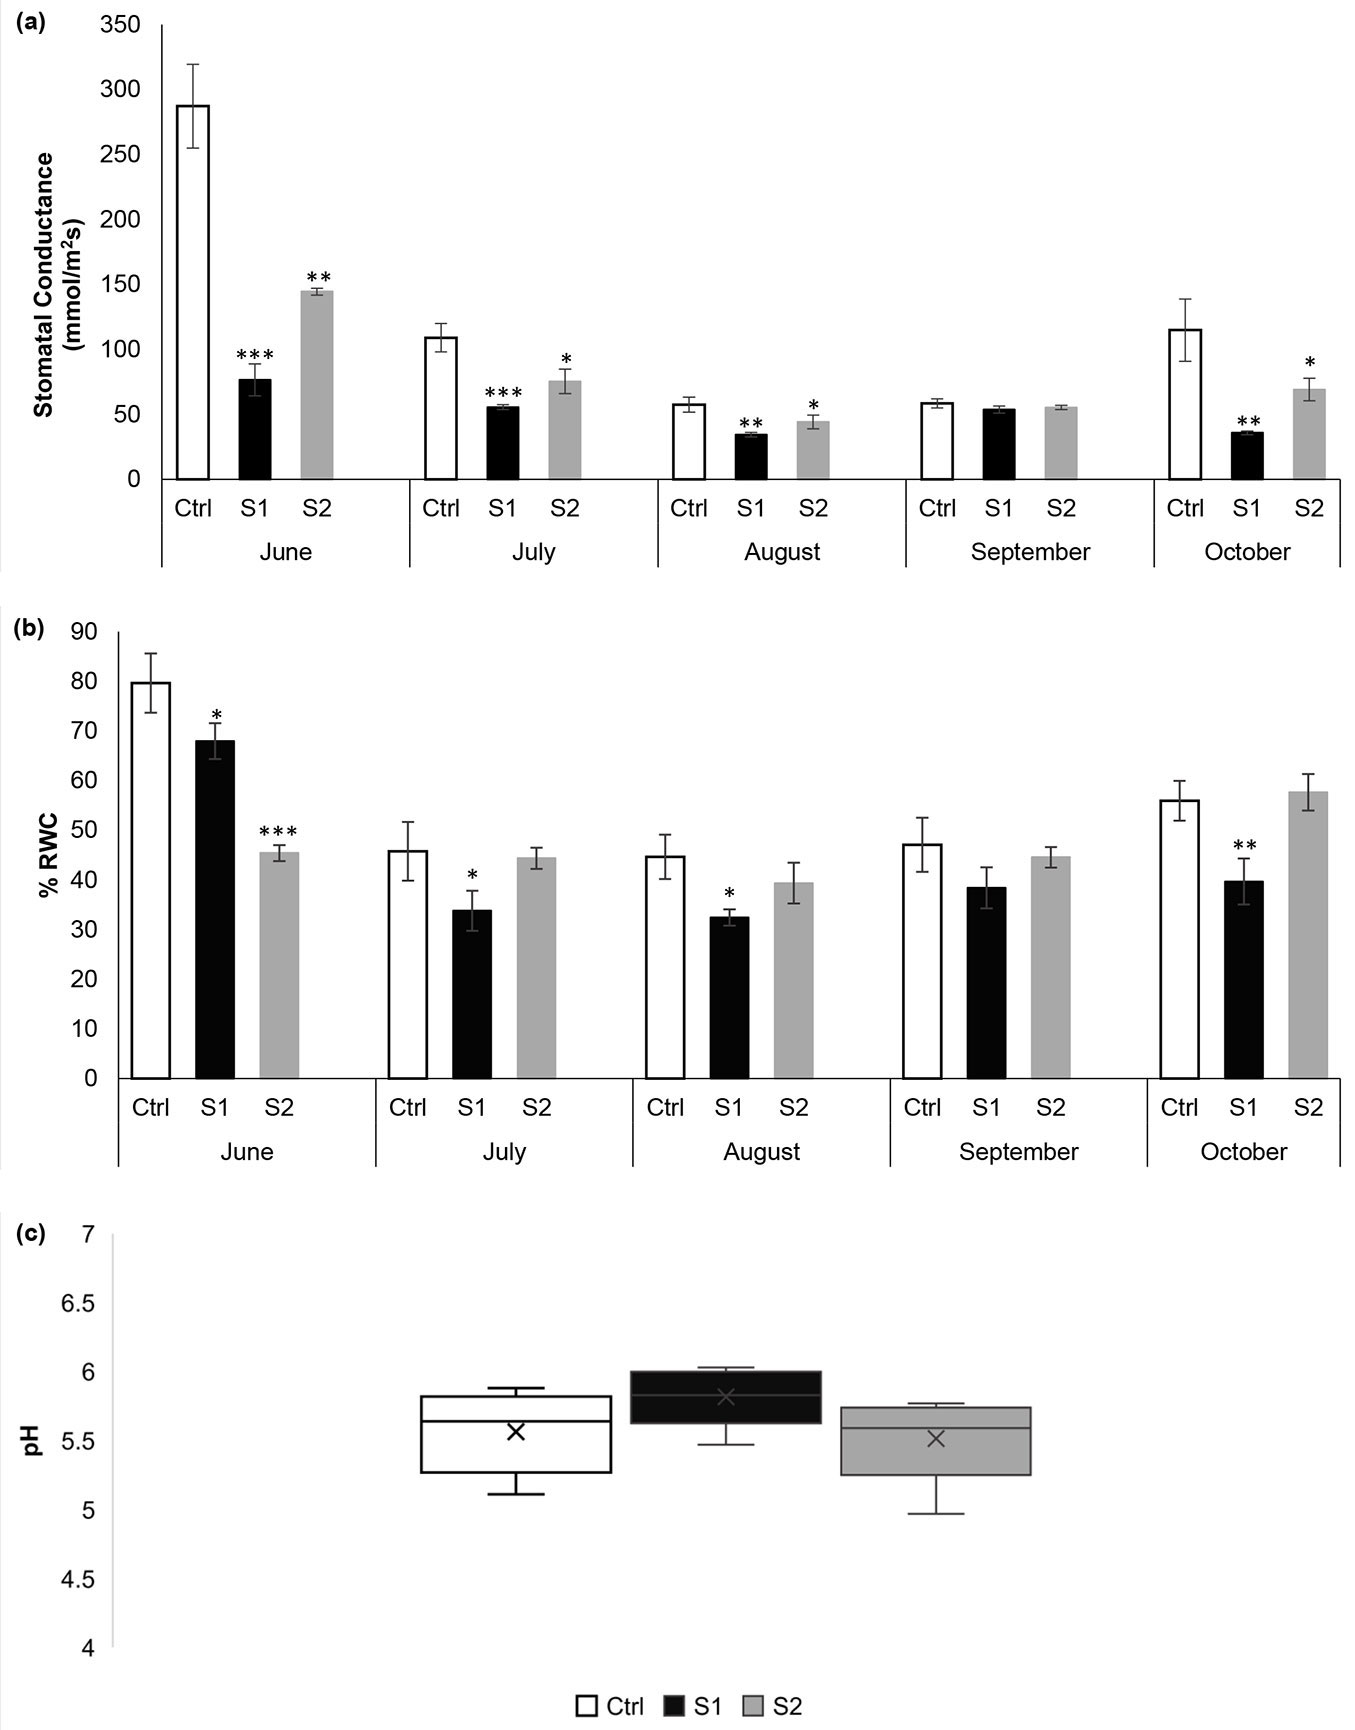
The RWC of a leaf expresses the water present relative to its full turgidity ([39]). It is a useful indicator for protoplasmic permeability in cells. When plants are exposed to air pollutants, the cell permeability increases leading to a reduction in internal moisture content ([19]). Plants maintaining high RWC in polluted environments are considered to be tolerant to air contaminants ([2]). However, the results of our study revealed a considerable reduction in the RWC of leaves collected from S1 during June, July, August, and October and a high significant decrease in the leaves sampled from S2 in June as compared with the Ctrl site (Fig. 4b). Thus, based on RWC, Quercus cerris may be regarded as a stress-sensitive species.
On the other hand, the studies of the leaf extract pH showed an acidic nature, within the range of 4.97 to 6.03 (Fig. 4c). The highest pH value (6.03) was noticed at the S1 site, which is the nearest site to the road. This increase in pH may be attributed to the dissolution of dust particles in the cell sap ([26]).
Fig. 5 represents the average values for some biochemical parameters in Quercus cerris leaves sampled from the three chosen sites. Hydrogen peroxide, a member of the family of ROS, is generated as a normal product by plant cellular activities such as redox reactions in chloroplasts or mitochondria, fatty acid oxidation, and photorespiration. However, their levels increase when plants are subjected to environmental stresses ([12]). At low non-toxic levels, H2O2 acts as a central player for initiating cell signaling, but its progressive production and accumulation under stressful conditions can cause oxidative damage to important cellular metabolites. The results of our study showed that in June, there was no considerable difference between the concentration of H2O2 in the contaminated and control areas (Fig. 5a). However, in July, August, and October there was a significant increase in H2O2 concentrations at the S1 and S2 experimental sites. Notably, H2O2 was observed at its highest peak in August at S1, where it surpassed the Ctrl site by 98%. These results indicate that oxidative stress mainly occurred in the contaminated sites. The findings of this study were consistent with those of Khairallah et al. ([18]). They reported a remarkable increase of H2O2 levels in roadside Urginea maritima leaves when compared with those growing at the control site. They indicated that the highest H2O2 levels were recorded at the closest spot to the road, followed by the moderately polluted site, and then the control site located at 800 m from the road.
Fig. 5 - Variation of (a) hydrogen peroxide, (b) proline and (c) carotenoid concentrations in the three selected sites throughout the study period. Each value is a mean of three samples ± standard deviation. (*): p < 0.05; (**): p < 0.01; (***): p< 0.001.
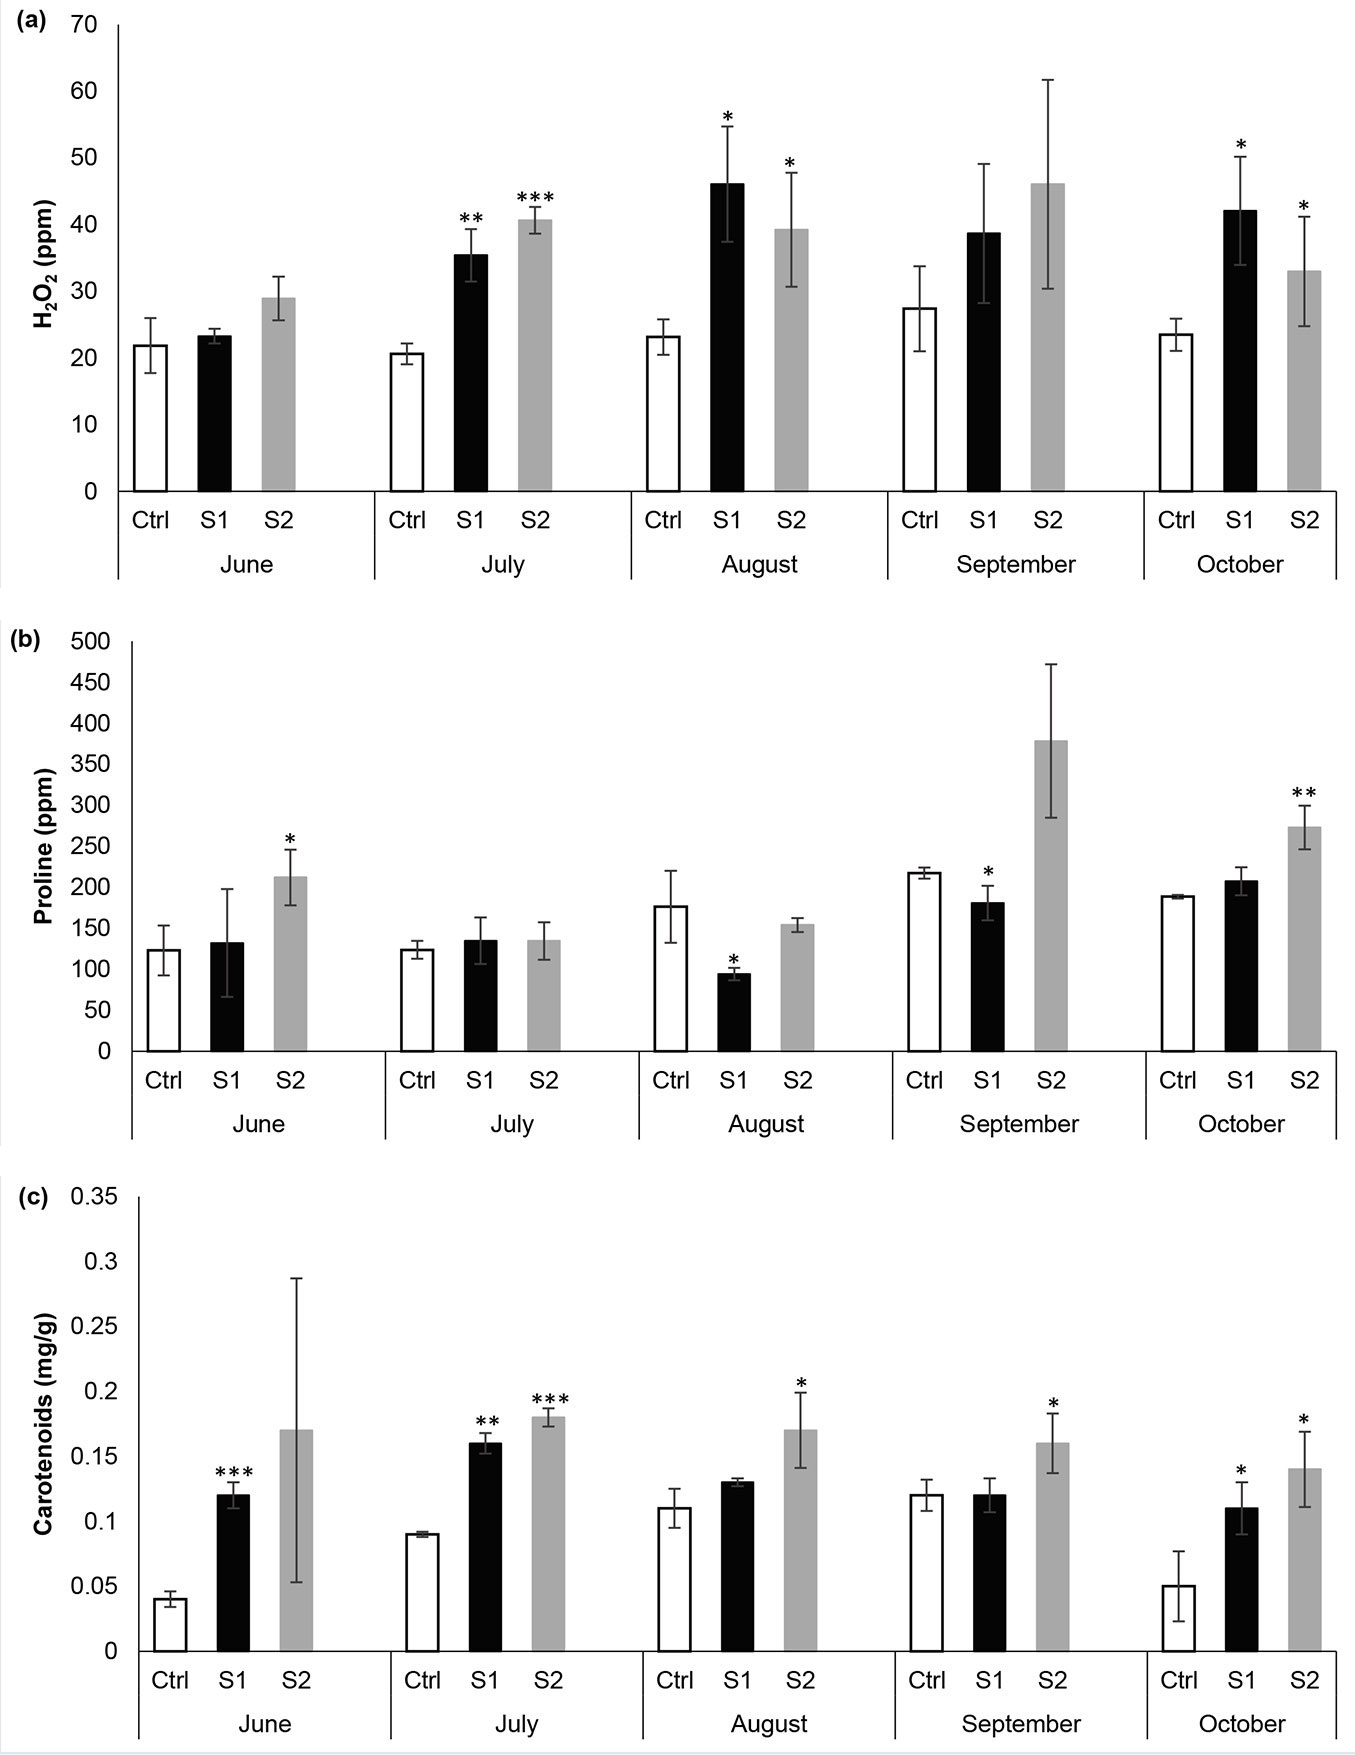
Proline is a proteinogenic heterocyclic amino acid with an exceptional structure that makes it unique among the 20 amino acids. The alkyl group wraps around and forms a second covalent bond with the nitrogen atom of the backbone, thereby forming a unique rigid cyclic structure. It is well known that under adverse conditions, proline accumulates in large quantities and imparts stress resistance to plants by maintaining osmotic balance, protecting membrane integrity, stabilizing proteins, scavenging ROS, and alleviating oxidative damage ([5]). Higher accumulated levels of proline have been recorded in plants experiencing various environmental stresses like drought, cold, ultraviolet radiation, high salinity, and pollution exposure. These common environmental stresses provoke the overproduction of ROS in plants, particularly singlet oxygen (1O2) and free radicals that are responsible for protein function alteration, breaking the DNA double-strand, and lipid peroxidation ([27], [16]). Proline functions as a potent antioxidant defense molecule, scavenging various ROS. Due to its low ionization potential, proline efficiently quenches singlet oxygen via a charge transfer reaction in which 1O2 turns into triplet oxygen ([24]). Proline also has the capability to scavenge superoxide and hydroxyl radicals (OH). It reacts with OH to form hydroxyproline derivatives under hydrogen abstraction. Due to its ability to directly scavenge singlet oxygen and hydroxyl radicals, proline contributes to the stabilization of macromolecules and maintains membrane integrity ([27]). A strong correlation has been found between lipid peroxidation and increased proline levels in plants exposed to different sorts of stress like heavy metals, high salinity, and SO2 fumigation ([16]). Additionally, proline has been found to perform as a molecular chaperone, protecting proteins by preventing their aggregation ([24]). Proline is also well distinguished by its property as a compatible osmolyte, reducing stress and mitigating turgor pressure under stressful situations ([27]). As for its property as a metal chelator, proline can chelate with metals like cadmium, copper, zinc, and iron, thereby mitigating their toxicity by preventing their metals-induced inhibition ([24]). Besides acting as a defense molecule under stress, proline acts as a signaling molecule involved in multiple biological processes like gene expression, apoptosis, and mitochondrial functions ([43]). On the other hand, several studies reported an elevation in the proline content of plants exposed to pollution stress. Gupta et al. ([11]) reported a significant increase in proline concentrations of Morus alba and Terminalia arjuna plants exposed 2.5 times more to dust fluxes than those from residential sites. Agbaire ([3]) revealed that proline content increased up to 24.90% in Citrus sinesis and up to 57.22% in Carica papaya leaves sampled from contaminated environments when compared with the same species from non-contaminated sites. Our findings were consistent with these reports since proline reached its highest levels in S2 and S1, respectively, during the study, except for August and September, where the Ctrl site overtook the S1 site, which suggests the presence of another kind of stress in the Ctrl site that could have biotic origin (Fig. 5b).
As for carotenoids, they are a class of natural-fat soluble pigments that take part in the photosynthetic machinery by harvesting sunlight, mainly in wavelengths that chlorophyll pigments do not capture substantially. Besides their function in the photosynthetic process, carotenoids have antioxidant and photoprotective roles in leaves. They also protect chlorophyll from photooxidative destruction by scavenging ROS ([19]). In this study, carotenoid pigments showed higher levels in S2 and S1, respectively, during the studied months with the exception of August and September, when there was no significant difference between S1 and the Ctrl site (Fig. 5c). The results of this study are in line with the findings of Seyyednejad et al. ([36]) and Sokolova et al. ([42]), who reported considerable rises in carotenoid levels across all the studied plant species exposed to air pollution stress. However, they do not agree with other researchers ([6], [19]), who reported a decline in carotenoid content of the leaves of various plants in polluted environments. The observed increase in the concentration of carotenoid pigments in Quercus cerris leaves may be an adaptation to tolerate air pollution stress ([45]). Hubai et al. ([13]) noted that the resistance and adaptation of plants to ambient air pollution can be observed by changes in the content of photosynthetic pigments. Shen et al. ([40]), in their study on wheat leaves exposed to polycyclic aromatic hydrocarbons pollution, stated that the accumulation of carotenoid pigments outside of the chloroplast thylakoids exhibits an important role in the protection of cells.
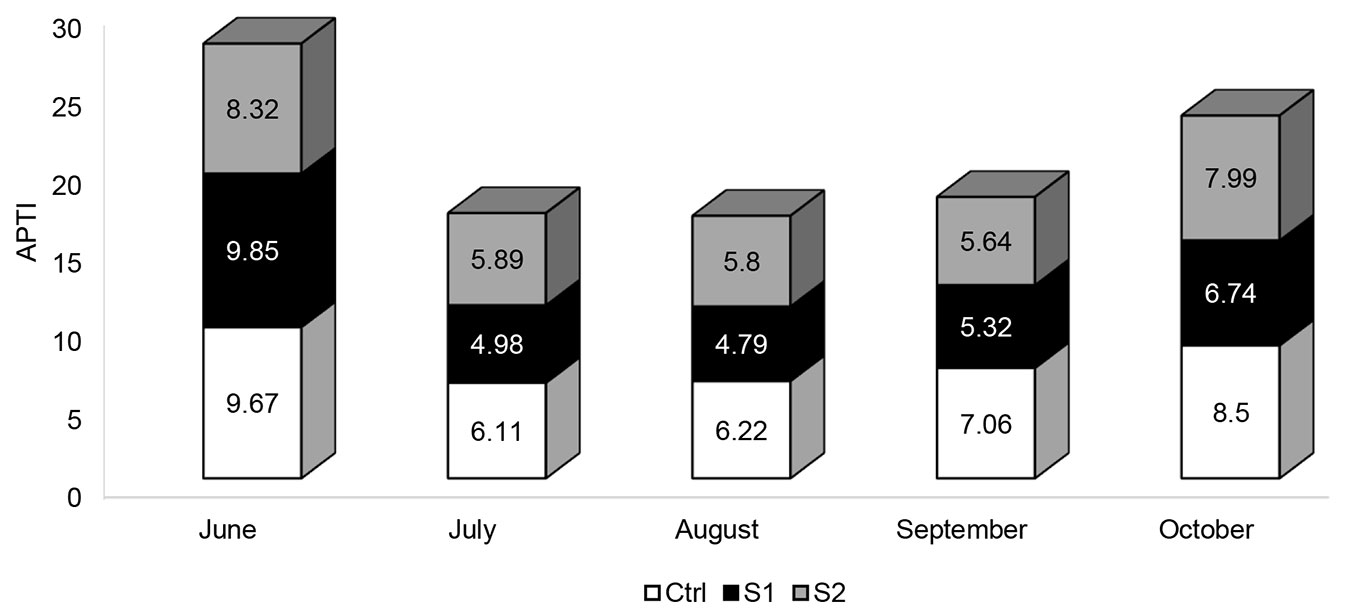
To assess the sensitivity level of Quercus cerris L. to air contamination, the air pollution tolerance index was calculated (Fig. 6). APTI was suggested by Singh and Rao in 1983 during the symposium on Air Pollution Control held at the Indian Institute of Technology Delhi ([38]). This empirical index is computed by using four important parameters, including the total chlorophyll content, ascorbic acid content, RWC, and leaf pH. The magnesium tetrapyrrole pigments perform a crucial role in plant photosynthesis. Chlorophyll pigments promote the conversion of usable sunlight into chemical energy, through harvesting light energy, transferring excitation energy to reaction centers, and driving charge separation. Under polluted conditions, the concentration of photosynthetic pigments varies depending on the plant species ([31]). Several researchers noted a reduction in chlorophyll content in response to air pollution. This decline may be attributed to diverse photochemical reactions like oxidation, reduction, and revocable bleaching. Another reason may be due to the deposition of dust on the leaf blade, which might cause stomata blocking, thereby disturbing gaseous exchange, resulting in leaf temperature increase and chlorophyll synthesis deceleration ([16]). Ascorbic acid is a potent reducing and antioxidant agent that plays a key role in defense against oxidative stress caused by enhanced levels of ROS. It serves as a co-factor for many enzymes and takes part in various physiological processes including cell growth, differentiation, metabolism, and mitosis ([37]). A clear relation has been found between levels of ascorbic acid in plants and the ability to enhance the resistance to atmospheric pollution. It has been observed that plants enduring air pollution stress maintain high amounts of ascorbic acid, while sensitive plant species contain less ascorbic acid ([31]). Moreover, the synthesis of ascorbic acid is pH-controlled. High leaf pH may enhance the conversion of six-carbon sugar to ascorbic acid, whereas low pH is correlated with small ascorbic acid content ([31], [39]). RWC indicates the capability of the cell membrane to maintain its permeability under air pollution stress. The literature revealed that air contaminants increase cell permeability, which leads to a decline in water content and dissolved nutrients, resulting in premature senescence of leaves. Modification of these physiological and biochemical parameters with respect to pollutants exposure could be used as a bioindicator of environmental pollution ([31], [39]). Thus, APTI determination, based on the mentioned parameters, constitutes a reliable method for reflecting the ability of a plant to fight against atmospheric pollution. According to Lakshmi et al. ([21]) plants having APTI values in the range of 1-16 are sensitive to airborne pollution and can be exploited as suitable bioindicators. Plants having APTI values in the range of 17-29 are considered as having intermediate resistance to pollution, while those having an APTI value between 30 and 100 are resistant to pollution and can be used as a sink for air pollutants. Plants have the capability to improve air quality by absorbing water-soluble gaseous pollutants and intercepting atmospheric dust particles. The ability of plant leaves to trap and accumulate dust particulates depends on the level of contaminants in the atmosphere, meteorological status, and wind strength and direction ([30]). It also depends on the leaf traits like leaf shape, size, texture, orientation, leaf pubescence, length of petiole, and canopy of plants ([29], [30], [35], [16]). It was observed that large leaf surface results in better dust capturing ([29]). Leaves with deep grooves and high stomata density were also found to have higher dust retaining capacity, as in the case of Mangifera indica ([25]). Sessile leaves maintaining horizontal direction were observed to be efficient dust collectors ([35]). Trichomes covering the leaf surface can help catch the dust deposited on the foliar surface ([20]). Additionally, Wang et al. ([49]) reported that leaves having rough surfaces are effective in trapping particles, as in the case of Pittosporum tobira, Platanus acerifolia, Pinus tabulaeformis, Ligustrum lucidum, and Viburnum odoratissimum. All these parameters taken together play a vital role in the capacity of plants to encounter air pollution and sequester pollutants. Determining the APTI of Quercus cerris is important in order to classify this species based on its tolerance and to identify whether it can be exploited for creating green belts around polluted sites or if it can be used to indicate levels of pollution and changes in air quality in a specific area, especially in places where monitoring stations are unavailable. In the current study, the APTI of Quercus cerris in the area under study ranged from 4.79 to 9.85. Hence, it is designated as a sensitive species and can be exploited as a bioindicator of environmental pollution. Additionally, the APTI was found to be lower in the contaminated sites compared with that in the Ctrl site. Our results correlate with the findings of Chauhan ([6]), who reported a significant decrease in APTI of various sensitive plants grown at air-contaminated sites.
Fig. 6 - APTI values recorded in the different sites during the study period.
In addition to the spatial variations, significant temporal variations were also observed for different parameters throughout the months (Tab. 1). According to repeated ANOVA tests, the fallen dust levels revealed statistically significant differences between the five months. Dust particulates showed their highest levels in the three sites in June, then dropped in August and started to increase over the following two months. The reason for such an increase in dust levels during autumn (September and October) could be attributed to the quiet and stable weather conditions with lower wind speed, higher humidity, and reduced air temperature. Hence, dust contaminants were not able to scatter into the atmosphere, which led to an increased level of dust ([8]). The elevation of dust levels during autumn could also be due to the increased automobile movement, vehicles entering into the middle of the forest, along with increased recreational activities such as lighting campfires and burning waste. During this period of the year, Quercus cerris leaves turn yellow, where its Lebanese name “the golden forest” comes from, thereby attracting more visitors to camp there.
Tab. 1 - Spatial-temporal variations of the studied parameters. Mean values ± standard deviation recorded for dust, stomatal conductance (gs), relative water content (RWC), potential hydrogen (pH), proline (Pro) and carotenoids (Car) in the leaves of Quercus cerris from three different sites control (Ctrl), severe polluted site (S1) and moderate polluted site (S2) along the study period.
| Parameter | Site/Month | June | July | August | September | October | P-value (temporal variation) |
P-value (month × site) |
|---|---|---|---|---|---|---|---|---|
| Dust (%) | Ctrl | 11.0 ± 0.8 | 7.3 ± 1.2 | 5.1 ± 0.5 | 7.2 ± 0.7 | 7.6 ± 1.3 | 0.014 | 0.047 |
| S1 | 19.0 ± 1.7 | 13.9 ± 1.1 | 10.1 ± 0.4 | 13.0 ± 0.1 | 13.4 ± 2.4 | |||
| S2 | 12.1 ± 4.4 | 9.0 ± 3.0 | 8.7 ± 0.9 | 10.3 ± 1.5 | 10.6 ± 2.7 | |||
| gs (mmol m-2s-1) | Ctrl | 287.3 ± 32.3 | 109.0 ± 10.9 | 57.4 ± 5.8 | 58.4 ± 3.5 | 114.9 ± 24 | <0.001 | 0.045 |
| S1 | 76.5 ± 12.2 | 55.6 ± 1.8 | 34.7 ± 1.8 | 53.7 ± 2.7 | 35.8 ± 1.3 | |||
| S2 | 144.4 ± 2.6 | 75.4 ± 9.3 | 44.1 ± 5.3 | 55.3 ± 1.6 | 69.1 ± 8.6 | |||
| RWC (%) | Ctrl | 79.6 ± 6.0 | 45.8 ± 5.9 | 44.6 ± 4.5 | 47.1 ± 5.4 | 55.9 ± 4.0 | 0.002 | 0.131 |
| S1 | 67.9 ± 3.6 | 33.8 ± 4.0 | 32.4 ± 1.7 | 38.4 ± 4.1 | 39.7 ± 4.6 | |||
| S2 | 45.4 ± 1.6 | 44.3 ± 2.2 | 39.3 ± 4.1 | 44.6 ± 2.1 | 57.6 ± 3.7 | |||
| pH | Ctrl | 5.1 ± 0.0 | 5.8 ± 0.3 | 5.4 ± 0.3 | 5.9 ± 0.1 | 5.6 ± 0.1 | <0.001 | 0.036 |
| S1 | 5.5 ± 0.0 | 6.0 ± 0.1 | 5.8 ± 0.1 | 5.8 ± 0.1 | 6.0 ± 0.1 | |||
| S2 | 5.0 ± 0.0 | 5.7 ± 0.0 | 5.6 ± 0.1 | 5.8 ± 0.0 | 5.5 ± 0.1 | |||
| H2O2 (ppm) | Ctrl | 21.9 ± 4.1 | 20.6 ± 1.5 | 23.1 ± 2.7 | 27.4 ± 6.4 | 23.5 ± 2.4 | 0.070 | 0.077 |
| S1 | 23.3 ± 1.1 | 35.4 ± 3.9 | 46.0 ± 8.6 | 38.7 ± 10.4 | 42.1 ± 8.1 | |||
| S2 | 28.9 ± 3.3 | 40.7 ± 2.0 | 39.2 ± 8.5 | 46.0 ± 15.7 | 33.0 ± 8.2 | |||
| Pro (ppm) | Ctrl | 123.2 ± 30.4 | 123.7 ± 10.8 | 176.2 ± 43.8 | 217.2 ± 6.8 | 188.6 ± 2.2 | 0.028 | 0.018 |
| S1 | 132.1 ± 65.8 | 134.9 ± 28.3 | 94.2 ± 7.4 | 180.7 ± 21.1 | 207.6 ± 17.1 | |||
| S2 | 212.0 ± 33.9 | 134.6 ± 22.9 | 154.1 ± 8.5 | 378.4 ± 93.4 | 272.8 ± 26.6 | |||
| Car (mg g-1) | Ctrl | 0.0 ± 0.0 | 0.1 ± 0.0 | 0.1 ± 0.0 | 0.1 ± 0.0 | 0.1 ± 0.0 | 0.050 | 0.449 |
| S1 | 0.1 ± 0.0 | 0.2 ± 0.0 | 0.1 ± 0.0 | 0.1 ± 0.0 | 0.1 ± 0.0 | |||
| S2 | 0.1 ± 0.1 | 0.2 ± 0.0 | 0.2 ± 0.0 | 0.2 ± 0.0 | 0.1 ± 0.0 |
Stomatal conductance and RWC also displayed considerable monthly variations in the three different sites. Indeed, the gs and RWC were found to be lower in July, August, September, and October in the three different sites as compared with June. Quercus cerris is a deciduous tree that usually retains its leaves for 6-7 months. According to Reich & Borchert ([32]), the gs and RWC decrease with increasing age, especially in deciduous species. They reported that the older leaves of some species have lower stomatal control and higher water deficits than younger leaves. Another possible reason for decreased stomatal conductance over the studied months could be attributed to drought and soil water deficit conditions. It is well known that under drought stress conditions, the guard cells surrounding the stomatal pore close to limit water loss through the transpiration process ([9], [34]). Anav et al. ([4]) reported in their study that the soils in the Mediterranean basin (Italy, Spain, Turkey, and Greece) dry out rapidly during the warm and dry summer season, causing high drought stress in October. They also pointed out that drought-resistant species, such as Quercus sp.p., respond to drought by displaying a concurrent reduction in stomatal conductance and water potential. Additionally, in a study conducted by Schäfer ([34]) on three different Quercus species, it was revealed that the stomatal conductance of Q. velutina and Q. coccinea leaves were found to be markedly decreased with decreasing soil moisture content. The results of our study concur with these observations.
Proline concentrations also changed markedly over the months at each site. The Autumn months (September and October) showed a considerable increase in proline content when compared with the summer months (June, July, and August). This increase in proline levels could be considered as part of the tree tolerance response to temperature change.
On the other hand, Tab. 1 showed that the interaction p-value between month and site was also significant for dust, gs, pH, and proline (0.047, 0.045, 0.036, and 0.018, respectively). A significant interaction means that the effect of the months on the parameters depends on the site, and vice versa.
Conclusion
The present study investigated the impact of the unpaved road dust and recreational activities on different physiological and biochemical parameters of Quercus cerris L. growing in the Ezer forest located in the Akkar district (Northern Lebanon). Our findings revealed that foliar dust deposition was higher at experimental sites as compared to the Ctrl site. Dust deposition was also found to decrease as the distance from the road increased. The study clearly showed that Quercus cerris growing at S1 and S2 sites are adversely affected due to elevated levels of dust deposition compared with the Ctrl site. Leaf samples collected from trees at contaminated sites showed a significant decrease in stomatal conductance and RWC during the study. As for the pH, it was found to increase at the S1 site, which is the nearest site to the road. Additionally, the middle of the forest (S2), which is situated at a distance of 350 m from the public road, and which is experiencing human activities, recorded high levels of H2O2 and showed the highest levels of oxidative stress scavengers, like proline and carotenoids, indicating that the middle of the forest is facing harsh environmental conditions. Moreover, the APTI values of Quercus cerris ranged from 4.79 to 9.85, which indicates that this tree is categorized as a sensitive species and can be utilized to monitor levels of air contamination.
The principal obstacle to this study was the lack of air pollution monitoring stations in the area under study, thus accurate data on the levels of contaminants in the ambient air were not available. The results of the gaseous pollutants measurements raise questions about the accuracy of the method used. The inability to detect these gases does not necessarily mean that they are not present in the ambient air of the studied area. The meteorological conditions of the area may also interfere with the detection of gases by the used pumps. In fact, high humidity is considered one of the main limitations of detector tubes, which only have an accuracy of ± 20%.
Further studies should be done to help clarify the need for biomonitoring programs in unprotected forests in Lebanon. Monitoring air contamination levels is a good tool to detect pollution peaks, regulate atmospheric pollution, and ultimately improve ambient air quality. This could be achieved by installing measuring devices that detect and monitor ambient levels of air pollutants. Furthermore, paving the public dirt road situated on the northern side of the forest could minimize dust and non-exhaust emissions. Strict measures must also be taken to increase public awareness and prevent vehicles from entering the forest. Moreover, many studies have assessed the impacts of exhaust emissions on plants, but few have investigated the contribution of non-exhaust emissions such as road dust resuspension, tire and brake abrasion, and roadway surface degradation. Therefore, further research must be done to extend the knowledge on the impacts of dust pollution on plants, and more effective international environmental policies on non-exhaust emissions must be taken.
Acknowledgments
The authors duly acknowledge Beirut Arab University and the Lebanese Agricultural Research Institute for providing facilities and financial assistance to conduct the present research study.
References
Gscholar
Gscholar
Gscholar
Gscholar
Gscholar
Gscholar
Gscholar
Authors’ Info
Authors’ Affiliation
Mahmoud Khalil 0000-0001-7629-4357
Beirut Arab University, Faculty of Science, Department of Biological Sciences, Debbieh Campus (Lebanon)
Beirut Arab University, Faculty of Science, Department of Biological Sciences, Tripoli Campus (Lebanon)
Lebanese Agricultural Research Institute, Department of Soil, Plants and Fertilizers, Fanar, Metn (Lebanon)
Corresponding author
Paper Info
Citation
Najib R, Houri T, Khairallah Y, Khalil M (2022). Effect of dust accumulation on Quercus cerris L. leaves in the Ezer forest, Lebanon. iForest 15: 322-330. - doi: 10.3832/ifor3959-015
Academic Editor
Rossella Guerrieri
Paper history
Received: Sep 01, 2021
Accepted: Jun 13, 2022
First online: Aug 23, 2022
Publication Date: Aug 31, 2022
Publication Time: 2.37 months
Copyright Information
© SISEF - The Italian Society of Silviculture and Forest Ecology 2022
Open Access
This article is distributed under the terms of the Creative Commons Attribution-Non Commercial 4.0 International (https://creativecommons.org/licenses/by-nc/4.0/), which permits unrestricted use, distribution, and reproduction in any medium, provided you give appropriate credit to the original author(s) and the source, provide a link to the Creative Commons license, and indicate if changes were made.

Web Metrics
Breakdown by View Type
Article Usage
Total Article Views: 34088
(from publication date up to now)
Breakdown by View Type
HTML Page Views: 28442
Abstract Page Views: 3025
PDF Downloads: 2125
Citation/Reference Downloads: 4
XML Downloads: 492
Web Metrics
Days since publication: 1400
Overall contacts: 34088
Avg. contacts per week: 170.44
Article Citations
Article citations are based on data periodically collected from the Clarivate Web of Science web site
(last update: Mar 2025)
Total number of cites (since 2022): 3
Average cites per year: 0.75
Publication Metrics
by Dimensions ©
Articles citing this article
List of the papers citing this article based on CrossRef Cited-by.
Related Contents
iForest Similar Articles
Research Articles
Evaluating anatomical and biochemical responses to cement dust pollution in Quercus castaneifolia C.A. Mey. and Zelkova carpinifolia (Pall.)
vol. 18, pp. 102-108 (online: 10 May 2025)
Research Articles
Dust collection potential and air pollution tolerance indices in some young plant species in arid regions of Iran
vol. 12, pp. 558-564 (online: 17 December 2019)
Research Articles
Recovery of water potential and leaf gas exchange performance following drought stress in Quercus cerris populations
vol. 19, pp. 94-101 (online: 17 March 2026)
Research Articles
Analysis of dust exposure during chainsaw forest operations
vol. 10, pp. 341-347 (online: 23 February 2017)
Research Articles
Effect of drought stress on some growth, morphological, physiological, and biochemical parameters of two different populations of Quercus brantii
vol. 11, pp. 212-220 (online: 01 March 2018)
Review Papers
Monitoring the effects of air pollution on forest condition in Europe: is crown defoliation an adequate indicator?
vol. 3, pp. 86-88 (online: 15 July 2010)
Research Articles
Analysis of biometric, physiological, and biochemical traits to evaluate the cadmium phytoremediation ability of eucalypt plants under hydroponics
vol. 10, pp. 416-421 (online: 24 March 2017)
Technical Reports
Air pollution regulations in Turkey and harmonization with the EU legislation
vol. 4, pp. 181-185 (online: 11 August 2011)
Research Articles
Bioaccumulation of long-term atmospheric heavy metal pollution within the Carpathian arch: monumental trees and their leaves memoir
vol. 17, pp. 370-377 (online: 27 November 2024)
Editorials
COST Action FP0903: “Research, monitoring and modelling in the study of climate change and air pollution impacts on forest ecosystems”
vol. 4, pp. 160-161 (online: 11 August 2011)
iForest Database Search
Search By Author
Search By Keyword
Google Scholar Search
Citing Articles
Search By Author
Search By Keywords
PubMed Search
Search By Author
Search By Keyword


