Role of forest cover, land use change and climate change on water resources in Marmara basin of Turkey
iForest - Biogeosciences and Forestry, Volume 8, Issue 4, Pages 480-486 (2014)
doi: https://doi.org/10.3832/ifor1242-007
Published: Oct 31, 2014 - Copyright © 2014 SISEF
Research Articles
Collection/Special Issue: IUFRO 7.01.00 - Ilhéus (Brazil, 2013) & Beijing (China, 2014)
Forest Response to Climate Change and Air Pollution
Guest Editors: Paoletti E, Kozovitz A, Feng Z, Bytnerowicz A
Abstract
We evaluated the influence of climate change and land use changes on water resources in the Marmara Region (Turkey) using the watershed runoff coefficients (RC) and trend analysis techniques on long-term (30 years) hydrometerological data. Land use changes in the selected sub-watersheds were obtained from CORINE land use maps for 1990, 2000, and 2006, and interpolated for annual changes. Forty-two land use types of Corine maps were grouped in four basic classes (forests, rangelands, farmlands, settlements). Principal component analysis was used to identify the most relevant land use types influencing RC since 1990. Results showed that changes in the proportion of forestlands, farmlands, and rangelands significantly affected RC. Settlements also affected RC, but to a lesser extent. RCs values for the different land use types were optimized on a subset of 28 out of the 48 sub-watersheds analyzed by minimizing the sum of least-square errors, while the remaining subset of 20 sub-watersheds was used to validate the models obtained. The R2 values for optimization and validation were 0.80 and 0.70, respectively. RCs of all watersheds were estimated for the period 1990-2012. Long-term trends in mean annual precipitation and temperature were examined by Mann-Kendall test based on time series from eight weather stations with records since 1930s. Contrasting significant trends of variation through time were found only for two stations as for precipitation, and for one station as for temperature. Overall, our results suggest that significant land use changes occurred in the region since 1990, but only slight variations in climate parameters. However, we conclude that neither land use changes nor the variation in climate parameters caused statistically significant effects on RCs and water resources.
Keywords
Climate Change, Land Use Change, Water Resources, Runoff Coefficient
Introduction
Urbanization is a major driver of land use change and is extensively studied in land use literature, especially in disciplines like landscape ecology and watershed science. Some research focused on certain land use types ([1], [30]), while others tried to identify their impacts on biodiversity, forests and water ([5], [39]). Impacts on society and natural resources have been frequently emphasized in these studies. Urbanization and associated sprawl cause changes in society and environment and therefore interact with broader issues like climate and water resources.
Water is becoming a critical natural resource for Turkey with its fast urbanization trend ([29]). The increasing population in big cities causes constantly increasing demand of water. New water resources have been identified and pipeline projects have been developed and implemented in the last 20 years. Melen and Istranca projects are examples of expensive long-range, trans-basin projects ([7]) supposed to meet the water demand of Istanbul for the next 10-15 years. However, threats that may break down this optimistic prevision include: deterioration of reservoirs, increasing per capita water use, variability in precipitation, and increase in evapotranspiration rates due to gradual long-term changes in temperature and precipitation conditions.
Forest cover in Turkey has been increasing in the last five decades due to afforestation efforts and abandonment of farmlands in the countryside ([19]). This increase has hydrological consequences as forests can significantly influence flows and conditions in a watershed ([28]). Given that groundwater potential of Istanbul is low, the share of surface water resources is at 98% ([7]). This causes water supply to be strongly dependent on annual precipitation and the prevailing land use. In years of low precipitation, there is always a possibility of gap between supply and demand (deficit) during late summer months.
Though not supported by solid scientific evidence, two major problems have often been identified by local authorities towards the sustainable management of water resources of the region, i.e., climate change and land use conversion in watersheds.
Climate change is today’s most remarkable threat towards the sustainability of natural resources ([3]). Expected and (partly) realized changes in temperature and precipitation ([16], [34], [22], [21], [11]) as well as the response of ecosystems to projected changes in climatic parameters and atmospheric composition, have been studied thoroughly ([9], [26], [36], [4]). According to these studies, changes in precipitation or temperature or both would have consequences on evapotranspiration conditions and the water budget. As reported by Nan et al. ([17]), temperature, precipitation and evaporation conditions determine the response of watershed hydrological systems. Changes may increase or decrease runoff trends and also annual water supply. Possible impacts of such changes on water resources in Turkey have not been evaluated yet ([18]).
While governmental water agencies are seeking new water resources, existing resources are occupied by settlements or farmlands (i.e., Kucukcekmece, Elmali). Governments and municipalities in Turkey face the difficult task of minimizing urban development in reservoir watersheds. On the other hand, airport, highway, and sport arena projects causing massive urban developments in watersheds have been encouraged. Moreover, many residential projects have been implemented to accommodate thousands of people migrating to Istanbul every year. Consequently, settlements and associated conversions for additional resources (i.e., agricultural products, livestock) have caused broad scale land use changes in Marmara region of Turkey during the last 30 years.
Land use is one of the primary determinants of water production. The influence of land use and land use change on water production has been investigated as for water quality ([24], [35], [13]), quantity ([37], [38]), and regime ([31], [23]). Based on these studies, significant determinants of water production are:
- forests ecosystems decrease water yield, increase quality, attenuate small scale floods, and regulate water regime in most cases;
- the influence of farmlands and rangelands on water production is very variable and depends on local management practices;
- settlements increase runoff volume by reducing interception losses and infiltration rates but may severely decrease water quality.
One of the most practical tools for analyzing land use influence on water production is the runoff coefficient (RC - [32]) that is calculated on an annual basis. RC is highly correlated with watershed imperviousness ([25]), the portion of watershed area covered by roads, houses, and other built environments. However, RC may also be affected by climatic, topographic and edaphic parameters. Therefore, RC on an annual basis should be used as an indicator, not as a determinant, for water yield. It is however used in simple flood estimation equations like the Rational method ([6]) on event basis. The land use type determines infiltration capacity, evapotranspiration (ET) rate, and runoff type that affect RC. It may also reflect slope and topographic conditions. Furthermore, the RC of a watershed varies over time and space as topography and ET conditions change. There are several empirical models to estimate potential ET (i.e., Priestley-Taylor, Turc, Thorntwaite), but RC of a watershed can only be calculated by measured precipitation-runoff data.
In this paper, we hypothesize that changes in land use and climate occurred in the last 4-5 decades in the Marmara region affected water yield of watersheds. We used historical, hydrological, climatological, and land use change data. The results may help shaping future policies on water resources and land use management of the region and country.
Material and methods
Study area
Marmara basin (24 100 km2) is located in the most industrialized region of Turkey with the highest population density ([20]). Average annual precipitation in the region ranges between 440 and 800 mm. Istanbul is the largest city with a population of more than 14 million people, who demand a daily average of 2.6 million m3 of water ([7]). The demand is increasing every year, adding more pressure to the existing water resources and requiring efforts to explore new ones. The General Directorate of Water Works (DSI), a government agency responsible for the development of water resources, has established a relatively extensive monitoring network of water flow in the region (Fig. 1).
Fig. 1 - The Marmara basin (Turkey) and the location of the streamflow monitoring stations (white circles) operated by the State Hydraulic Works (DSI). Digital elevation model of the region is reported in the right box.
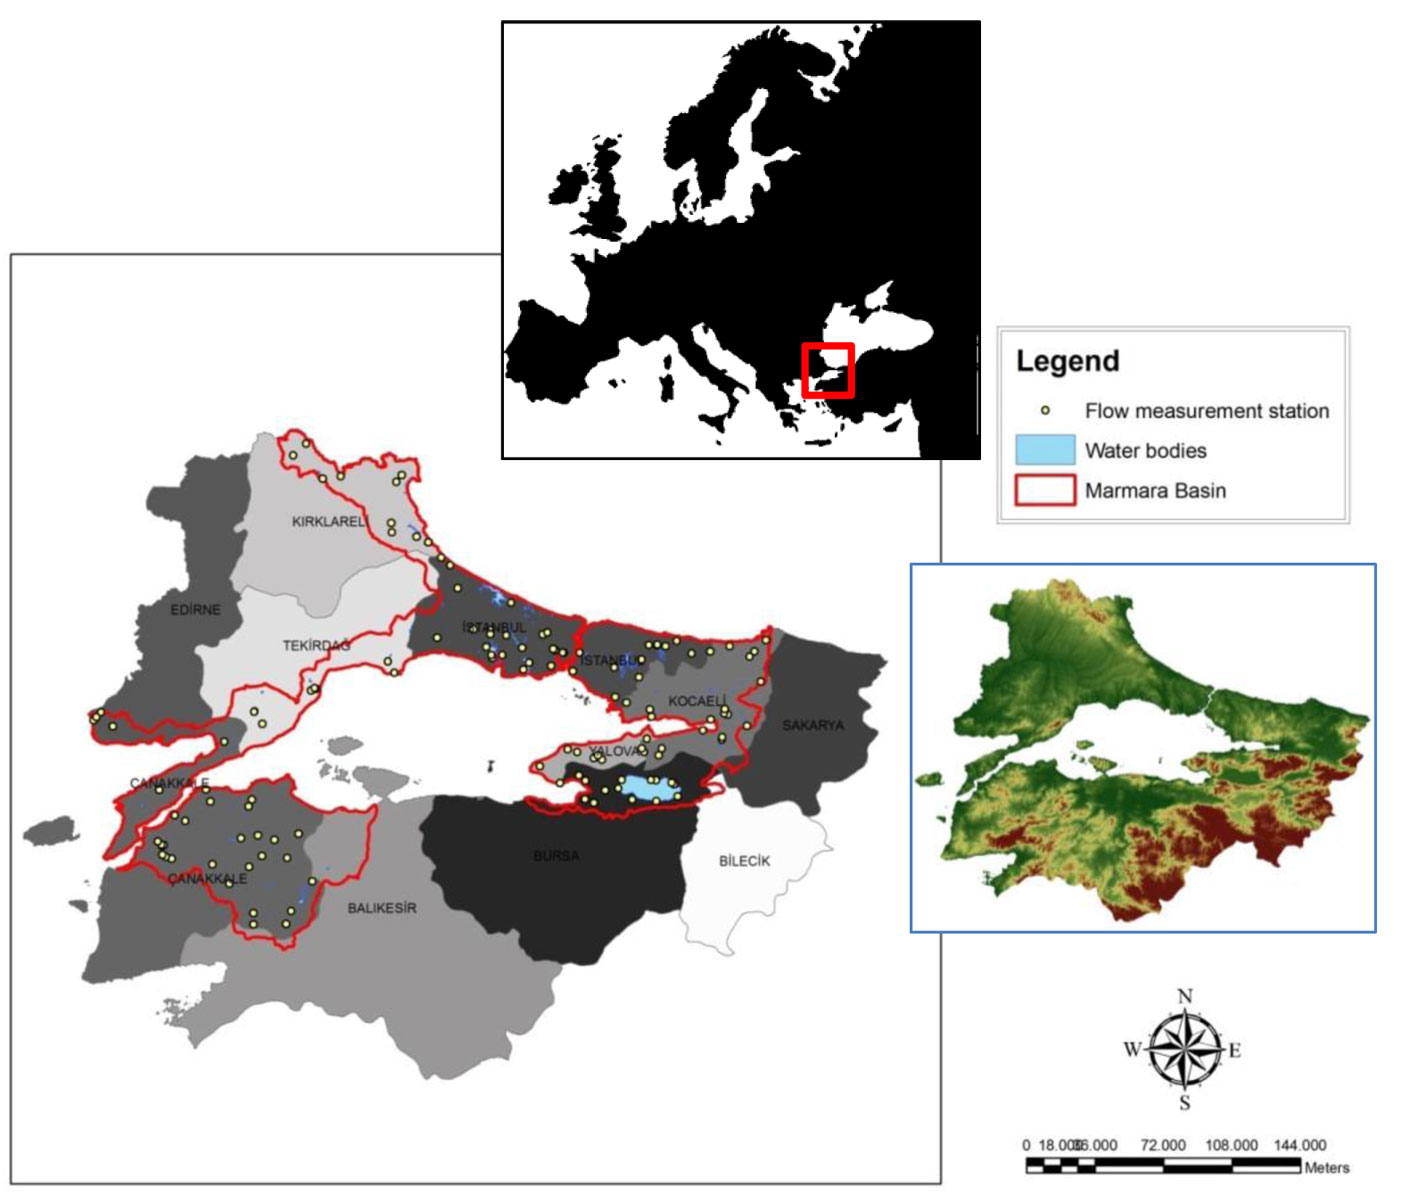
The climate is mild oceanic temperate, with a moderate soil water deficit in summer which increases from north to south. There is a strong seasonality in precipitation, with a 2-3 month long dry period in the summer and a rainfall peak in winter months (generally in January - [27]). The region is surrounded by mountains up to 2500 m a.s.l. in the south and south-east, and up to 1000 m a.s.l. in the north-west (Istranca region). However, the Marmara basin does not include highlands and is generally flatter as compared with the rest of the country. Such region was chosen because of the higher number of flow measurement stations compared to other basins of Turkey, and also for its richness in water bodies and reservoirs.
Watershed delineation and hydrological data
Some 48 sub-watersheds with flow measurement stations of the State Hydraulic Works (DSI) operating since at least 10 years were selected (Tab. 1). The size of sub-watersheds ranged between 17 to 969 km2, though 80% varied between 20 to 200 km2.
Tab. 1 - Sub-watersheds and hydrologic data used in this study. (RC): runoff coefficient; (a): IDW-interpolated.
| Sub-watershed | Area (km2) | Mean Discharge (m3/s) |
Precipitation (a) (mm/year) | Water Yield (mm/year) | RC | Closest Meteo Station |
Mean Elevation (m) |
Mean Slope (%) |
|---|---|---|---|---|---|---|---|---|
| Altinkulaç | 34.75 | 0.292 | 629.49 | 265.00 | 42.10 | Edremit | 274.18 | 24.29 |
| Avcidere | 36.25 | 0.493 | 753.59 | 428.89 | 56.91 | Kocaeli | 553.40 | 41.15 |
| Bayramdere | 69.99 | 0.46 | 621.15 | 207.27 | 33.37 | Çanakkale | 239.66 | 26.92 |
| Çakildere | 55.04 | 0.346 | 727.47 | 198.25 | 27.25 | Kumköy | 154.44 | 10.53 |
| Çinardere | 58.05 | 0.793 | 627.65 | 430.80 | 68.64 | Çanakkale | 217.86 | 21.41 |
| Degirmendere | 40.88 | 0.293 | 570.60 | 226.03 | 39.61 | Kirklareli | 607.90 | 21.51 |
| Göçbeyli Deresi | 133.37 | 1.56 | 780.95 | 368.87 | 47.23 | Kocaeli | 222.69 | 15.92 |
| Göksu Deresi | 394.03 | 6.01 | 792.45 | 481.01 | 60.70 | Kocaeli | 287.71 | 20.27 |
| Isiklar Deresi | 141.23 | 1.41 | 599.08 | 314.85 | 52.55 | Tekirdag | 336.89 | 21.24 |
| Isiklar Deresi | 60.57 | 0.449 | 583.33 | 233.77 | 40.08 | Tekirdag | 228.80 | 31.81 |
| Istiranca | 291.48 | 2.34 | 674.21 | 253.17 | 37.55 | Kumköy | 207.56 | 14.08 |
| Kabakoz Deresi | 80.21 | 1.35 | 824.25 | 530.78 | 64.39 | Kocaeli | 139.21 | 21.40 |
| Kagithane | 175.91 | 2.04 | 941.98 | 365.72 | 38.82 | Kumköy | 94.29 | 15.96 |
| Karadere | 252.15 | 2.17 | 733.43 | 271.40 | 37.00 | Kocaeli | 632.64 | 29.61 |
| Karadere | 22.38 | 0.21 | 766.50 | 295.91 | 38.61 | Yalova | 293.16 | 27.93 |
| Karanlik Dere | 78.71 | 0.743 | 641.30 | 297.69 | 46.42 | Edremit | 546.94 | 30.76 |
| Karasu-Incegiz | 183.8 | 0.959 | 704.46 | 164.54 | 23.36 | Kumköy | 147.95 | 10.78 |
| Kaynarca | 82.01 | 0.466 | 626.88 | 179.19 | 28.58 | Edremit | 196.36 | 20.42 |
| Kilinci Dere | 62.43 | 0.458 | 869.93 | 231.35 | 26.59 | Kumköy | 92.25 | 13.58 |
| Kirazdere | 254.02 | 5.29 | 731.73 | 656.74 | 49.75 | Kocaeli | 841.72 | 39.32 |
| K.Kumla Dere | 20.69 | 0.3 | 811.53 | 457.26 | 56.35 | Yalova | 452.12 | 34.66 |
| Kocabag Deresi | 167.02 | 1.31 | 639.11 | 247.35 | 38.70 | Edremit | 493.32 | 28.74 |
| Kocabag Deresi | 968.92 | 7.71 | 632.24 | 250.94 | 39.69 | Edremit | 306.55 | 22.71 |
| Kocaçay | 48.36 | 0.958 | 647.44 | 624.72 | 56.49 | Edremit | 658.91 | 30.13 |
| Kocaçay | 41.99 | 0.186 | 621.76 | 139.69 | 22.47 | Çanakkale | 392.67 | 28.12 |
| Kocadere | 197.9 | 2.54 | 576.98 | 404.76 | 70.15 | Kirklareli | 521.12 | 26.43 |
| Kocadere | 65.09 | 0.551 | 893.05 | 266.96 | 29.89 | Bursa | 568.89 | 32.08 |
| Kocadere | 75.96 | 0.762 | 831.30 | 316.36 | 38.06 | Yalova | 634.98 | 38.99 |
| Kovandere | 112.07 | 0.631 | 602.66 | 177.56 | 29.46 | Tekirdag | 183.37 | 10.46 |
| Kovanlik | 73.5 | 2.423 | 652.13 | 1039.62 | 59.42 | Edremit | 730.82 | 45.60 |
| Kumcagiz | 49.65 | 0.703 | 789.78 | 446.52 | 56.54 | Kocaeli | 74.90 | 11.88 |
| Kurudere | 29.25 | 0.781 | 795.96 | 842.04 | 15.79 | Kocaeli | 142.38 | 18.08 |
| Malava Deresi | 112.87 | 2.89 | 828.52 | 807.47 | 57.46 | Kumköy | 115.74 | 16.61 |
| Ozan Deresi | 78.07 | 2.76 | 815.46 | 1114.89 | 36.72 | Kocaeli | 227.36 | 21.57 |
| Pabuçdere | 85.26 | 1.01 | 616.87 | 373.58 | 60.56 | Kirklareli | 431.41 | 27.94 |
| Sariçay | 212.07 | 0.998 | 615.35 | 148.41 | 24.12 | Çanakkale | 408.20 | 28.64 |
| Sarisu-Izzettin | 79.82 | 1 | 755.76 | 395.09 | 52.28 | Kumköy | 87.79 | 12.52 |
| Sellimandira | 54.28 | 1.49 | 782.23 | 865.67 | 70.67 | Yalova | 577.63 | 36.99 |
| Suludere | 34.28 | 0.627 | 769.20 | 576.81 | 74.99 | Kocaeli | 550.75 | 41.17 |
| Velikadere | 307.11 | 5.14 | 588.41 | 527.81 | 59.70 | Kirklareli | 532.59 | 24.65 |
| Yagcidere | 17.27 | 0.2 | 770.75 | 365.21 | 47.38 | Yalova | 356.48 | 29.01 |
| Yalakdere | 269.91 | 2.35 | 766.62 | 274.57 | 35.82 | Yalova | 358.15 | 30.86 |
| Yenidüz Deresi | 105.63 | 2.01 | 789.22 | 600.09 | 76.04 | Kocaeli | 149.59 | 14.30 |
| Yamandere | 31.04 | 0.346 | 808.10 | 351.53 | 43.50 | Bursa | 523.76 | 19.92 |
| Yegildere | 58.43 | 1.32 | 830.18 | 712.43 | 45.82 | Kocaeli | 128.27 | 19.53 |
| Yilgindere | 17.69 | 0.22 | 788.18 | 392.19 | 49.76 | Kocaeli | 145.74 | 21.37 |
| Yulafli Dere | 207.05 | 2.27 | 778.49 | 345.75 | 44.41 | Kocaeli | 136.64 | 15.24 |
| Gönen Çayi | 643.64 | 7.36 | 643.56 | 360.61 | 56.03 | Edremit | 505.44 | 28.96 |
Sub-watersheds were delineated using the ArcHydro® module and visually corrected in ArcGIS® (ESRI, Redlands, CA, USA). We used daily stream flow data obtained from the monitoring stations to calculate annual water yield. However, the length of time series was not the same for all stations: most were starting from 1990s, while a few stations had data since 1960s or 1970s. Precipitation data were complete and did not include missing values.
Eight weather stations having long-term climatic records starting from 1930s (mean annual temperature and precipitation) were identified in the study area, to be used in trend detection tests.
Land use change data was obtained from three consecutive CORINE maps prepared with the same methodology. We used CORINE 1990, 2000, and 2006 maps, which is a reliable data source of historical land uses in Turkey. CORINE maps are also the mapping system used for the National Greenhouse Gas Inventory Report (NIR) of Turkey. Higher resolution land use maps (STATIP with resolution < 2.5 m) have been developed in recent years, but they do not go back to ’90s.
RCs was calculated as follows (eqn. 1):
RCs was obtained for the 48 watersheds considered and then estimated for various types of land uses. We could apply this simple procedure as the study area was homogenous regarding soil, topography (Tab. 2), climate, and human influence (land use practices and habits), and very flat compared with other basins across the country.
Tab. 2 - List of the variables used in the PCA and correlations between variables and the first three eigenvalues (F1 to F3).
| Variable | Obs | Min | Max | Mean | STD | F1 | F2 | F3 |
|---|---|---|---|---|---|---|---|---|
| Deciduous forest area (km2) | 48 | 0.32 | 222.61 | 45.22 | 53.13 | 0.822 | 0.202 | 0.150 |
| Coniferous forest area (km2) | 48 | 0.00 | 100.19 | 7.56 | 18.89 | 0.782 | 0.213 | -0.091 |
| Mixed forest area (km2) | 48 | 0.00 | 183.83 | 18.78 | 36.04 | 0.846 | 0.315 | -0.128 |
| Forest area (km2) | 48 | 1.15 | 464.02 | 71.56 | 95.62 | 0.930 | 0.273 | 0.017 |
| Forest intensity (km2/km2) | 48 | 2.09 | 99.93 | 53.32 | 22.77 | -0.054 | 0.863 | 0.162 |
| Settlement area (km2) | 48 | 0.00 | 17.76 | 1.73 | 3.68 | 0.720 | -0.192 | 0.337 |
| Settlement intensity (km2/km2) | 48 | 0.00 | 8.99 | 1.08 | 1.86 | 0.158 | -0.407 | 0.485 |
| Perennial farmland area (km2) | 48 | 0.00 | 25.94 | 1.17 | 4.53 | 0.045 | 0.009 | -0.298 |
| Annual farmland area (km2) | 48 | 0.00 | 321.54 | 42.55 | 61.48 | 0.837 | -0.321 | 0.002 |
| Total farmland area (km2) | 48 | 0.00 | 322.72 | 43.72 | 61.74 | 0.837 | -0.319 | -0.020 |
| Farmland intensity (km2/km2) | 48 | 0.00 | 89.71 | 31.41 | 23.26 | 0.019 | -0.785 | 0.019 |
| Rangeland area (km2) | 48 | 0.00 | 194.80 | 18.28 | 31.76 | 0.877 | -0.016 | -0.229 |
| Rangeland intensity (km2/km2) | 48 | 0.00 | 40.43 | 12.86 | 9.91 | 0.046 | -0.074 | -0.650 |
| Watershed size (km2) | 48 | 17.27 | 968.92 | 137.06 | 174.40 | 0.995 | 0.030 | -0.024 |
| Mean discharge (m3/sec) | 48 | 0.19 | 7.71 | 1.53 | 1.80 | 0.894 | 0.235 | 0.196 |
| Water yield (mm) | 48 | 139.69 | 1039.62 | 387.89 | 206.31 | -0.162 | 0.587 | 0.644 |
| Annual precipitation (mm) | 48 | 446.41 | 761.98 | 627.69 | 79.21 | -0.015 | -0.206 | 0.666 |
| RC (mm/mm) | 48 | 0.24 | 1.79 | 0.62 | 0.32 | -0.159 | 0.664 | 0.523 |
| Mean elevation (m) | 48 | 74.91 | 841.72 | 347.77 | 204.56 | -0.003 | 0.773 | -0.354 |
| Mean slope (%) | 48 | 10.46 | 45.60 | 24.63 | 9.29 | -0.098 | 0.780 | -0.324 |
Precipitation data used in the RC calculation were spatially interpolated using the IDW tool of ArcGIS® and calculated for each watershed. Annual water yield was calculated using daily streamflow data. For each of the 48 watersheds, RC was obtained by dividing the annual water yield by the annual precipitation of the period for which streamflow data were available. To this purpose, we assume that watershed size significantly affects water yield, but not the RC. We tested this assumption by plotting watershed size against RC.
Data analysis
PCA is an ordination method widely used to extract a set of values of linearly uncorrelated components from a set of possibly correlated variables ([2], [8]). As the variable units were different, PCA was applied on a pairwise correlation matrix among variables.
Before applying PCA, land use types from the CORINE land use maps were combined into a smaller group of types. Variables used in PCA analysis were: coniferous forests (%, area/total watershed area), deciduous forests (%, area/total watershed area), mixed forests (%, area/total watershed area), total forest areas (%, area/total watershed area), settlement areas (%, area/total watershed area), annual farmlands (%, area/total watershed area), perennial farmlands (%, area/total watershed area), rangelands (%, area/total watershed area), elevation (m a.s.l.), slope (%), water yield (Mm3), and runoff coefficient (mm/mm). All the data were standardized by the z-transformation before analysis.
The Mann-Kendall trend test ([14], [10]) was used to detect possible trends in the RCs over the period 1990-2012.
Estimation of Runoff Coefficients (RCs)
Measured RCs were then used to estimate average RCs for four basic land use types (forests, farmlands, rangelands, and settlements) by applying the equation reported below on data from 28 sub-watersheds (eqn. 2):
where RCw is the runoff coefficient of the sub-watershed; RCforest, RCfarm, RCrange, RCsettle are the runoff coefficient of the relevant land use; Awatershed is the area of the sub-watershed (km2); Aforest, Afarm, Arange, Asettle are the areas of the relevant land use (km2).
RC values for each land use were derived by an optimized approach based on the calculation and comparison of the sum of least square errors. In this way, RCs for the watersheds were converted to RCs for land uses (forest, rangelands, farmlands, and settlements). Then, RCs for the 28 watersheds were recalculated using the RC values of the land uses. Finally, estimated and observed water yields were plotted on a graph to verify their linear relationship and its reliability. Water yields were calculated by the multiplication of a hypothetical 1 mm rainfall with the estimated RCs and the watershed size. The same procedure described above was applied on the remaining 20 watersheds to verify the reliability of the approach.
Results and discussion
As expected, water yield of watersheds increased with their size (Fig. 2), though RC was not affected by watershed size (Fig. 3). Such evidence supports our preliminary assumption on the homogeneity of watershed attributes in the region considered, by rejecting watershed size as a factor determining RC. Instead, principal component analysis revealed that the main factor affecting RC was land use proportion (land use area/watershed area) of forests, farmlands, rangelands and settlements.
Fig. 2 - Relationship between water yield and watershed size. The annual water yields of the sub-watersheds plotted against watershed size.
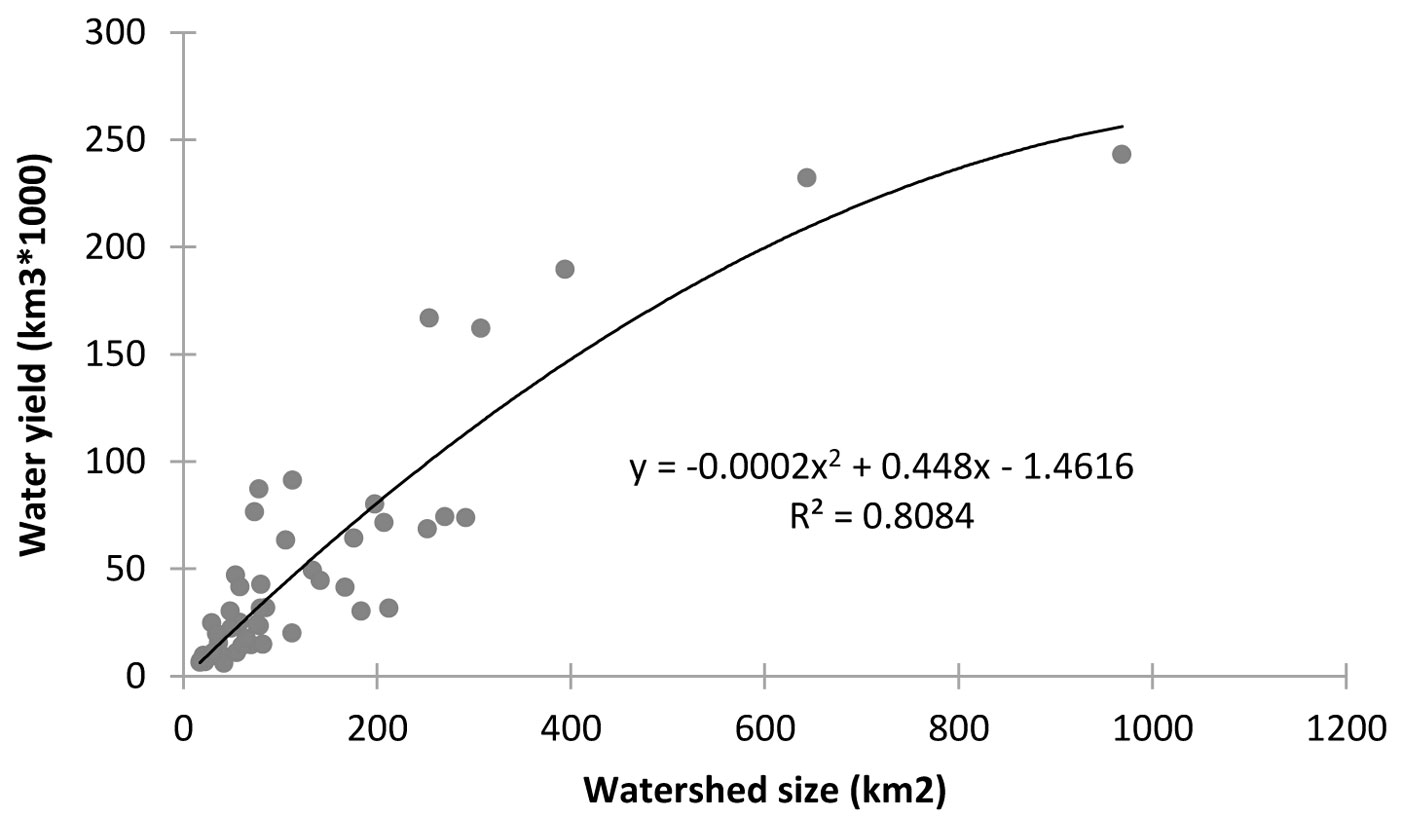
Fig. 3 - Relationship between annual runoff coefficient and watershed size. The average RCs of the sub-watersheds plotted against watershed size.

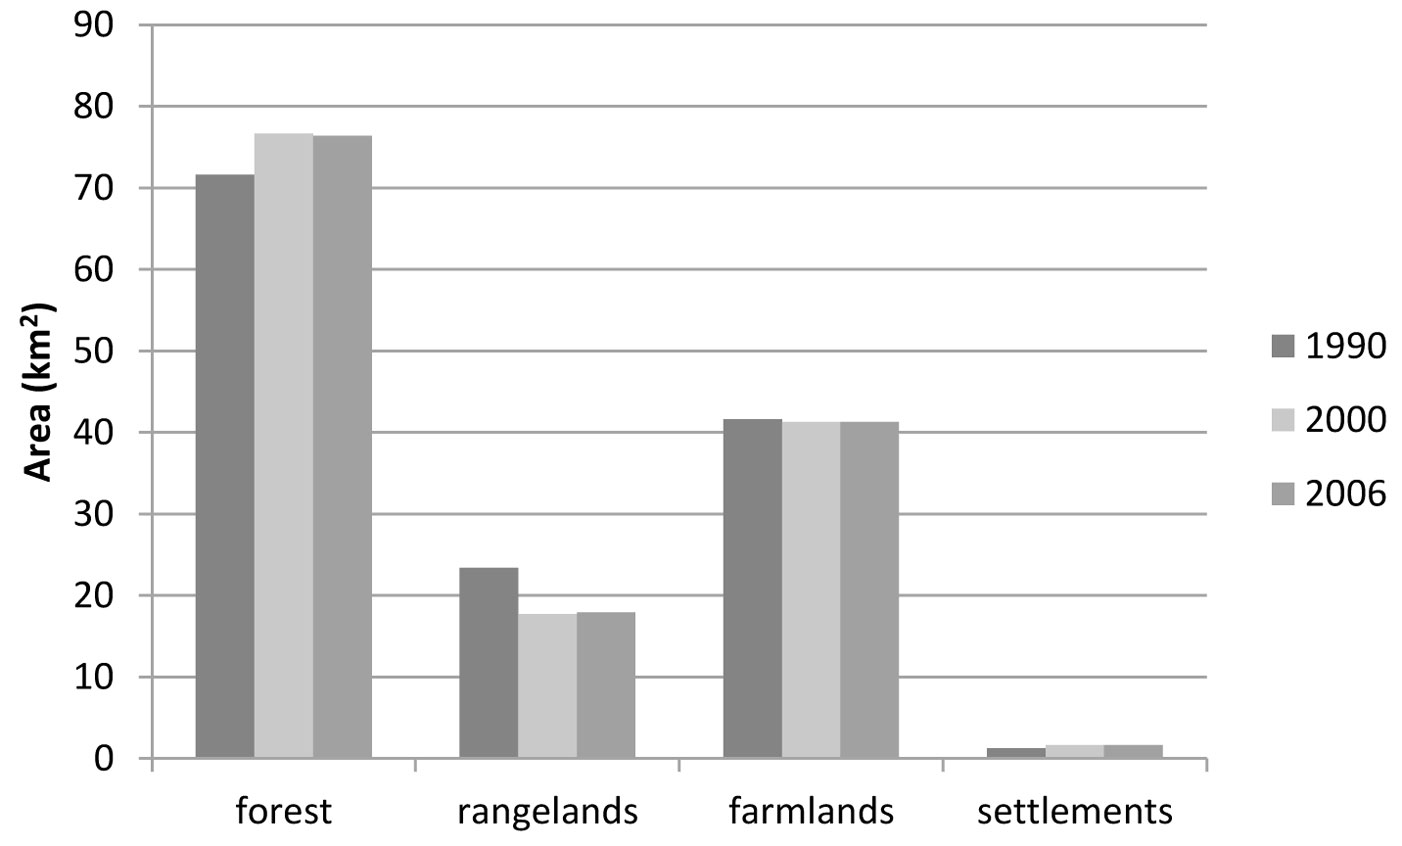
The dominant land use in the 48 sub-watersheds analyzed was forestland, followed by farmlands, rangelands, and settlements (Fig. 4). In the studied region, the total area covered by forests increased by about 5% from 1990 to 2012, farmlands decreased by 0.3%, while the most significant decrease (26.3%) occurred for rangelands. Settlements increased by 26.0% over the same period, though their overall cover did not exceed 1.5% of the total watershed area.
Fig. 4 - Average land uses in the studied watersheds and change in land use types from 1990 to 2006. Standard deviations were 2.83 km2 for forests, 3.21 km2 for rangelands, 0.20 km2 for farmlands and 0.21 km2 for settlements.
Most significant changes in land use likely to affect RC were due to an increase in forest cover and a decrease in rangelands. Both the above changes can decrease water yield in watersheds. Forest cover is known to cause more evapotranspiration as compared with vegetation in rangelands ([12]). This is also the case for extreme flow events. Despite some authors have suggested that forest cover may increase RC in the case of large flood events ([17]), many studies put forward the positive or neutral role of forests in flood prevention ([28]).
The role of watershed imperviousness due to sprawl has been largely studied and is known to be a major cause of increased flooding ([33], [15]). However, in our study the percentages of settlements was very low compared to other land uses, despite the fact the region analyzed is the most populated of the whole country.
RC values obtained from the relationship between land use and runoff were 0.40 for forests, 0.49 for farmlands, 0.61 for rangelands, and 0.95 for settlements. R2 values for model construction and verification were 0.80 (p<0.01) and 0.70 (p<0.01), respectively (Fig. 5). This means that the predicted RC values were close to actual RC values. Therefore, RCs estimated for each land use were combined in a single series by taking their average value (Fig. 6), and used to assess RCs for the whole period 1990-2012.
Fig. 5 - RC prediction and validation procedure. The observed RCs of the 28 sub-watersheds were plotted against predicted RCs (A) and the same procedure was done for the remaining 20 sub-watersheds for validation (B).
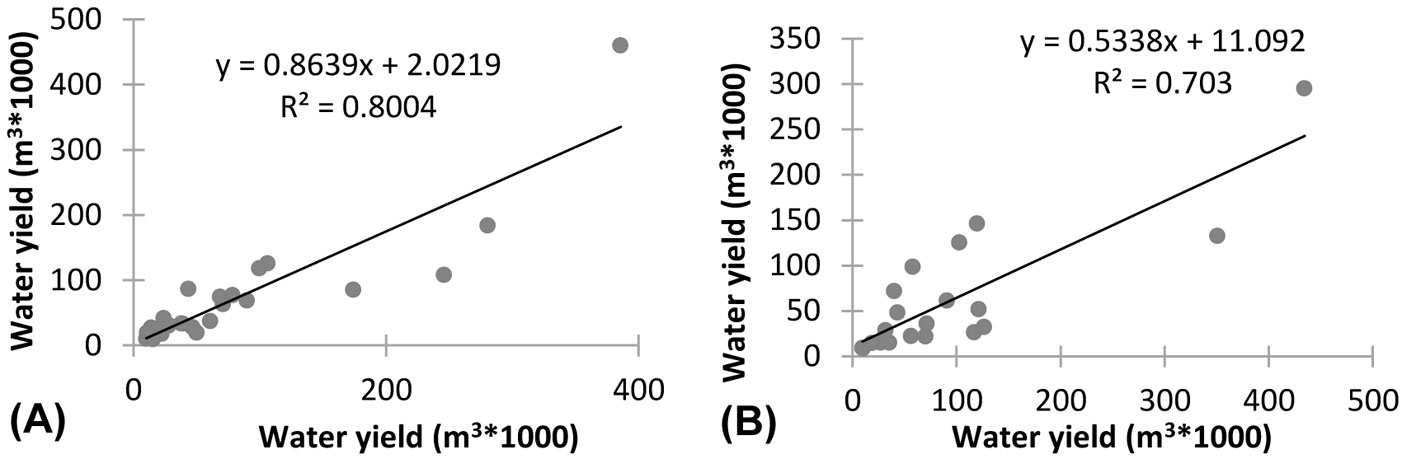
Fig. 6 - Temporal change in estimated mean RC of the sub-watersheds.
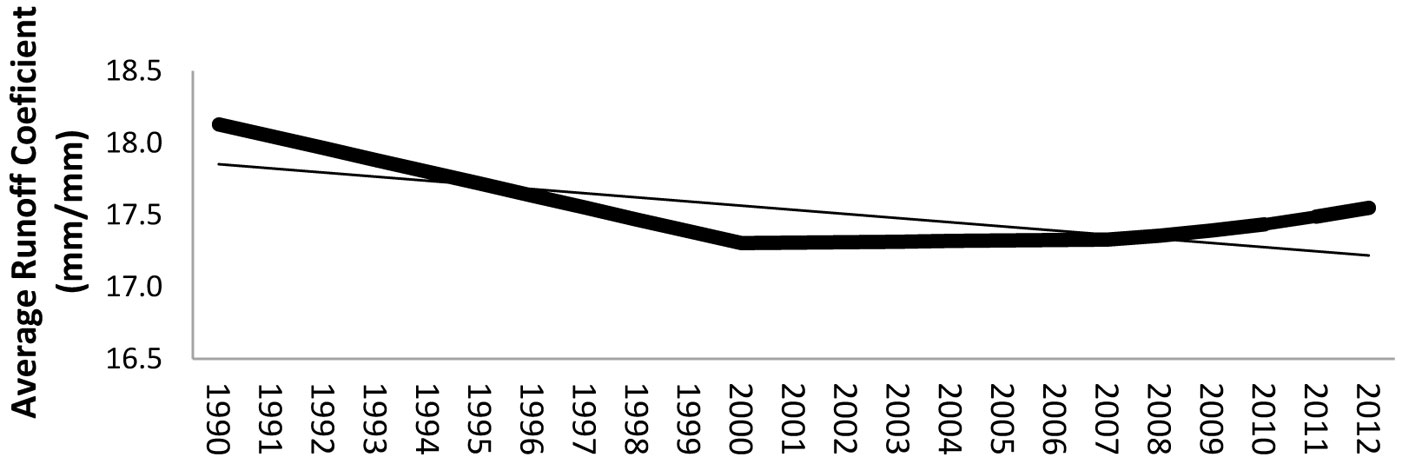
The variation through time of the average RC values obtained as described above were examined using the Mann-Kendall test, but no significant trends were detected (trend = -2.24, mean= 17.5, p>0.05). Significant and contrasting trends in precipitation were detected for only two stations (Tab. 3). Increasing precipitation through time was observed for Kumkoy, located in the north part of the region near the Black sea coast, while a decreasing precipitation trend was found for Edremit, near the Aegean sea coast. Although located in the same region, these two stations are under the influence of different air masses and conditions. The Kumkoy station is on a flat terrain but reflects a typical Black sea climate, which receives the precipitation from north to south direction in winter months. By contrast, the Aegean Sea coast is characterized by a typical Mediterranean climate with high temperatures, high evapotranspiration and soil water deficit in the summer time.
Tab. 3 - Mann-Kendall test results for precipitation.
| Station | Observation dates |
Mean annual precipitation (mm/year) |
Trend (%) | Test results |
Prob |
|---|---|---|---|---|---|
| Edremit | 1932-2012 | 686.2 | -2.54 | Decreasing | 0.03 |
| Kocaeli | 1930-2012 | 663.9 | 0.5 | No increase/decrease | 0.12 |
| Çanakkale | 1930-2012 | 547.8 | -0.12 | No increase/decrease | 0.36 |
| Kumköy (Istanbul) |
1951-2012 | 667.9 | 2.54 | Increasing | 0.03 |
| Kirklareli | 1930-2012 | 479.6 | -1.88 | No increase/decrease | 0.08 |
| Tekirdag | 1931-2012 | 499.4 | 0.15 | No increase/decrease | 0.53 |
| Yalova | 1956-2012 | 621.5 | -0.07 | No increase/decrease | 0.67 |
| Bursa | 1931-2012 | 601.2 | -1.82 | No increase/decrease | 0.08 |
All stations showed increasing trends of mean annual temperature although only Yalova showed a significant increasing trend (Tab. 4). However, a general increase in temperature was not statistically supported at the regional scale. We can argue that the observed significant changes in annual precipitation for the period 1990-2012 may be considered as due to local variations, and not to a general trend at the regional scale. Overall, based on our results, climate change cannot be considered as a factor potentially affecting water resources in the region analyzed.
Tab. 4 - Mann-Kendall test results for temperature.
| Station | Observation dates |
Mean annual temperature (°C) |
Trend (%) |
Test results | Prob |
|---|---|---|---|---|---|
| Edremit | 1959-2012 | 16.4 | 0.46 | No increase/decrease | 0.19 |
| Kocaeli | 1933-2012 | 14.6 | 0.92 | No increase/decrease | 0.23 |
| Çanakkale | 1930-2012 | 14.8 | 1.92 | No increase/decrease | 0.07 |
| Kumköy (Istanbul) |
1951-2012 | 13.8 | 0.11 | No increase/decrease | 0.53 |
| Kirklareli | 1963-2012 | 13.1 | 1.07 | No increase/decrease | 0.18 |
| Tekirdag | 1940-2012 | 13.8 | 0.85 | No increase/decrease | 0.26 |
| Yalova | 1958-2012 | 14.5 | 2.38 | Increasing | 0.04 |
| Bursa | 1930-2012 | 14.1 | 0.61 | No increase/decrease | 0.19 |
Conclusions
Land use change in the fastest urbanizing region of Turkey did not cause a significant change in RC over the period 1990-2012. The conversions among various land uses in the last 30 years did not cause significant effects on RC. The share of settlements was quite low even though it is the most urbanized region of the country. The increase in forest cover and the decrease in rangelands over the study area can be seen as the main reason underlying the observed decrease in RC. Indeed, forest cover is known as causing more evapotranspiration compared to rangelands, but producing at the same time higher quality water.
The hydrologic behaviors of different types of land use are well known, but local practices (afforestation, grazing and cropping techniques, settlement intensity etc) and climatic parameters have a large potential to influence hydrologic parameters. Therefore, local conditions should be taken into account when interpreting the results of changes in land use.
Based on our results, land use changes (especially for forests and rangelands) occurred in the period 1990-2012 did not seem to significantly affect RCs. Hence, we conclude that both land use and climate changes have not played a significant role in affecting the availability of water resources in this region during the past decades.
Acknowledgements
This study was supported by TUBITAK (The Scientific and Technological Research Council of Turkey) Project number: 112Y 096.
References
Gscholar
Gscholar
Gscholar
Gscholar
Gscholar
Gscholar
Authors’ Info
Authors’ Affiliation
Yusuf Serengil
Ibrahim Yurtseven
Faculty of Forestry, Istanbul University, Istanbul (Turkey)
Corresponding author
Paper Info
Citation
Pamukcu P, Serengil Y, Yurtseven I (2014). Role of forest cover, land use change and climate change on water resources in Marmara basin of Turkey. iForest 8: 480-486. - doi: 10.3832/ifor1242-007
Academic Editor
Elena Paoletti
Paper history
Received: Jan 15, 2014
Accepted: Aug 09, 2014
First online: Oct 31, 2014
Publication Date: Aug 02, 2015
Publication Time: 2.77 months
Copyright Information
© SISEF - The Italian Society of Silviculture and Forest Ecology 2014
Open Access
This article is distributed under the terms of the Creative Commons Attribution-Non Commercial 4.0 International (https://creativecommons.org/licenses/by-nc/4.0/), which permits unrestricted use, distribution, and reproduction in any medium, provided you give appropriate credit to the original author(s) and the source, provide a link to the Creative Commons license, and indicate if changes were made.

Web Metrics
Breakdown by View Type
Article Usage
Total Article Views: 56447
(from publication date up to now)
Breakdown by View Type
HTML Page Views: 45183
Abstract Page Views: 3929
PDF Downloads: 5704
Citation/Reference Downloads: 22
XML Downloads: 1609
Web Metrics
Days since publication: 4271
Overall contacts: 56447
Avg. contacts per week: 92.51
Article Citations
Article citations are based on data periodically collected from the Clarivate Web of Science web site
(last update: Mar 2025)
Total number of cites (since 2015): 6
Average cites per year: 0.55
Publication Metrics
by Dimensions ©
Articles citing this article
List of the papers citing this article based on CrossRef Cited-by.
Related Contents
iForest Similar Articles
Research Articles
Reforestation and land use change in a drainage basin of southern Italy
vol. 6, pp. 175-182 (online: 08 May 2013)
Research Articles
The impact of land use on future water balance - A simple approach for analysing climate change effects
vol. 14, pp. 175-185 (online: 13 April 2021)
Technical Reports
The treatment of land use, land use change and forestry in the post-2012 climate agreement: a perspective from non-Annex I Parties
vol. 3, pp. 56-58 (online: 17 May 2010)
Research Articles
An assessment of climate change impacts on the tropical forests of Central America using the Holdridge Life Zone (HLZ) land classification system
vol. 6, pp. 183-189 (online: 08 May 2013)
Research Articles
Seeing, believing, acting: climate change attitudes and adaptation of Hungarian forest managers
vol. 15, pp. 509-518 (online: 14 December 2022)
Research Articles
Web GIS-based simulation of water fluxes in the Miyun catchment area
vol. 7, pp. 363-371 (online: 19 May 2014)
Editorials
Change is in the air: future challenges for applied forest research
vol. 2, pp. 56-58 (online: 18 March 2009)
Research Articles
Potential impacts of regional climate change on site productivity of Larix olgensis plantations in northeast China
vol. 8, pp. 642-651 (online: 02 March 2015)
Research Articles
Slope shape effect on runoff and soil erosion under natural rainfall conditions
vol. 7, pp. 110-114 (online: 18 December 2013)
Research Articles
Land use inventory as framework for environmental accounting: an application in Italy
vol. 5, pp. 204-209 (online: 12 August 2012)
iForest Database Search
Search By Author
Search By Keyword
Google Scholar Search
Citing Articles
Search By Author
Search By Keywords
PubMed Search
Search By Author
Search By Keyword


