Patterns of carbon allocation in a chronosequence of Caragana intermedia plantations in the Qinghai-Tibet Plateau
iForest - Biogeosciences and Forestry, Volume 8, Issue 6, Pages 756-764 (2015)
doi: https://doi.org/10.3832/ifor1193-007
Published: Apr 08, 2015 - Copyright © 2015 SISEF
Research Articles
Abstract
Revegetation is being considered as a mitigation option to improve the ecological environment and reduce the atmospheric carbon (C) dioxide concentrations of regions experiencing desertification. This study assessed the development of the above- and belowground ecosystem C pools in a chronosequence of four Caragana intermedia plantations (3, 12, 27, and 37 years old) in the desertified region of the Qinghai-Tibet Plateau, China. The biomass C stock of the total shrub and under-canopy increased with stand age. The soil inorganic carbon (SIC) pool in the soil C stocks was approximately 3 to 7 times larger than the soil organic carbon (SOC) storage. Both SIC and SOC increased after revegetation. However, the contribution of SIC to the total ecosystem C stock decreased from 87% in the 3-year-old plantation to 85%, 75%, and 72% in the 12-, 27-, and 37-year-old plantations, respectively. The total ecosystem C pool exhibited a greater increase in the shrub plantations than in the mobile dunes, but the total C stock of the stands changed slightly with time. Soil C, including SOC and SIC, was the major contributor to the total ecosystem C stock for all shrub plantations. The aboveground shrub biomass became the secondary ecosystem C pool in older srands. The results of this study indicate that revegetation in desertification ecosystems has a significant impact on SIC, SOC, and total ecosystem C pools. Furthermore, the total ecosystem C pool reached a relatively stable state after sand-binding stands.
Keywords
Biomass Carbon, Shrub Plantation, Soil Organic Carbon, Soil Inorganic Carbon
Introduction
Arid and semi-arid regions cover more than one-third of the surface of the Earth, making these systems the most common types of biomes in the world ([49], [16]). The vegetation and soils in these regions represent approximately 46% of the global terrestrial carbon (C) stock ([64], [26]). Thus, arid and semi-arid ecosystems play an integral role in the response of the global C cycle to climate change ([41], [20], [35]). However, ecosystems in these areas are particularly vulnerable to environmental constraints and human activities ([48], [16]). Previous studies showed that rising temperatures and shifting precipitation patterns associated with climate change will lead to the degeneration of community structures and functions in arid ecosystems ([12], [42]). Elevated atmospheric CO2 concentrations may cause the temperature of arid regions to increase sharply ([53], [38]). Areas affected by desertification have lost two-thirds of their C, mainly through the loss of vegetation and soil organic matter ([22]).
Revegetation is one of the most effective methods for combating desertification and preventing soil C loss in arid and semi-arid regions ([72], [2], [10], [11]). Shrub species are usually selected for revegetation, and they are therefore the dominant vegetation in such regions ([36], [74], [9]). Many studies on the C stock and allocation in shrub ecosystem of arid and semi-arid regions have been conducted on the Mediterranean coast, in Africa, and in Latin America ([14], [62], [10], [51]). Nevertheless, studies on this topic are scarce in China. China possesses 334 000 km2 of desertified or desertification-prone lands, mainly in the north ([15]). Vegetation restoration, including revegetation using sand-binding species in desert regions to reduce the effects of desertification, has been applied to more than 2.4 million ha of degraded land in China ([30], [32], [74], [16]). Given the large distribution area, accurate and reliable estimates of C stock in the desertification regions are important in the development of effective policies and strategies to mitigate climate change.
A number of studies have shown that stand age may have a significant effect on the changes in C stock and allocation among different ecosystem components, such as trees, understory vegetation, forest floor, and mineral soil ([63], [46], [47], [44]). Tree biomass and C stock increase with stand age, and the allocation and growth rate of tree biomass and C pools vary across stands with different ages ([59], [34], [7]). This increasing trend can be described as sigmoidal, as commonly found in other studies ([21]), indicating that young forests grow rapidly up to a certain age and then gradually decrease their production. Most of the existing studies have focused on forest ecosystems, neglecting the importance of chronosequence in the C allocation of shrub plantations in desertified ecosystems. Caragana intermedia, which is highly adaptable to cold, dry, and sandy soils and has the capacity to form nitrogen-fixing nodules with rhizobia, is commonly planted to combat soil degeneration and stabilize sand dunes in the Qinghai-Tibet Plateau ([70], [37]). We hypothesize that as stand age increasing, the C allocation of the C. intermedia ecosystem changes and the aboveground biomass contributes more C.
The objectives of this study were: (1) to quantify the main above- and belowground C pools across a chronosequence of four C. intermedia plantations (3, 12, 27, and 37 years old); and (2) to determine the changes in size and contribution of these C pools with stand age in the shrub plantation ecosystem. Estimating the changes in C stock and allocation among different ecosystem components with time is important to understand the contributions of revegetation to regions experiencing desertification and to the global C cycles. In addition, the contribution of soil inorganic carbon (SIC) to arid ecosystem C storage in China has not been well documented.
Material and methods
Site description
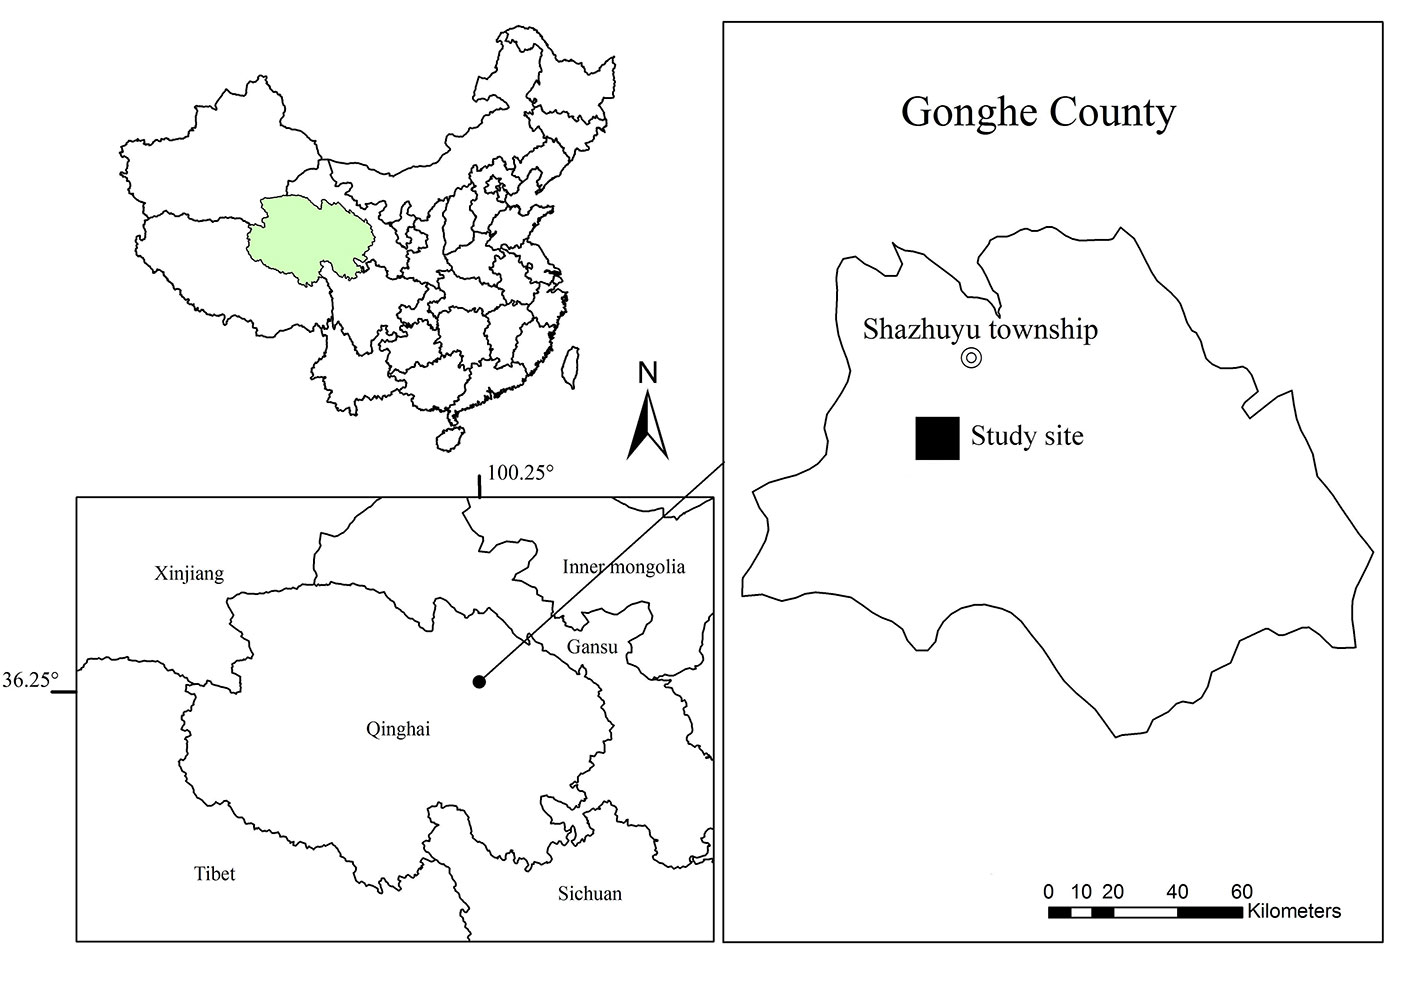
Our investigation was conducted in the Shazhuyu Township (Fig. 1), which is located in Gonghe Basin, Qinghai Province (China), where the mean daily temperature is -10 °C and 15.6 °C in January and July, respectively. The mean annual precipitation is 246.3 mm (approximately 80% of the precipitation falls between May and September), and the annual potential evaporation is 1716.7 mm. Average wind velocity is 2.7 m s-1, and the maximum wind velocity is 40 m s-1. The annual number of days with gale is approximately 30.6 days. Sand soil is contiguously distributed and forms many barchan chains, covering approximately 41 955.7 hm2. In this place, the area of revegetation was approximately 100 hm2 per year.
Fig. 1 - The shrub plantation sampling locations in Shazhuyu township, Qinghai-Tibet Plateau (China).
Study design for plantation inventory
Field measurements and sampling were conducted in July 2012, and consisted of a C. intermedia chronosequence that included 3-, 12-, 27-, and 37-year-old plantations. All 4 stands were established on the original mobile dune area and under similar environmental conditions (Tab. 1). All the stands of different ages are located within an approximately 10-km radius of each other. Three measurement plots (10 × 10 m) were randomly selected in each stand. In each plot, the ground/basal diameter (D), height (H), maximum crown width (Cmax), and minimum crown width (Cmin) of individual shrubs were measured within each plot. During the study, 15 shrubs were randomly selected and harvested with the aim of representing the respective range of D in each stand. Each individual shrub was separated into foliage, fruits, branches (including stem and stalk), and roots. The fresh weight of each part was then measured. Three branches were selected for further sub-sampling to determine fresh and oven-dried biomass ratios, as well as the proportional contributions of foliage, fruits, and roots to the biomass of the sub-samples of different shrub tissues. The tissues were oven dried at 65 °C for 48 h and weighed to determine the ratio of fresh weight to dry biomass.
Tab. 1 - Basic characteristics of the 3-, 12-, 27-, and 37-year-old Caragana intermedia stands.
| Stand age (years) | Elevation (m a.s.l) |
Basic properties of soil | Stand density (shrub hm-2) |
Mean height (cm shrub-1) |
Predominant native plants |
|||||
|---|---|---|---|---|---|---|---|---|---|---|
| Soil type | Bulk density (g·cm-3) |
pH value |
Total N (g· kg-1) |
Available P (mg· kg-1) |
Available K (mg· kg-1) |
|||||
| Mobile dune |
2882 | Sandy soil | 1.52 | 8.78 | 0.09 | 2.9 | 51.2 | none | none | none |
| 3 | 2880 | Sandy soil | 1.60 | 8.72 | 0.15 | 2.9 | 54.6 | 12767 ± 441 | 53.93 ± 0.17 | Corispermum lepidocarpum |
| 12 | 2887 | Sandy soil | 1.56 | 8.55 | 0.33 | 3.1 | 72.7 | 5733 ± 219 | 96.07 ± 1.81 | Poa crymophila Keng |
| 27 | 2873 | Sandy soil | 1.56 | 8.42 | 0.42 | 4.6 | 92.7 | 4367 ± 333 | 133.55 ± 1.52 | Poa crymophila Keng, Potentilla chinensis, Soil crust mosses Nostoc commune |
| 37 | 2881 | Sandy soil | 1.56 | 8.37 | 0.68 | 9.7 | 154.3 | 5033 ± 260 | 137.31 ± 1.85 | Eragrostis pilosa, Poa crymophila Keng, Potentilla chinensis,Soil crust mosses Nostoc commune |
Three microplots (1 × 1 m) were distributed within each plot for under-canopy investigation. In each microplot, all herbs, litter, and biological soil crusts were excavated. The biological soil crusts in the study site mainly comprised soil crust mosses, and only small amount of Nostoc commune were found. The herbs, biological soil crusts, and litter samples were oven dried at 65 °C for 48 h and weighed to determine the ratio of fresh weight to dry biomass. The dominant herb throughout the site was Poa crymophila Keng. We did not separate the herbs into species because of the small number of other species found. The herbs were also not separated into components because of their small root biomass.
C concentrations of all samples (shrubs, and under-canopy) were determined by the potassium dichromate oxidation method in the laboratory ([43]).
The dry biomass data of each shrub component and the aboveground, belowground, and total biomass per ha were calculated by using the age-specific allometric equations reported by Tian et al. ([61]).
Soil sampling
Considering the possible fertile island effect, three replications of both under-canopy soil and inter-canopy soil were sampled in each plantation. Soil samples from mobile dunes were also collected in triplicate. In each soil sampling site, soil samples were taken at depths of 0 to 10 cm, 10 to 20 cm, 20 to 30 cm, 30 to 50 cm, 50 to 70 cm, and 70 to 100 cm. The basic properties of soil are listed in Tab. 1. All soil samples were air-dried and ground to pass through a 2 mm sieve. Soil mineral samples were also collected to obtain the corresponding bulk density of each depth by using a 500 cm3 soil ring, and they were subsequently oven dried at 105 °C to a constant weight. Soil organic carbon (SOC) concentrations were determined using the potassium dichromate oxidation method ([43]), and SIC concentrations were measured by using the pressure-calcimeter method ([52]). The term mineral soil C (SOC or SIC) stock refers to the C storage at a specified depth within a unit area and is calculated as follows (eqn. 1):
where SOC or SIC is the mineral soil organic/inorganic C stock (kg C hm-2), Ci is the C concentration (g kg-1), ρi is the bulk density (g cm-3), hi is the thickness of the soil horizon (cm), and θi is the volumetric percentage of fragments > 2 mm.
Statistical analysis
The statistical analysis of the data and the regression analysis for developing allometric equations were performed by using the SPSS® software package (ver. 18.0, SPSS, USA). The difference between the stand means and within-stand variations were examined by one-way analysis of variance using ANOVA procedures.
Results
Shrub biomass C storage
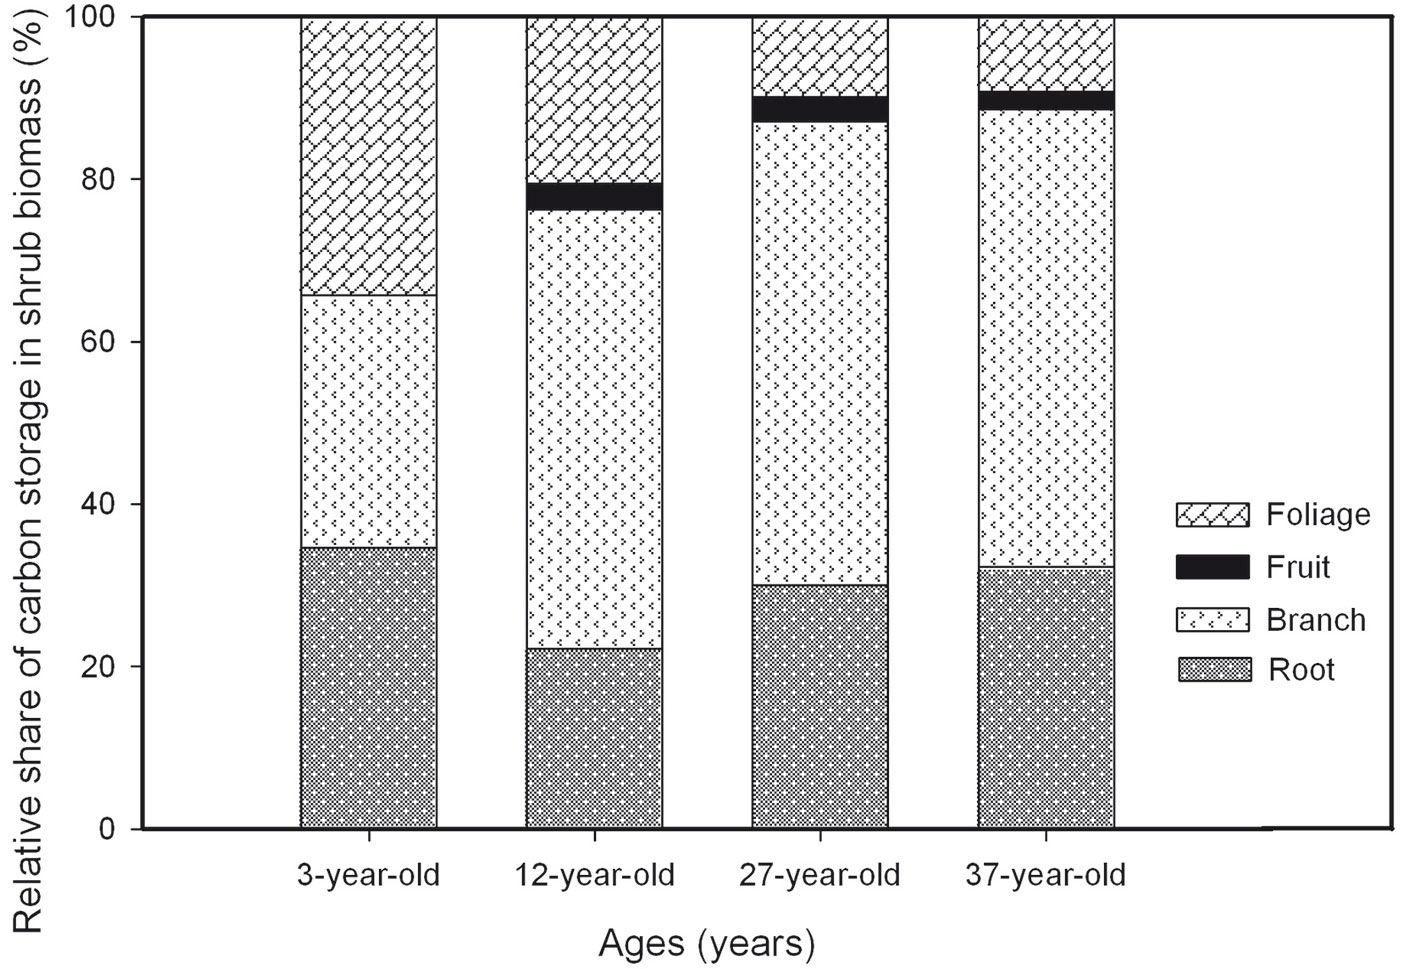
The C concentration of individual shrub components varied from 31.45% to 49.51% (Tab. 2). The lowest C concentration in each plantation except in the 27-year-old one was found in the root. The C concentration in the foliage of the shrubs decreased with plantation age contrary to the changes in the fruit. The relative share of C storage in the shrub biomass at each plantation is shown in Fig. 2. This result indicated the rapid increase of C concentrations from the 12-year-old to the 37-year-old plantation. C storage in the branch biomass represented 31%, 54%, 57%, and 56% of total shrub C in the 3-, 12-, 27-, and 37-year-old plantations, respectively. Except for the 3-year-old plantation, the branches made the largest contribution to the total shrub C storage, followed by the roots. The contribution of foliage to total shrub C storage decreased from 34% in the 3-year-old plantation to 21%, 10%, and 9%, in 12-, 27-, and 37-year-old plantations, respectively. The C storage of the individual components of the shrub plantation in the 37-year-old stand was significantly larger than the C storage of the other stands.
Tab. 2 - Carbon concentration and C stock in shrub and undercanopy in the 3-, 12-, 27-, and 37-year-old Caragana intermedia plantations. (a): Data are presented as the mean value. Mean values of C stock within a row followed by different uppercase letters are significantly different among different stand ages (p < 0.05). Mean values of C concentration within a row followed by different lowercase letters are significantly different among different stand ages (p < 0.05).
| Component | 3-year-old | 12-year-old | 27-year-old | 37-year-old | ||||
|---|---|---|---|---|---|---|---|---|
| C (%) |
C stock (kg C hm-2) |
C (%) |
C stock (kg C hm-2) |
C (%) |
C stock (kg C hm-2) |
C (%) |
C stock (kg C hm-2) |
|
| Total shrub | - | 1997.5 C | - | 1943.6 C | - | 7291.3 B | - | 11864.7 A |
| Aboveground shrub | - | 1305.1 C | - | 1512.3 C | - | 5103.1 B | - | 8037.2 A |
| Foliage | 47.3 a | 685.8 B | 42.0 ab | 399.4 C | 40.1 ab | 719.1 B | 37.5 b | 1093.2 A |
| Fruit | - | - | 40.3 b | 61.9 C | 43.6 ab | 222.3 B | 47.5 a | 257.4 A |
| Branch | 49.5 a | 619.4 C | 41.6 b | 1051.0 C | 48.1 a | 4161.7 B | 45.2 ab | 6686.7 A |
| Root | 38.6 ab | 692.4 C | 35.9 b | 431.4 D | 44.9 a | 2188.3 B | 31.5 b | 3827.5 A |
| Total undercanopy | - | 8.1 C | - | 121.8 C | - | 1437.5 B | - | 2407.7 A |
| Herb | 24.6 ab | 6.7 B | 17.2 b | 46.0 B | 34.3 a | 153.3 B | 28.3 ab | 1399.5 A |
| Nostoc commune | - | - | - | - | 17.6 | 36.7 | 18.5 | 99.5 |
| Soil crust mosses | - | - | - | - | 18.4 | 1214.9 | 8.6 | 838.2 |
| Litter | 11.2 d | 1.3 B | 30.5 a | 75.8 A | 22.3 b | 32.6 AB | 16.6 c | 70.5 A |
Fig. 2 - Relative share of carbon storage in shrub biomass in the 3-, 12-, 27-, and 37-year-old Caragana intermedia plantations.
Under-canopy C storage
Tab. 2 summarizes the under-canopy (herbs, biological soil crusts, and litter) C pools and individual C concentrations. The C concentration of the herbs ranged from 17% in the 12-year-old stand to 34% in the 27-year-old stand. The C stock of the total under-canopy continuously increased with stand age. In the current study, biological soil crusts (soil crust mosses and Nostoc Commune) can be found in 27- and 37-year-old shrub plantations. The C concentration in the N. commune changed little, but it greatly decreased in soil crust mosses, from 18.35% in the 27-year-old plantation to 8.64% in the 37-year-old plantation. The C stored in the soil crust mosses of the 27- and 37-year-old plantations accounted for 85% and 35 %, respectively, of the total under-canopy C pool.
The C concentration of the litter increased from 11% in the 3-year-old plantation to approximately 30% in the 12-year-old plantation and then decreased to 22% and 17% in the 27- and 37-year-old plantations, respectively. The C stock of the litter of the four shrub plantations followed the order of 12- > 37- > 27- > 3-year-old plantation. No significant differences were found among the three older plantations.
Mineral soil C storage
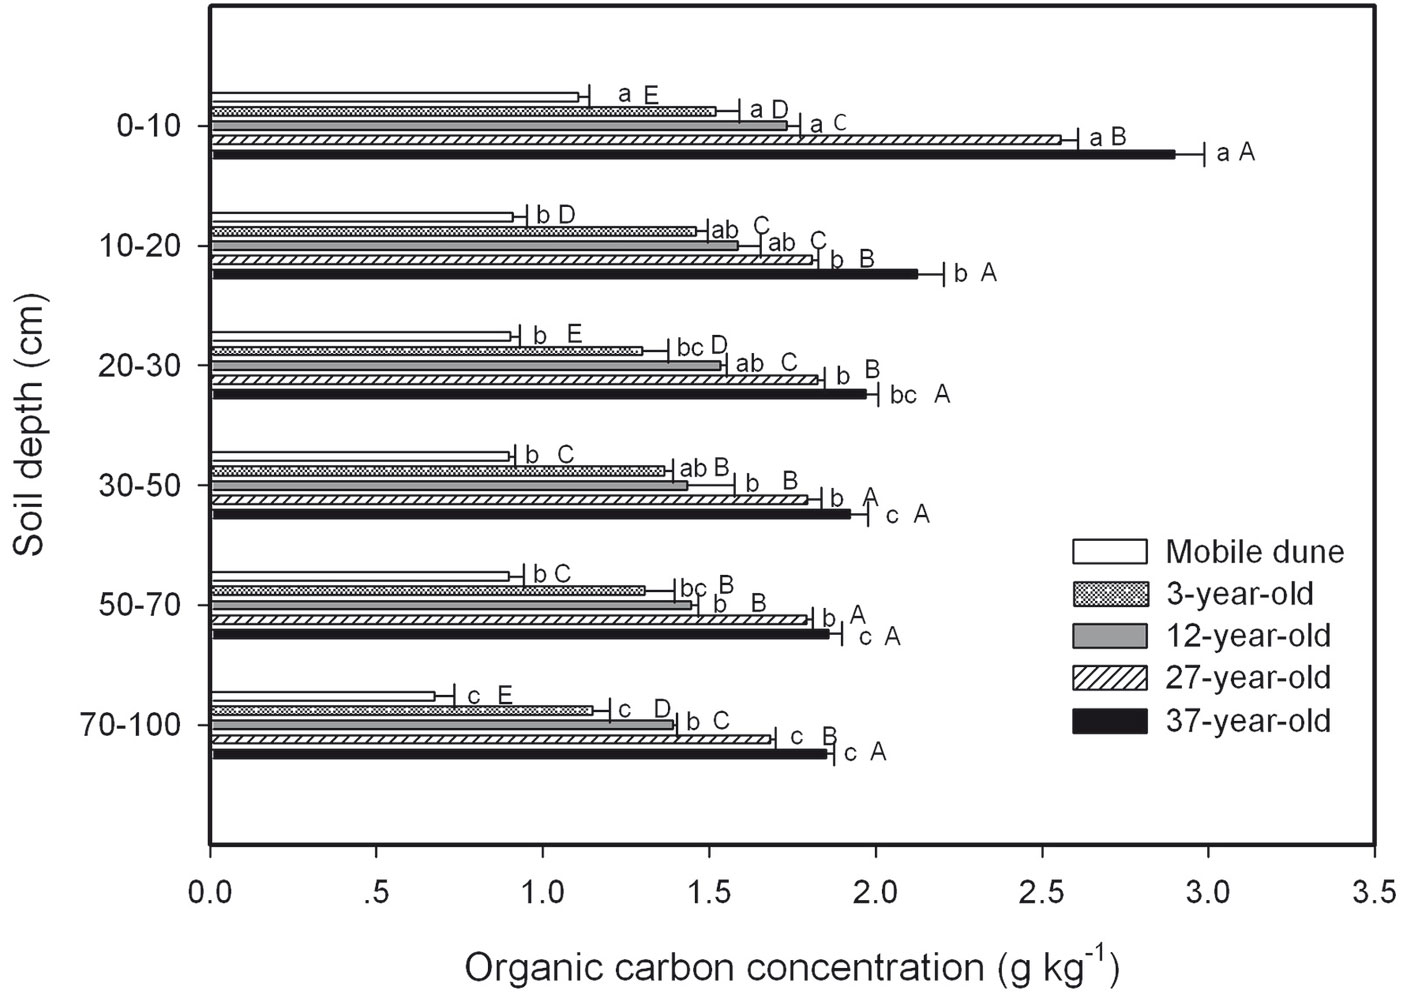
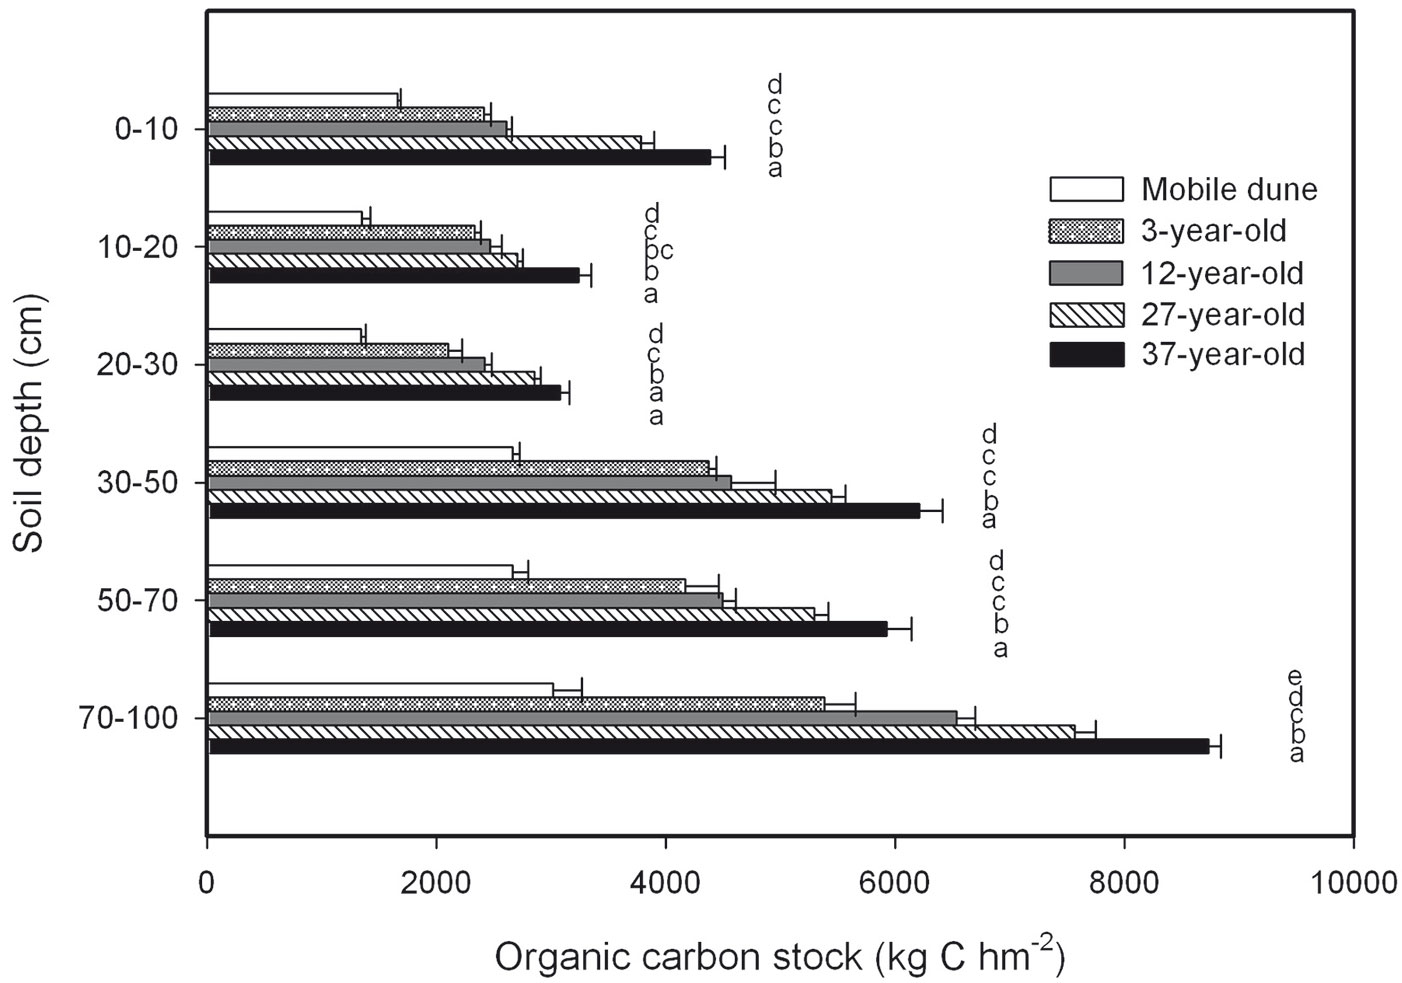
SOC concentration in the mineral soil at various depths for each plantation decreased with increasing soil depth, and it increased with plantation age (Fig. 3). The SOC concentrations in the four shrub plantations were significantly larger than in the mobile dune at the same soil depth. The total SOC stock across the six soil depths was 12 715.8, 20 793.4, 23 111.2, 27 652.9, and 31 584.3 kg C hm-2 in the mobile dune, 3-, 12-, 27-, and 37-year-old plantations, respectively (Fig. 4). The SOC stored in the whole soil profile (0 to 100 cm) in the 37-year-old plantation was approximately 2.5 times larger than the SOC stored in the mobile dune.
Fig. 3 - Soil organic C (SOC) concentration in samples taken at different soil depths in the 3-, 12-, 27-, and 37-year-old Caragana intermedia stands. Different uppercase letters indicate a significant difference between stand ages at the same horizon (p < 0.05), different lowercase letters indicate a significant difference between different soil depths in the same stand (p < 0.05). Error bars represent standard error (SE).
Fig. 4 - Soil organic C (SOC) stock at different soil depths in the 3-, 12-, 27-, and 37-year-old Caragana intermedia stands. Different capital letters indicate a significant difference between different stands at the same horizon (p < 0.05). Error bars: SE.
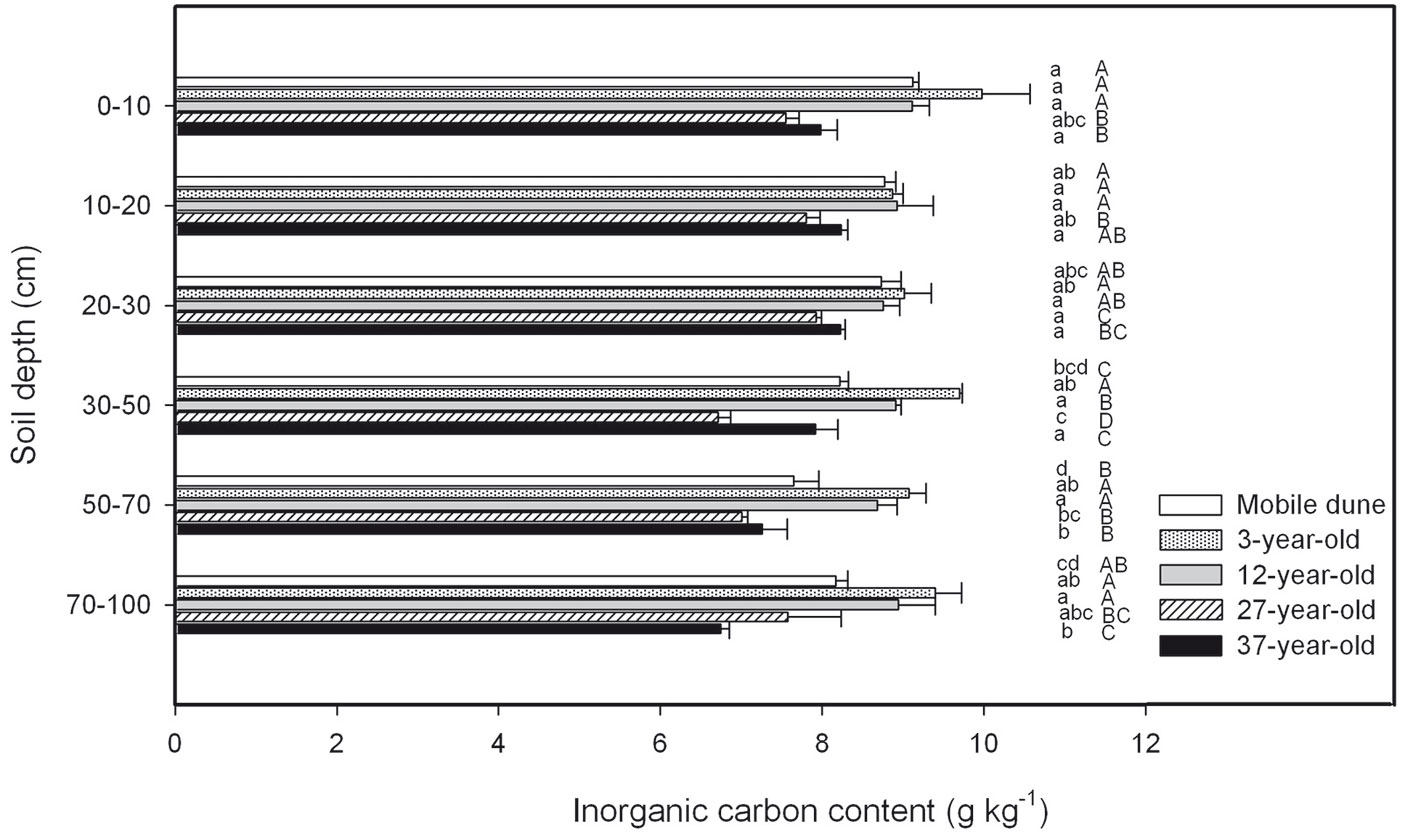
There were no significant differences in SIC concentration in the samples of the soil horizon taken at depths of 0 cm to 10 cm, 10 cm to 20 cm, 20 cm to 30 cm, 30 cm to 50 cm, 50 cm to 70 cm, and 70 cm to 100 cm across the entire chronosequence (Fig. 5). The total SIC stock across the six soil depths was 123.406.7, 148.900.6, 139.074.3, 110.476.9, and 117.978.5 kg C hm-2 in the mobile dune, 3-, 12-, 27-, and 37-year-old plantations, respectively (Fig. 6). The ratio of SIC to SOC in the whole soil profile decreased from 10 in the mobile dune to 7, 6, 4, and 4 in the 3-, 12-, 27-, and 37-year-old plantations, respectively. The contribution of total SIC stock in the total soil C stock (the sum of SIC and SOC) decreased from 91% in mobile dune to 88, 86, 80, and 79% in the 3-, 12-, 27-, and 37-year-old plantations, respectively.
Fig. 5 - Soil inorganic C (SIC) concentration in samples taken at different soil depths in the 3-, 12-, 27-, and 37-year-old Caragana intermedia stands. Different uppercase letters indicate a significant difference between stand ages at the same horizon (p < 0.05), different lowercase letters indicate significant differences between different soil depths in the same stand (p < 0.05). Error bars: SE.
Fig. 6 - Soil inorganic C (SIC) stock at different soil depths in the 3-, 12-, 27-, and 37-year-old Caragana intermedia stands. Different capital letters indicate significant differences between different stands at the same horizon (p < 0.05). Error bars: SE.
Ecosystem C pools
Tab. 3 summarizes the aboveground, belowground, and total ecosystem C stocks for the mobile dune and the four different-aged plantations. The C stocks of the aboveground, belowground, and total ecosystem in the 4 shrub plantations were larger than that in the mobile dune. However, the belowground C stock decreased from 170 386.3 kg C hm-2 in the 3-year-old plantation to 162 616.3 and 140 318.1 kg C hm-2 in the 12- and 27-year-old plantations, respectively, with a slight increase (153 390.3 kg C hm-2) in the 37-year-old plantation. Furthermore, the total ecosystem C stock decreased from 171 699.5 kg C hm-2 in the 3-year-old plantation to 164 250.9 and 146 858.6 kg C hm-2 in the 12- and 27-year-old plantations, respectively, with a slight increase (163 835.3 kg C hm-2) in the 37-year-old plantation.
Tab. 3 - Carbon stock of the aboveground, belowground, and total ecosystem in the mobile dune, 3-, 12-, 27-, and 37-year-old Caragana intermedia plantations (kg C hm-2). Aboveground C pools included the C stored in aboveground shrub and the undercanopy; belowground C pools included the C stored in the shrub root and soil carbon (SOC and SIC). Data are presented as the mean value. Mean values within a row followed by different lowercase letters are significantly different in terms of C stock among different stands at p < 0.05.
| Component | Mobile dune | 3-year-old | 12-year-old | 27-year-old | 37-year-old |
|---|---|---|---|---|---|
| Aboveground | 0 d | 1313.2 c | 1634.0 c | 6540.6 b | 10444.9 a |
| Belowground | 136122.4 c | 170386.3 a | 162616.9 a | 140318.1 c | 153390.3 b |
| Total ecosystem | 136122.4 c | 171699.5 a | 164250.9 a | 146858.6 b | 163835.3 a |
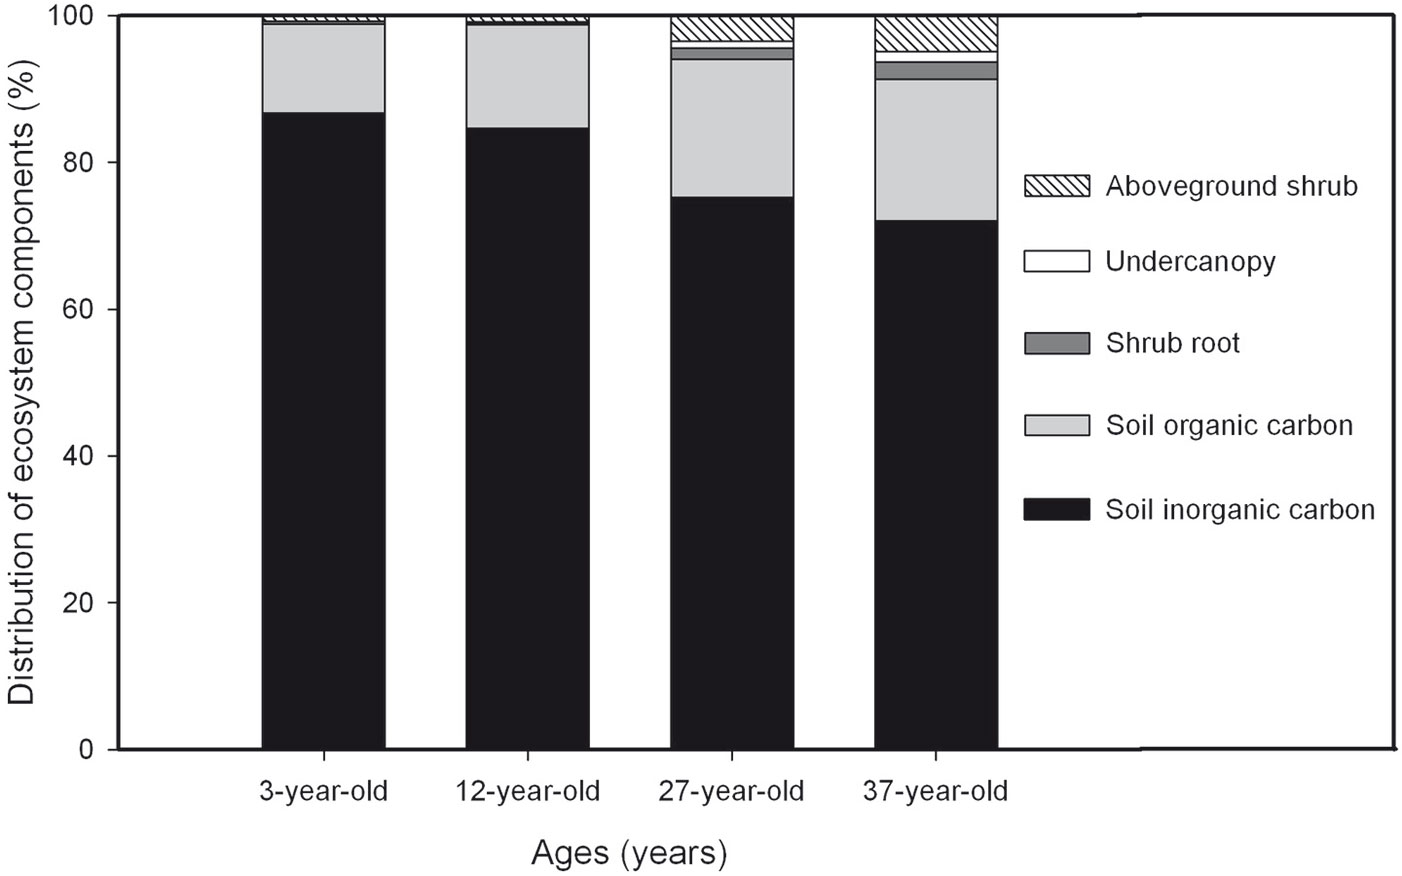
The percentage contribution of the different C pool components within the shrub plantation ecosystem in the 3-, 12-, 27-, and 37-year-old plantations are shown in Fig. 7. Mineral SIC and SOC were the two largest contributors to the total ecosystem C pool in all 4 plantations. SIC was the dominant C pool, accounting for 87% of the total ecosystem in the 3-year-old plantation. However, the contribution of SIC decreased to 85%, 75% and 72% in the 12-, 27-, and 37-year-old plantations, respectively. The contribution of SOC increased with plantation age from 12% in the 3-year-old plantation to 19% in the 37-year-old plantation. The contribution of aboveground shrub biomass C increased from 0.76% in the 3-year-old plantation to 0.92%, 3.47%, and 4.91% in the 12-, 27-, and 37-year-old plantations, respectively. The under-canopy contribution to the total ecosystem C pool increased slightly with plantation age. The contribution of the shrub root decreased from 0.40% in the 3-year-old plantation to 0.26% in the 12-year-old plantation, and then increased to 1.49% and 2.34% in the 27- and 37-year-old plantations, respectively.
Fig. 7 - Percentage contribution of C pool in individual components of the desert ecosystem in 3-, 12-, 27-, and 37-year-old Caragana intermedia stands.
Discussion
Shrub biomass C storage
Goodale & Davidson ([18]) found that woody shrubs are a potentially large but poorly quantified C pool (uncertain pools) that contains large amounts of extra C. In plantations of C. intermedia in the desert of the Qinghai-Tibet Plateau, shrub biomass C stock increased with plantation age. This trend is commonly found in other tree studies ([58], [7]). The results of this chronosequence study suggest that age had a significant effect on shrub allometry and biomass C stock partitioning. The fact that the branches were the largest contributors in the C. intermedia plantations (except for the 3-year-old stand) might be attributed to the physiological characteristics of woody shrubs. The biomass C stock was similar for both 3- and 12-year-old plantations, but it increased by approximately 4 and 6 times in 27-year-old and 37-year-old plantations. These results showed that younger shrub plantations had less biomass C stock than older shrub plantations.
The C concentrations of the vegetation components from the same species may be affected by the analysis, stand age, pedoclimatic conditions, and origin ([5]). Previous studies have found that a constant value of 50% C concentration may result in a significant error; thus, the use of a component-specific C concentration value to estimate the shrub biomass C pool is necessary ([34]). In the current study, the results clearly showed that the predicted C concentration of 50% for the shrub components was generally higher than the observed C concentration in the C. intermedia chronosequence. We found that the C concentration changed significantly in some individual shrub components across four different stand ages. Except for the C concentration of fruit biomass, the C concentrations of other components in the 37-year-old plantation were lower than those in the younger plantations (except for the branch C concentration in the 12-year-old plantation). The C concentrations in the roots had the lowest values compared with the other components (except in the 12-year-old plantation); this evidence was similar to previous results from other tree species ([34], [7]).
Under-canopy C storage
The C stock of the under-canopy increased with shrub plantation age. This trend might be caused by the increased biodiversity, which is related to ecosystem stability, in the sand-binding stands compared with moving dunes ([19], [60], [30]).
Previous studies have found that biological soil crusts can stabilize the topsoil ([69], [55]) and maintain and increase soil nutrients ([73], [4], [56]) while improving SOC accumulation ([31], [65], [55]), serving as a vital C pool in dry land because of the considerable photosynthetic capacities of such crusts ([29]). In the present study, the C concentration in soil crust mosses strongly varied from the 27-year-old plantation to the 37-year-old plantation. These results might be related to the stage of biological soil crusts development, canopy cover, photosynthetic capacity, and water condition ([55], [66]).
In the present study, no pattern was found in the change of litter C pools over time, which is in accordance with previous findings from temperate forest ecosystems ([24], [46], [44], [34]). In contrast, other investigations found that the litter C stock increased with stand age ([50], [8]). Some previous reports have suggested that it is very difficult to detect patterns of change in litter organic matter using suitable sampling techniques due to the high spatial variation ([71], [23], [47], [58]).
Soil carbon
In this study, the SIC stock was approximately three to seven times larger than the SOC stock within the same stand. A similar result was observed in some previous reports ([54], [13], [3], [27]). The increase in SOC stock with stand age might be due to the accumulation of organic matter in old shrub plantations. By contrast, the SIC stock decreased among the three younger plantations, and then increased slightly in the 37-year-old plantation. It has been suggested that most SICs in arid and semi-arid regions in China belong to the pedogenic carbonate class weathering of Ca/Mg-bearing silicates ([45], [17], [68]). Thus, the large SIC storage in shrub plantations may be caused by the transfer process of atmospheric CO2 and soil C, i.e. (eqn. 2, eqn. 3):
([1], [25], [40]). The process of calcrete reservoir weathering consumes 2 mol of atmospheric CO2 for every mol released during the precipitation of pedogenic carbonate ([54]). The SIC content in 3- and 12-year-old plantations was higher than in the mobile dune; this result might be due to the artificial disturbance and the high holding capacity of shrub root systems for water from rainfall and groundwater (contain CaCO3 - [57], [52], [74], [68]). By contrast, the SIC content in 27- and 37-year-old plantations were less than that in the mobile dune; this might be caused by the transformation of considerable SOC from SIC. This result was also the reason for the decrease in the SIC to SOC ratio with plantation age. Although it is possible for the SOC to transform into SIC by the effect of temperature on the micro-carbon cycle system “SOC-CO2-CaCO3” as SOC-CO2 (g)-CO2(aq)-HCO3-(aq)-CaCO3(s) ([45], [18], [28], [33]), the opposite process dominated the soil of this arid region after the revegetation.
Ecosystem C pools
Previous studies indicated that as the global climate becomes warmer, most types of soil are likely to become net sources of atmospheric CO2, because higher soil temperatures correspond to higher decomposition rates ([6]). However, revegetation may reduce those C loss and even increase the ecosystem C sequestration ([53], [67], [46], [8]). In the present study, the total ecosystem C stock in each of the four C. intermedia plantations was much higher than in the mobile dunes, indicating that the C. intermedia plantation has a considerable C sequestration ability. However, the total C stocks of the four aged stands changed slightly. Within the shrub plantation ecosystem, the aboveground C stock increased with stand age, whereas the belowground C stock decreased. The belowground C was the largest contributor to the total site C pool for each of the four stands. In contrast, some previous studies reported that the aboveground biomass C gradually becomes the largest contributor with stand age in the temperate forests ([46], [7]). Martin et al. ([39]) found that the aboveground biomass C was always the largest contributor and the belowground C varied slightly in their chronosequence study of boreal mixedwood forest. These contradictory results might be due to differences in the rates of above- and belowground C accumulation among plant species with stand age. In the present study, the contribution of the biomass C pool increased with stand age, however, but the C accumulation ability of C. intermedia was limited.
Conclusions
This study showed that C. intermedia chronosequence plantations have great potential to fix C. The total shrub biomass C, under-canopy biomass C and SOC increased with stand age, whereas the underground C stock declined. The SIC and SOC were two major contributors to the total site C pool for all stand ages, but the total soil C slightly changed after revegetation because of the transfer of SOC-CO2-SIC. The information provided by this study will improve our understanding of C stock and the dynamic in C. intermedia chronosequence plantations. Furthermore, the results can be used in the C budget management of desertified ecosystems.
Acknowledgments
This study was supported by the fundamental research funds for the central universities (NO.BLX2014-14), the grant under the national natural science fund (41130640) and (41271033) from National Natural Science Foundation of China, and forestry public welfare industry research (201204203) from State Forestry Bureau, P. R. China.
References
Gscholar
Gscholar
Gscholar
Gscholar
Gscholar
Gscholar
Gscholar
Gscholar
Gscholar
Authors’ Info
Authors’ Affiliation
Faculty of Soil and Water Conservation, Beijing Forestry University, 100083 Beijing (China)
Xiaohui Yang
Nan Shan
Zhongjie Shi
Institute of Desertification Studies, Chinese Academy of Forestry, 100091 Beijing (China)
Key Laboratory of Forest Ecology and Environment, State Forestry Administration of China, Research Institute of Forest Ecology, Environment and Protection, Chinese Academy of Forestry, 100091 Beijing (China)
Corresponding author
Paper Info
Citation
Tian Y, Cao J, Yang X, Shan N, Shi Z (2015). Patterns of carbon allocation in a chronosequence of Caragana intermedia plantations in the Qinghai-Tibet Plateau. iForest 8: 756-764. - doi: 10.3832/ifor1193-007
Academic Editor
Giorgio Matteucci
Paper history
Received: Dec 02, 2013
Accepted: Dec 11, 2014
First online: Apr 08, 2015
Publication Date: Dec 01, 2015
Publication Time: 3.93 months
Copyright Information
© SISEF - The Italian Society of Silviculture and Forest Ecology 2015
Open Access
This article is distributed under the terms of the Creative Commons Attribution-Non Commercial 4.0 International (https://creativecommons.org/licenses/by-nc/4.0/), which permits unrestricted use, distribution, and reproduction in any medium, provided you give appropriate credit to the original author(s) and the source, provide a link to the Creative Commons license, and indicate if changes were made.
Web Metrics
Breakdown by View Type
Article Usage
Total Article Views: 54222
(from publication date up to now)
Breakdown by View Type
HTML Page Views: 45095
Abstract Page Views: 3639
PDF Downloads: 4112
Citation/Reference Downloads: 20
XML Downloads: 1356
Web Metrics
Days since publication: 3903
Overall contacts: 54222
Avg. contacts per week: 97.25
Article Citations
Article citations are based on data periodically collected from the Clarivate Web of Science web site
(last update: Mar 2025)
Total number of cites (since 2015): 4
Average cites per year: 0.36
Publication Metrics
by Dimensions ©
Articles citing this article
List of the papers citing this article based on CrossRef Cited-by.
Related Contents
iForest Similar Articles
Research Articles
Soil stoichiometry modulates effects of shrub encroachment on soil carbon concentration and stock in a subalpine grassland
vol. 13, pp. 65-72 (online: 07 February 2020)
Research Articles
Estimating changes in soil organic carbon storage due to land use changes using a modified calculation method
vol. 8, pp. 45-52 (online: 17 June 2014)
Research Articles
Soil C:N stoichiometry controls carbon sink partitioning between above-ground tree biomass and soil organic matter in high fertility forests
vol. 8, pp. 195-206 (online: 26 August 2014)
Research Articles
Potential relationships of selected abiotic variables, chemical elements and stand characteristics with soil organic carbon in spruce and beech stands
vol. 14, pp. 320-328 (online: 09 July 2021)
Research Articles
The effect of clear-cut age on soil organic carbon and nitrogen indices in Scots pine (Pinus sylvestris L.) stands
vol. 18, pp. 146-153 (online: 09 June 2025)
Research Articles
Effects of tree species, stand age and land-use change on soil carbon and nitrogen stock rates in northwestern Turkey
vol. 9, pp. 165-170 (online: 18 June 2015)
Research Articles
Carbon storage and soil property changes following afforestation in mountain ecosystems of the Western Rhodopes, Bulgaria
vol. 9, pp. 626-634 (online: 06 May 2016)
Research Articles
Carbon storage in degraded cork oak (Quercus suber) forests on flat lowlands in Morocco
vol. 9, pp. 125-137 (online: 08 August 2015)
Research Articles
Effects of traditional forest management on carbon storage in a Mediterranean holm oak (Quercus ilex L.) coppice
vol. 11, pp. 344-351 (online: 18 April 2018)
Research Articles
Dynamics of soil organic carbon (SOC) content in stands of Norway spruce (Picea abies) in central Europe
vol. 11, pp. 734-742 (online: 06 November 2018)
iForest Database Search
Search By Author
Search By Keyword
Google Scholar Search
Citing Articles
Search By Author
Search By Keywords
PubMed Search
Search By Author
Search By Keyword

