
A fast screening approach for genetic tolerance to air pollution in Scots pine field tests
iForest - Biogeosciences and Forestry, Volume 6, Issue 5, Pages 262-267 (2013)
doi: https://doi.org/10.3832/ifor0701-006
Published: Jul 01, 2013 - Copyright © 2013 SISEF
Research Articles
Collection/Special Issue: IUFRO 7.01.00 - COST Action FP0903, Kaunas (Lithuania - 2012)
Biological Reactions of Forest to Climate Change and Air Pollution
Guest Editors: Elena Paoletti, Andrzej Bytnerowicz, Algirdas Augustaitis
Abstract
This study aims to develop a screening approach for genetic tolerance to industrial pollution in Scots pine. The relationship between temporal variation in strength of genetic control on radial increment of seed orchard clones affected by air pollution and past pollutant emissions from a nitrogen fertilizer plant in central Lithuania was assessed. The annual radial increment was measured from increment cores. High present-day defoliation was associated to low radial increment during intensive pollution period in the years 1992 - 1995 when high defoliation was recorded in the stands. There was a tendency for a stronger genetic control of radial increment during the years of high defoliation. The clones representing the extremes of high and low radial increments during the stress period of 1992 - 1995 were selected for further tolerance testing based on needle anatomy traits.
Keywords
Defoliation, Heritability, Pinus sylvestris, Radial Increment
Introduction
Climatic chamber testing is the most efficient approach to identify pollution tolerant genotypes (e.g., [23]). However, limited space and high costs of maintaining the indoor tests allow testing a restricted number of genetic entries. A prescreening for tolerance under natural conditions could raise the efficiency of the indoor tests by pre-identifying the tolerant and non-tolerant genotypes. Genetic field tests affected by air pollution could provide additional information on the genetic variation in the traits connected to air pollution tolerance. In our study, we benefited from a genetic test (clonal seed orchard) established nearby a nitrogen fertilizer plant and markedly affected by its emissions mainly during a major accident in the fertilizer plant ([4]).
Being an issue of high public concern, a large number of studies on the effects of pollution to tree growth and tolerance mechanisms were carried out (e.g., [9], [11], [34], [19], [16]). Though the genetic tolerance experiments are less abundant, there is a strong indication of a genetic component in the pollution stress tolerance ([7], [18], [30]). Several independent studies reported a positive relationship between the genetic polymorphism of trees and their tolerance to air pollution ([14], [25], [30]). There was a significant Scots pine provenance variation in tolerance to air pollution in the vicinity of a nitrogen fertilizer plant in Poland ([25]). Radial increment together with crown defoliation proved to be appropriate indicators of pollution tolerance in Scots pine genetic field tests ([25]). Prus-Glowacki & Nowak-Bzowy ([29]) reported differences in allele and genotype frequencies between pollution tolerant and non-tolerant naturally regenerating trees of Scots pine.
The Jonava (JV) nitrogen fertilizer plant was established in 1965 in central Lithuania and it has been the major source of pollution and stress to the surrounding stands by emitting high levels of SO2, NOx, NH3 and other toxic compounds ([3]). Emissions varied from 35 t y-1 at the beginning to 15 t d-1 in the mid 90s to 5 t d-1 at present ([3]). Effects on growth of the surrounding forest stands were well studied (e.g., [1], [2], [19]). Based on the defoliation monitoring, the following major stages of growth of Scots pine in response to pollution were identified ([3]): (I) stage “worsening”, with high emissions and increasing defoliation (1985 to 1992); (II) stage “stabilization”, lower emissions and high defoliation levels (1992 to 1995); and (III) stage “improvement”, low emissions and decreasing defoliation ([16]). The defoliation is identified as a good indicator of tolerance to air pollution in Scots pine ([3]). In 1989, an accidental explosion in the nitrogen fertilizer plant occurred causing a major accident and ecological calamity in the region.
The objective of our study was to develop a screening approach for genetic tolerance to industrial pollution in Scots pine. We assessed the relationship between the temporal variation in strength of genetic control of radial increment of the seed orchard clones and past pollutant emissions. The genetic relationship between past radial increment and present-day defoliation as well as tree diameter of the seed orchard clones was also investigated.
Materials and methods
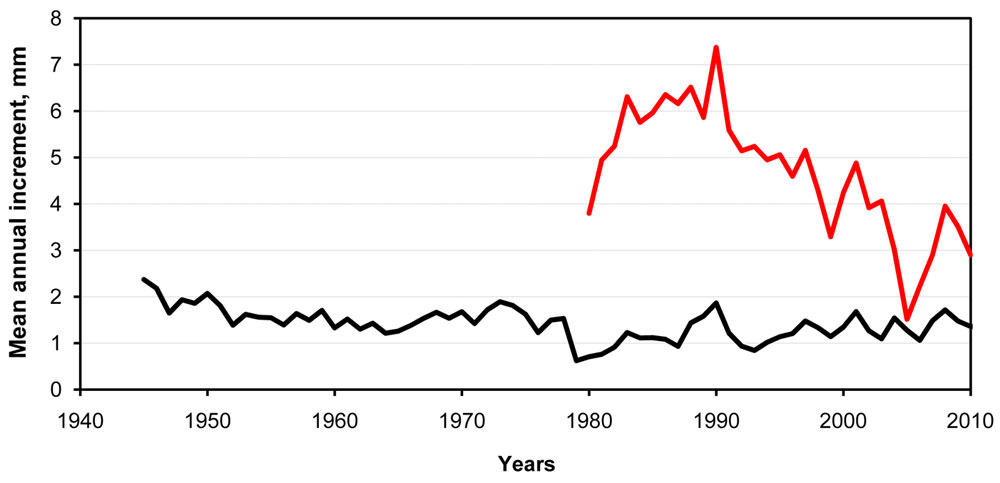
The clonal seed orchard was located 12 km north-eastwards from the JV nitrogen fertilizer plant in central Lithuania (latitude 55° 06’, longitude 24° 26’, elevation 77 m a.s.l.). It consisted of 28 clones with 20 ramets each and was established in 1972 with local genetic material. The origin of the root stocks is unknown. The spacing between the clones was 8 x 8 meters. The design of the orchard was 28 tree blocks containing one individual of each clone arranged in sequential order with five clones within each row. The seed orchard was not thinned. In 2011, increment cores were sampled from each ramet of the 28 clones. At the same time, the following traits reflecting present-day health and genetic differences among the clones were assessed: tree diameter (breast height), defoliation (scale based on percentage of affected crown, high value means low defoliation) and budburst phenology (4-score scale depending on the shoot length). The increment cores were sampled at 130 cm a.g.l. to avoid sampling the rootstock. The annual radial increment was measured by the LINTAB equipment. The LINTAB software was used to attribute annual increments to certain years by comparing the temporal variation of the mean radial increment of the seed orchard clones with that of trees from the surrounding stands estimated in earlier studies ([4], [16] - Fig. 1).
Fig. 1 - Annual radial increment of the seed orchard clones (red line, measured in this study) and mean of several forest stands (= 1000 trees) surrounding the Jonava nitrogen plant (measured in earlier studies).
The genetic association between the present-day crown defoliation and the annual radial increments during 1981 to 2010 was used as an indirect estimate of the pollution tolerance, assuming that, as a consequence of the pollution stress, the clones with high present-day defoliation also exhibited low radial increment during the years of high harmful emissions ([25], [10], [4]). The strength of genetic control on the radial increment in response to variable levels of harmful emissions was also used as an indirect estimate of the pollution tolerance.
The variance component analysis at individual tree level was used to estimate the effects of clone (the genetic effect) and replication for the present-day measurements as well as for each annual radial increment by the following model (PROC MIXED of the SAS statistical package, [32] - eqn. 1):
where Yijk is an individual observation, Ci is the random clonal effect, reflecting the genetic variation component, Rk is the fixed replication effect and Eijk is the random error.
To assess the strength of genetic control, the broad-sense heritability was calculated as (eqn. 2):
where Var(C) is the clonal variance component, and Var(Total) is the total variance.
The standard error for heritability was calculated as follows (eqn. 3):
where SEVar(C) is the standard error for the clonal variance component, Var(C) is the clonal variance component, Var(Error) is the variance component for error.
PROC MIXED in SAS was also used to predict the clonal breeding values with the REML method to be further used for calculating the genetic correlation coefficients.
To assess the magnitude of genetic variation, the coefficient of genetic variation (CVg) was calculated as follows (eqn. 4):
where Var(C) is the clonal variance component, and Mean is the mean of a corresponding trait.
The genetic correlations were calculated as correlations among the breeding values obtained from the variance component analysis (PROC MIXED) with the PROC CORR in SAS.
Results and discussion
The annual radial increment of the seed orchard clones corresponded well to the increment of the surrounding stands, as assessed from our earlier studies ([4], [16]). Therefore, the annual radial increment of the seed orchard clones was reliably attributed to particular years (Fig. 1). Owing to the wide spacing among the ramets of the clones (8 x 8 m) and the genetic value of the clones selected for faster growth, the annual radial increment of the clones was markedly greater than that of the surrounding stands (Fig. 1). The survival was different among the clones (not shown). Only the clones with more than 5 ramets were taken for further analyses. This differential survival of the clones in our study may indicate loss of the pollution-susceptible genotypes and confirms the findings on reduced genetic diversity of the forest stands in the air-polluted areas ([15], [6], [36]).
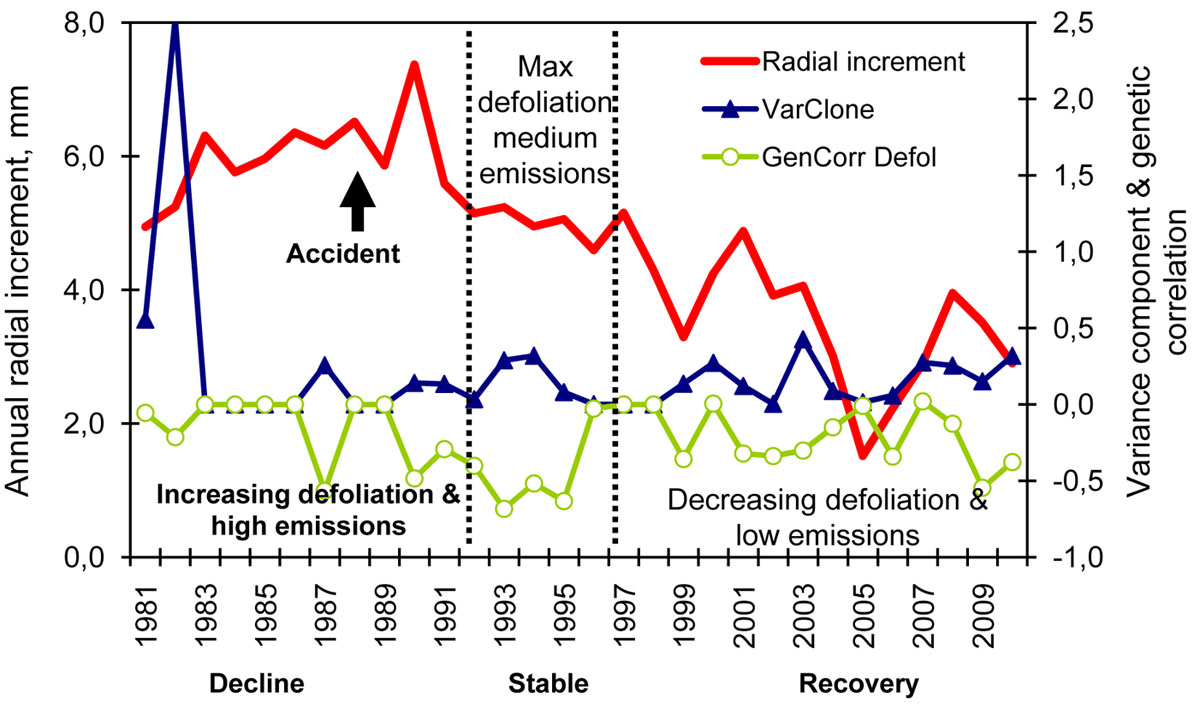
Interestingly, the radial increment of the seed orchard clones peaked in 1990, which is the year after the explosion in the nitrogen fertilizer plant (Fig. 2). Probably, the large quantity of released nitrogen acted as a fertilizer promoting the tree growth ([17]). From the present-day variables, the genetic variance component varied between 0 and 18 % of the total variance and the broad sense heritability (H2) was the highest for the defoliation score (H2 = 0.18) followed by the tree diameter (H2 = 0.14 - Tab. 1). This indicates that the tolerance to an external stress reflected by the defoliation has a stronger genetic component than the other traits measured in this seed orchard. The heritability for tree diameter was within the range usually obtained for wood yield traits in Scots pine ([13], [27]). The genetic variance component and the heritability for budburst phenology were close to 0 (therefore, budburst was not used in further analyses). This is surprising, because budburst phenology represents an adaptive trait in temperate conifers ([12]). A possible explanation is that the clones represented a narrow geographical range where the trees were adapted to similar phenology timing exhibiting little variation in this trait.
Fig. 2 - Variation in annual radial increment of seed orchard clones over time and its association with the pollution rate, the strength of genetic control, the variance component for clone (VarClone) and genetic correlation with the defoliation in 2011 (GenCorr Defol). Radial increment is plotted on the left axis (in mm). VarClone and GenCorr Defol are plotted on the right axis. The pollution rate and its effect on radial increment of the surrounding stands are indicated below X axis. (Decline): high pollution rate and decline of growth, (Stable): lowering pollution rates; growth became stable but highest defoliation was recorded in the surrounding stands; (Recovery): improved growth.
Tab. 1 - The genetic parameters reflecting the strength and variation of the genetic component of the present-day variables assessed in the seed orchard. Var(C) and Var(E) are the variance components for clone and error, respectively. The variance component for clone represents the genetic variance and is given in % of the total variance as well as in the original units of measurement. (H2): broad sense heritability; (SE): standard error.
| Variable | Var(C) | Var(C) % | SE Var(C) |
Var(E) | H 2 | SE H2 |
|---|---|---|---|---|---|---|
| Tree diameter (breast height), cm | 339.6 | 13.5 | 208.4 | 2168.7 | 0.14 | 0.08 |
| Crown defoliation score | 6.4 | 17.6 | 3.6 | 30 | 0.18 | 0.1 |
| Budburst score | 0.1 | 2.7 | 0.1 | 2.3 | 0.03 | 0.05 |
During the orchard’s ontogeny, the clonal variance component for the annual radial increment varied markedly from 0 to 35 % of the total variance (Tab. 2), the latter value being comparably high ([8]). For the annual radial increment, there was a strong association between the temporal variation in heritability and the coefficient of genetic variance (Tab. 2), indicating pronounced variation in both strength and magnitude of the genetic control (presumably enhanced by a variable degree of the pollution tolerance among the clones).
Tab. 2 - The genetic parameters for the annual radial increment calculated separately for each year. Abbreviations are as in Tab. 1. (Cvg): coefficient of genetic variation. (SE): standard error.
| Year | Var(C) | Var(C) % | SE Var(C) | Var(E) | H 2 | SE H2 |
CVg |
|---|---|---|---|---|---|---|---|
| 1981 | 0.56 | 10.5 | 1.12 | 4.75 | 0.1 | 0.21 | 10.43 |
| 1982 | 2.53 | 34.5 | 1.93 | 4.8 | 0.34 | 0.26 | 43.68 |
| 1983 | 0 | 0 | - | 6.84 | 0 | - | 0 |
| 1984 | 0 | 0 | - | 3.64 | 0 | - | 0 |
| 1985 | 0 | 0 | - | 5.14 | 0 | - | 0 |
| 1986 | 0 | 0 | - | 5.52 | 0 | - | 0 |
| 1987 | 0.26 | 3.7 | 0.5 | 6.76 | 0.04 | 0.07 | 4.25 |
| 1988 | 0 | 0 | - | 7.49 | 0 | - | 0 |
| 1989 | 0 | 0 | - | 7.76 | 0 | - | 0 |
| 1990 | 0.14 | 2.6 | 0.26 | 5.26 | 0.03 | 0.05 | 2.12 |
| 1991 | 0.13 | 2.6 | 0.25 | 5.08 | 0.03 | 0.05 | 2.39 |
| 1992 | 0.03 | 0.8 | 0.19 | 4.32 | 0.01 | 0.04 | 0.65 |
| 1993 | 0.29 | 8.2 | 0.27 | 3.23 | 0.08 | 0.08 | 5.74 |
| 1994 | 0.32 | 9.1 | 0.26 | 3.19 | 0.09 | 0.07 | 6.41 |
| 1995 | 0.08 | 2.5 | 0.15 | 3.15 | 0.02 | 0.05 | 1.63 |
| 1996 | 0 | 0 | 0.15 | 3.61 | 0 | 0.04 | 0.04 |
| 1997 | 0 | 0 | - | 4.34 | 0 | - | 0 |
| 1998 | 0 | 0 | - | 3.06 | 0 | - | 0 |
| 1999 | 0.14 | 4.2 | 0.22 | 3.08 | 0.04 | 0.07 | 3.77 |
| 2000 | 0.27 | 7.5 | 0.29 | 3.36 | 0.08 | 0.08 | 6.39 |
| 2001 | 0.12 | 3.7 | 0.18 | 3.18 | 0.04 | 0.05 | 2.6 |
| 2002 | 0 | 0.1 | 0.12 | 2.73 | 0 | 0.04 | 0.1 |
| 2003 | 0.43 | 16 | 0.26 | 2.24 | 0.16 | 0.1 | 10.98 |
| 2004 | 0.09 | 3 | 0.15 | 2.82 | 0.03 | 0.05 | 3.01 |
| 2005 | 0.01 | 1.1 | 0.06 | 1.24 | 0.01 | 0.05 | 0.89 |
| 2006 | 0.06 | 3.6 | 0.08 | 1.55 | 0.04 | 0.05 | 2.51 |
| 2007 | 0.27 | 10.5 | 0.21 | 2.35 | 0.1 | 0.08 | 9.3 |
| 2008 | 0.25 | 7.5 | 0.21 | 3.12 | 0.08 | 0.06 | 6.59 |
| 2009 | 0.15 | 6.3 | 0.15 | 2.24 | 0.06 | 0.06 | 4.42 |
| 2010 | 0.32 | 14.4 | 0.2 | 1.89 | 0.14 | 0.09 | 11.43 |
For the annual radial increment, the heritability (H2) values varied between 0 and 0.16 and peaked periodically each fourth year approximately (Fig. 2). In addition, (a) in 1990 (the year after the major accident in JV plant), the H2 slightly increased simultaneously with a marked increase in the radial increment; at the same time, the genetic correlation between the defoliation in 2010 and the radial increment in 1990 increased to r = -0.5 (significant); (b) during 1992-1995 when the highest defoliation in the surrounding stands was recorded ([3]), the H2 increased markedly; the genetic correlations between present-day defoliation and annual radial increment in 1993, 1994, 1995 became relatively stronger (r = -0.6; Fig. 2). Similar patterns as with H2 were obtained with CVg (not shown). The genetic correlations between tree diameter in 2010 and radial increments in 1993, 1994, 1995 also increased during the 1993-1994 period (Fig. 3). These findings indicate that, during the years of high defoliation caused to the pollution stress, the genetic control of radial increment was relatively stronger and there was a stronger connection with the present-day vitality of the clones as reflected by the defoliation. This suggests a genetic variation in the degree of pollution tolerance among the clones.
Fig. 3 - Variation in the annual radial increment (left axis in mm) and its genetic correlation to present-day diameter (right axis, genetic correlation coefficients).
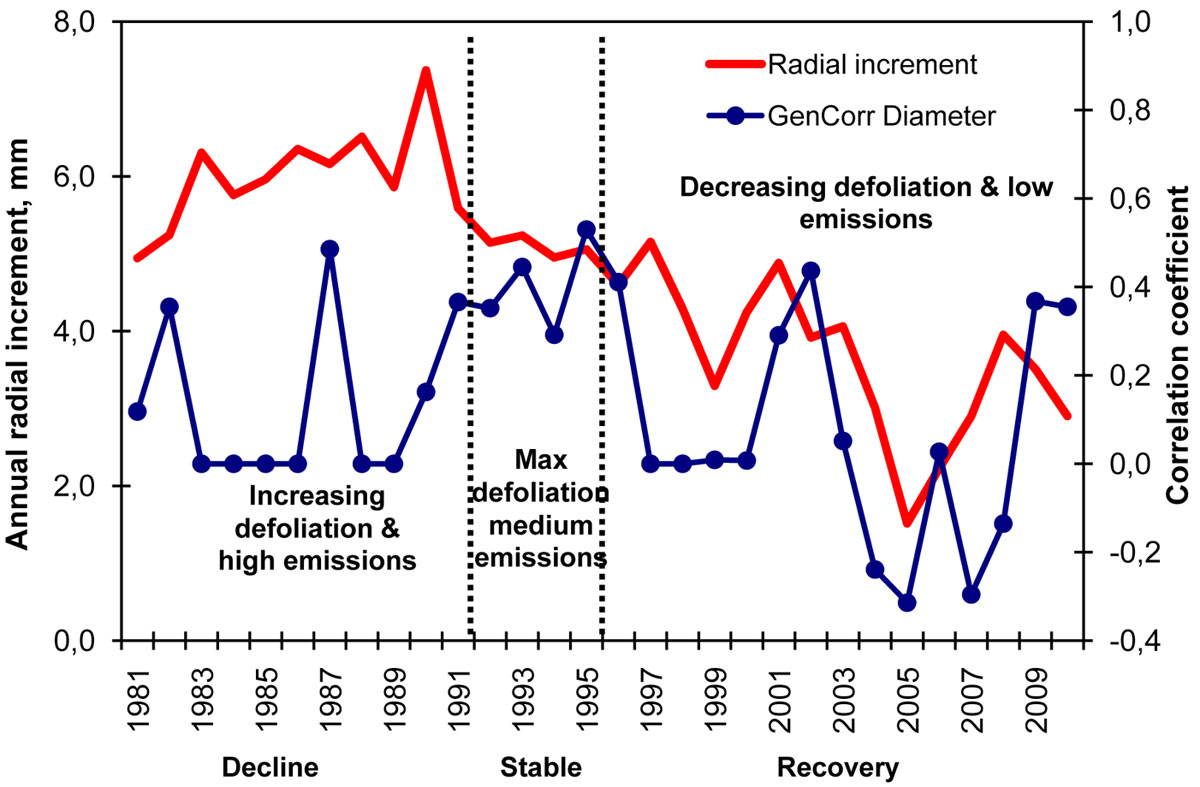
The genetic correlation coefficients between present-day tree diameter and annual radial increments in the past increased periodically, but the most stable increase for 7 years in a row immediately after the major accident in the timespan 1990-1996, when the maximum defoliation levels were recorded in the surrounding stands (Fig. 3). Presumably, the clones being affected by the air pollution stress exhibited a relatively stronger genetic control on their radial increment. These correlations between increments and total tree diameter in 2010 also indicate which years contributed more to the genetic differences in the present-day tree yield. The relatively stronger connections between present-day diameter and annual increments during the stress period suggest that not only the growth vigor but also the tolerance to stress contributed to the present-day wood yield and quality of the clones in the seed orchard. In agreement with our findings, several studies on Scots pine reported genetic associations between growth rate and air pollution tolerance ([24], [25], [30]). Furthermore, if heritability for pollution tolerance in pines is greater than for growth rate ([33]), then it is logical to assume that the heritability for annual increments under the pollution stress is relatively greater, as observed in our study.
Scots pine provenances showed variation in tolerance to air pollution in field tests near a nitrogen fertiliser plant in Poland ([25], [36]) and genetic variation in Austria ([14]). All these studies found a positive association between the genetic diversity of the provenances and the stress tolerance, concluding that tolerance was population-specific. Regrettably, Oleksyn et al. ([25]) and Geburek et al. ([14]) did not correlate the increments in the past with the present-day tolerance indexes nor investigated other reasons for the tolerance but the higher diversity. In Norway spruce, positive associations between the genetic diversity and air pollution tolerance were also observed ([6]). At enzyme loci, differences between air pollution tolerant and non-tolerant trees were reported ([21], [22]). A genetic connection between rate of photosynthesis, wood yield and pollution tolerance was observed by Oleksyn & Bialobok ([23]). Most of the other studies dealing with the associations between Scots pine needle anatomy and pollution tolerance did not investigate the genetic causes of variation (e.g., [35], [19]).
Plasticity could be one of the mechanisms involved in pollution tolerance ([5]). Pollution stress may affect allocation of resources within the affected plants ([20]) and provide molecular signals for differential gene expression ([28]). These changes may induce phenotypic differences, referred to as adaptive phenotypic plasticity (reviewed in [5]) and recently connected to epigenetic effects ([37]).
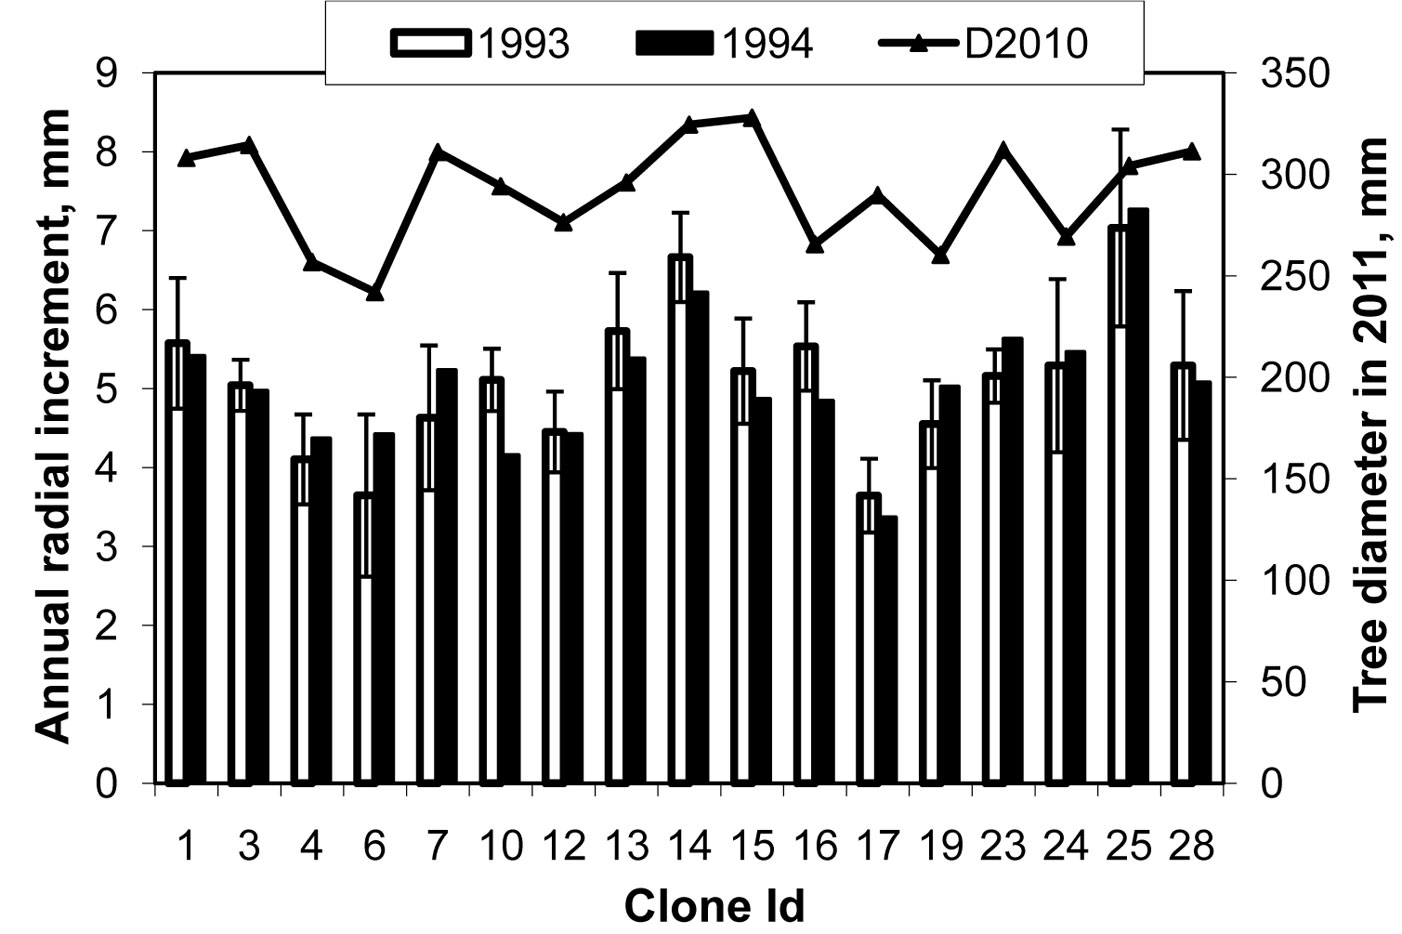
We postulate that during the period of high pollution stress in 1993-1994 (maximum defoliation), when the genetic control was relatively stronger, the clones growing faster were more stress tolerant. Based on this assumption, it is possible to identify such clones and preselect them for further investigation (Fig. 4 - only clones with more that 5 ramets per clone are plotted). This may also indicate that clonal tolerance to the pollution stress in the past may have a strong effect on the present-day clonal variation in wood yield. Apparently, the clones number 6 and 17 could be more susceptible to the pollution stress than the clones 14 and 25 (Fig. 4).
Fig. 4 - Clonal mean variation in annual radial increment at the time of maximum defoliation in 1993-1994 (white bars in 1993, black bars in 1994, left axis in mm) and tree diameter in 2011 (the line, right axis in mm). The error bars represent standard errors. The annual radial increment during 1993-1994 was associated with stronger genetic control and high correlations with the present-day defoliation (see Fig. 2).
A further approach is to study the needle anatomy traits such as stomata number per unit area, cuticular thickness, number of vascular tracts, needle wax properties and stomata anatomy ([35], [19]) of the contrasting clones in our study and to assess the heritability of these traits similarly to Reich et al. ([31]) or Oleksyn et al. ([26]), as well as to correlate the annual radial increments during the pollution stress with the present-day variables (needle anatomy traits, defoliation). The genetic component of these needle anatomy traits is largely unknown in Scots pine. To study the pollution tolerance under controlled conditions, indoor chamber tests can be established with the progeny of the tolerant and non-tolerant clones, identified by our approach and by the information on the genetic variation in needle anatomy, as suggested in Oleksyn & Bialobok ([23]) and Reich et al. ([31]). Screening the variation at a micro-physiology stage together with the genomic selection approach and SNP marker scoring in the revenant expressed sequences may provide molecular markers for the pollution tolerance in Scots pine.
Conclusions
Our study showed that the variation in the strength of the genetic control on annual radial increment of the Scots pine clones affected by industrial pollution is not random, and there are genetic associations between the high present-day defoliation and the low radial increment during the intensive pollution period in 1992-1995, when the highest levels of defoliation were recorded in the surrounding forest stands. There was a tendency to a relatively stronger genetic control on radial increments during the years of high defoliation in the surrounding stands. The next step is to screen for magnitude of the genetic variation and strength of the genetic control of the pollution tolerance traits (e.g., needle anatomy) by considering the clones representing the extremes for high and low radial increments during the stress period of 1992-1995. A further approach could be searching for associations between the genetic variation in the pollution tolerance traits and genetic markers.
References
Gscholar
Gscholar
Gscholar
Gscholar
Gscholar
Gscholar
Gscholar
Gscholar
Gscholar
Gscholar
Authors’ Info
Authors’ Affiliation
V Marozas
A Augustaitis
E Plaušyte
Faculty of Forest and Ecology, Aleksandras Stulginskis University, Studentu 11, Akademija, LT-53361 Kaunas reg. (Lithuania)
Corresponding author
Paper Info
Citation
Danusevičius D, Marozas V, Augustaitis A, Plaušyte E (2013). A fast screening approach for genetic tolerance to air pollution in Scots pine field tests. iForest 6: 262-267. - doi: 10.3832/ifor0701-006
Academic Editor
Elena Paoletti
Paper history
Received: Jul 23, 2012
Accepted: Mar 30, 2013
First online: Jul 01, 2013
Publication Date: Oct 01, 2013
Publication Time: 3.10 months
Copyright Information
© SISEF - The Italian Society of Silviculture and Forest Ecology 2013
Open Access
This article is distributed under the terms of the Creative Commons Attribution-Non Commercial 4.0 International (https://creativecommons.org/licenses/by-nc/4.0/), which permits unrestricted use, distribution, and reproduction in any medium, provided you give appropriate credit to the original author(s) and the source, provide a link to the Creative Commons license, and indicate if changes were made.

Web Metrics
Breakdown by View Type
Article Usage
Total Article Views: 56910
(from publication date up to now)
Breakdown by View Type
HTML Page Views: 47332
Abstract Page Views: 3824
PDF Downloads: 4138
Citation/Reference Downloads: 38
XML Downloads: 1578
Web Metrics
Days since publication: 4747
Overall contacts: 56910
Avg. contacts per week: 83.92
Article Citations
Article citations are based on data periodically collected from the Clarivate Web of Science web site
(last update: Mar 2025)
Total number of cites (since 2013): 1
Average cites per year: 0.08
Publication Metrics
by Dimensions ©
Articles citing this article
List of the papers citing this article based on CrossRef Cited-by.
Related Contents
iForest Similar Articles
Review Papers
Monitoring the effects of air pollution on forest condition in Europe: is crown defoliation an adequate indicator?
vol. 3, pp. 86-88 (online: 15 July 2010)
Research Articles
Estimating crown defoliation of Scots pine (Pinus sylvestris L.) trees using small format digital aerial images
vol. 6, pp. 15-22 (online: 14 January 2013)
Research Articles
First results of a nation-wide systematic forest condition survey in Turkey
vol. 4, pp. 145-149 (online: 01 June 2011)
Research Articles
Growth patterns of Scots pine (Pinus sylvestris L.) under the current regional pollution load in Lithuania
vol. 8, pp. 509-516 (online: 12 November 2014)
Research Articles
Predicting tree crown defoliation using color-infrared orthophoto maps
vol. 6, pp. 23-29 (online: 14 January 2013)
Research Articles
Effects of defoliation by the pine processionary moth Thaumetopoea pityocampa on biomass growth of young stands of Pinus pinaster in northern Portugal
vol. 3, pp. 159-162 (online: 15 November 2010)
Research Articles
Extreme climatic events, biotic interactions and species-specific responses drive tree crown defoliation and mortality in Italian forests
vol. 17, pp. 300-308 (online: 30 September 2024)
Research Articles
Long-term monitoring of air pollution effects on selected forest ecosystems in the Bucegi-Piatra Craiului and Retezat Mountains, southern Carpathians (Romania)
vol. 4, pp. 49-60 (online: 05 April 2011)
Technical Reports
Air pollution regulations in Turkey and harmonization with the EU legislation
vol. 4, pp. 181-185 (online: 11 August 2011)
Research Articles
Bioaccumulation of long-term atmospheric heavy metal pollution within the Carpathian arch: monumental trees and their leaves memoir
vol. 17, pp. 370-377 (online: 27 November 2024)
iForest Database Search
Search By Author
Search By Keyword
Google Scholar Search
Citing Articles
Search By Author
Search By Keywords
PubMed Search
Search By Author
Search By Keyword


