Assessing the performance of fire danger indexes in a Mediterranean area
iForest - Biogeosciences and Forestry, Volume 11, Issue 5, Pages 563-571 (2018)
doi: https://doi.org/10.3832/ifor2679-011
Published: Sep 01, 2018 - Copyright © 2018 SISEF
Research Articles
Abstract
The fire danger (FD) defines the conditions less or more favourable for a fire ignition success and its propagation. FD indexes, that integrates environmental variables related to FD in more or less complex equations and systems, are widely used in wildfire prone countries for both scientific and operational purposes. Assessing the performance of FD indexes is challenging and this issue is quite debated within the fire community, which has been trying to apply several methodologies to evaluate FD indexes. The main aim of this work is to give a contribution to this effort. The analysis was conducted using data from a fire-prone Mediterranean area (Sardinia island, Italy), where 8 FD indexes were evaluated and compared using different statistical approaches. We calculated the daily FD values for the period 2000-2007 over the study area. A set of statistical tools (namely Spearman rank correlation, Index Value Distribution and Percentile Analysis, and Logistic Regression) were applied to evaluate the performance of each FD index by comparing FD values with fire occurrence indicators. The statistical tests revealed a large variability in FD indexes performance, depending also on fire activity conditions. Our results showed that two of the tested FD indexes reached a good overall performance. Findings from this study can help both the scientific community and local fire managers, supporting the evaluation of early warning systems and fire prevention strategies in the Mediterranean Basin.
Keywords
Fire Risk, Fire Danger Rating, Mediterranean Basin, Fire Occurrence, Wildfire
Introduction
The Mediterranean countries of Europe face a serious problem with wildfires. In the last 15 years, on average, about 49.000 fires occurred in the 5 largest southern European countries (Portugal, Spain, France, Italy, and Greece), and more than 447.000 ha of forest burned every year ([37]). In southern Europe ignitions are mainly due to human activities ([18], [26], [21], [8]), while fire spread is mainly governed by weather and climate ([30], [4], [31], [33]), even if fuels and land uses can represent key driving factors ([32], [7], [10], [36]). Moreover, other aspects (i.e., the socio-economic context, topography, firefighting resources, and fuel management) also influence the spatial pattern of fire occurrence and spread ([17], [27], [35]).
Weather variables, alone or in combination with structural/physical vegetation data and topography, are commonly used as input data of fire danger (FD) indexes or systems to estimate the potential FD of a given area. As a general rule, FD indexes are assumed to express potential fire behavior, as for example fire spread rate or intensity. The output of a FD system can be either numeric or dimensionless (index). Especially for operational purposes, the potential FD is often expressed by FD classes (fire danger rating) corresponding to the fire potential occurrence of specific areas with given weather, fuel, and terrain conditions.
Assessing the performance of FD indexes is challenging. A general assumption for FD indexes reliability is the relationship between the estimated potential FD and fire occurrence in terms of spread and intensity potential, and control difficulty. Since in Mediterranean areas most ignitions are caused by anthropogenic causes, it is difficult to determine if an index is more reliable than others only by considering fire occurrence, as high or extreme FD conditions can be observed in days without fire ignitions. In addition, a number of factors (e.g., firefighting efficiency, fuel type, roads, fuel discontinuity) can significantly influence the local fire behavior in a given season and place. As a consequence, results from a given index performance analysis need to be correctly interpreted and applied. However, the comparison between an FD index output and fire occurrence indicators is often adopted to evaluate the FD index performance. Although several concerns related to this approach (e.g., fire indicators are often arbitrarily selected), it represents a key analysis to calibrate the index, assess the index performance, and understand if and how a specific index works well under the tested conditions.
Over recent decades only a few papers attempted to apply statistical methodologies to assess and compare the performance of two or more FD indexes ([2], [11]). The majority of works have used historical data of fire occurrence (usually fire number and burned area) to assess the FD index performance. Viegas ([47]) compared 5 FD indexes using fire indicators related to the burned area and number of fires, both with a visual analysis of fire parameters trend and statistical tests. Cruz & Viegas ([6]) gathered fire behavior information from experimental fires to make a comparison with modeled fire behavior using linear regression. The burned area, number of fires per day, firefighting resources, and units employed were used as fire indicators to evaluate FD indexes also by other authors ([16]).
A few papers, however, have attempted to use advanced statistical techniques to evaluate the performance of FD indexes. Mandallaz & Ye ([19]) applied Poisson models to predict forest fires. Andrews et al. ([2]) applied an analysis based on logistic regression and percentile analysis. The logistic regression was used to validate an FD index developed in a Mediterranean Basin area also by Vicente López & Crespo Abril ([46]), and it was also used to predict fire occurrence by Arndt et al. ([3]). Percentile analysis was already used to determine FD levels and evaluate the FD indexes performance ([1], [2], [13]). However, so far there is not still a general consensus on a robust and standardized methodology to compare FD indexes performance.
In this study we aimed to give an overall contribution to the assessment of FD indexes performance in the Mediterranean Basin. Specific objectives were to: (i) evaluate similarities and differences in the daily outputs of the selected FD indexes; and (ii) provide evidence on the FD indexes ability and accuracy in predicting fire occurrence. We applied appropriate statistical tests to compare the response of 8 FD indexes under Mediterranean environmental conditions at different fire activity levels and to evaluate possible differences in the results of the different statistical tests. Widely used indexes, such as the FWI (Canadian Fire Weather Index - [44]) and the KBDI (Keetch & Byram Drought Index - [15]), were included in the analysis, as well as less broadly adopted ones such as IFI, an FD index specifically developed and calibrated for Mediterranean fire prone areas. The analysis was carried out at daily scale using data from 8 consecutive years (2000-2007), considering as case study a large fire-prone region (island of Sardinia, Italy), highly representative of the Mediterranean environments.
Materials and methods
Study area and fire data
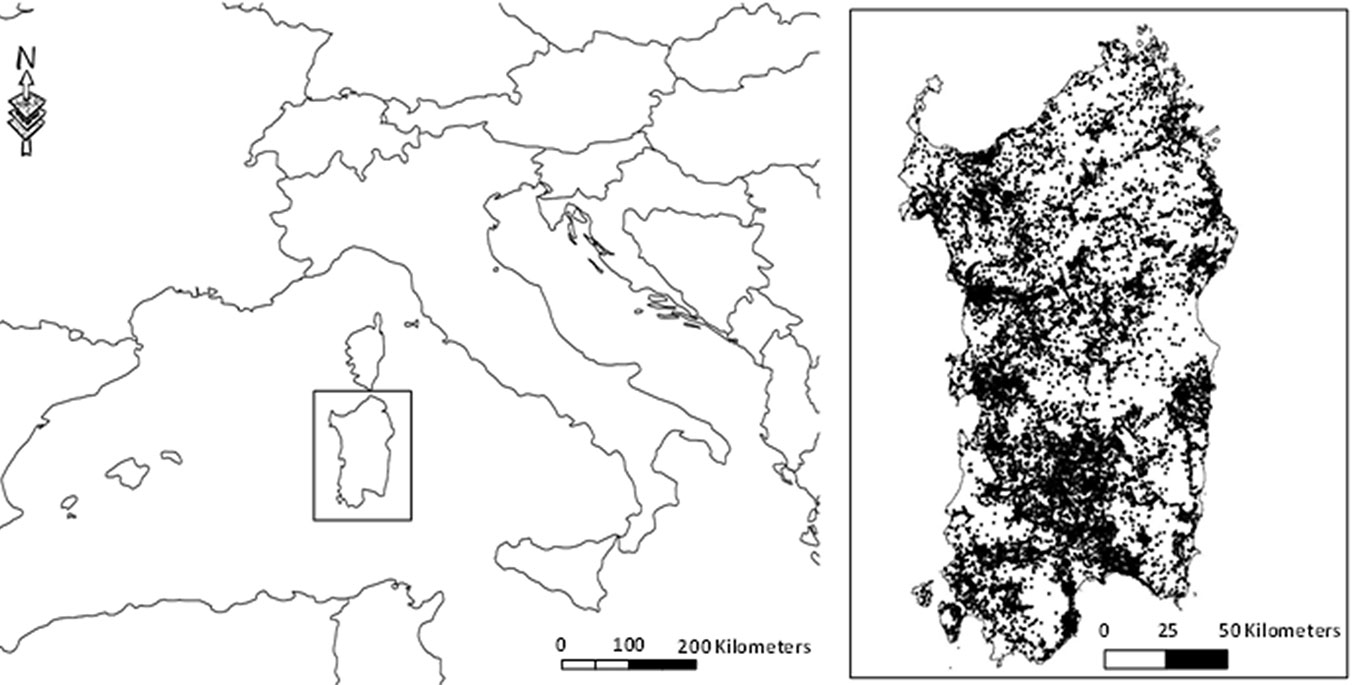
Sardinia (Italy - Fig. 1) is the second largest (24,090 km2) island of the Mediterranean Sea. The climate is typically Mediterranean, with a mild and rainy winter (rain occurs mainly in late autumn and spring, mean annual rainfall 500-800 mm), and a warm and dry season from June to October. About half of the Sardinian surface area is covered by broad-leaved forests and maquis. Historically, Sardinia is characterized by the highest percentage of fires occurring in Italy, with a long fire season (from late May or June until October). During the study period (2000-2007), Sardinia experienced 24,518 fires and a total surface area of 153,449 ha was burned (source: official fire database of the Regional Administration of Sardinia). July is the month with the highest fire number and the largest burned area. Tab. 1 presents the main statistics of fire events that occurred in Sardinia during the period under investigation.
Fig. 1 - Location of the study area (Sardinia, Italy) in the Mediterranean Basin. The fire ignition points of the period 2000-2007 are reported in the figure on the right.
Tab. 1 - Fire statistics during the period 2000-2007 in Sardinia. (A): The starting and ending dates of the fire season were defined as the dates that follow 10 consecutive days with and without fires, respectively.
| Year | Number of fires |
Total burned area (ha) |
Mean burned area / fire (ha) |
Fire season(A) | Days with fires | Max fire number / day |
Max burned area / day (ha) |
|---|---|---|---|---|---|---|---|
| 2000 | 2,115 | 15,597 | 7.4 | 13 May - 2 Oct | 172 | 37 | 2.221 |
| 2001 | 3,446 | 18,791 | 5.5 | 27 May - 13 Sept | 194 | 55 | 958 |
| 2002 | 4,187 | 19,773 | 4.7 | 12 May - 2 Oct | 201 | 67 | 3,024 |
| 2003 | 2,998 | 22,445 | 7.5 | 29 May - 13 Oct | 176 | 57 | 2,384 |
| 2004 | 3,113 | 21,443 | 6.9 | 5 Jun - 25 Oct | 152 | 76 | 3,250 |
| 2005 | 2,995 | 13,313 | 4.4 | 24 May - 5 Nov | 191 | 68 | 1,529 |
| 2006 | 2,339 | 7,729 | 3.3 | 12 May - 13 Sept | 173 | 45 | 1,493 |
| 2007 | 3,325 | 34,358 | 10.3 | 16 May - 29 Oct | 176 | 66 | 12,070 |
Fire danger indexes
A wide variety of FD indexes is described in the literature. Given to the overall purpose of this study, and aiming to evaluate the concordance in the statistical assessment of FD indexes, we selected well known and widely tested FD indexes together with less diffuse ones, including FD indexes developed in very different environmental context. In addition, our choice was based on the input data needed for the calculation of each FD index, that are easily available.
Eight FD indexes were chosen:
- FWI - Canadian Fire Weather Index of the Canadian Forest Fire Weather Index System (CFFWIS), currently adopted also by the EU Forest Fire Information System EFFIS ([44], [38]);
- KBDI - Keetch-Byram Drought Index ([15]);
- McArthur Mark 5 (Mk5) Forest and Mark 4 (Mk4) Grassland Fire Danger Index ([25]);
- FFWI - Fosberg Fire Weather Index ([12], [40]);
- F index ([40]);
- Nesterov Index ([24]);
- IPi Propagation index - FAO-UNESCO method ([45]);
- IFI - Integrated Fire Index ([41]).
The FWI is probably the most known and widely used FD index worldwide. It is based on the moisture estimation of three forest fuel classes, and accounts the effect of the wind on fire behaviour. Also the Australian Mk5 and Mk4 are well known and widely used FD indexes, developed for predicting the headfire rate of spread in Australian vegetation characterized by grassland and Eucalyptus forests. The Keetch-Byram Drought Index and the Nesterov Index are drought indexes, and are often used as proxies of the fire danger conditions, alone or integrated in more complex fire danger systems. The F index is a simple index for fire danger rating, which combines temperature and relative humidity (for a coarse estimate of fuel moisture), and wind speed. The IPi and FFWI indexes are used as proxies of fire behaviour characteristics.
IFI is a fire danger rating index developed and calibrated to account for the climate and vegetation characteristics of Mediterranean areas. It is operationally used in Sardinia by the Regional Civil Protection Service for daily fire danger forecasting during the fire season.
IFI is an empirical fire danger index based on weather and fuel physical inputs. The daily index value is obtained as a sum of four subcomponents (eqn. 1):
where DC is the drought code, MC is the meteorological code, R is the code related to the solar radiation, and FC is the fuel code.
DC represents a parametrization of the water balance (eqn. 2):
where Rg is the global daily radiation (in W m-2); T is the mean daily air temperature (°C); λ is the latent heat of evaporation (J g-1); Pa is the daily rainfall (mm); Pc100 is the rainfall of the last 4 days (mm).
In eqn. 2, the numerator is a simple model of the evapotranspiration rate. It is built to roughly indicate the water status of the system and the moisture content of the fuel. DC values range from 0.1 (lowest danger conditions) to 5 (highest danger conditions). DC values lower than 0.1 are assumed = 0.1; DC values higher than 5 are assumed = 5.
MC accounts for the meteorological conditions favouring the maximum fire spread during the day and is derived modifying the results of previous works carried out in Sardinia ([29] - eqn. 3):
where Tx is the maximum daily air temperature (°C); WS is the maximum daily wind speed (km h-1); RHn is the minimum daily air temperature.
MC ranges from 0.4 to 5 (minimum and maximum fire danger conditions respectively). MC values lower than 0.4 are assumed = 0.4; MC values higher than 5 are assumed = 5
R is a coefficient accounting for the maximum daily solar radiation RSx: if RSx < 400 W m-2 then R = 0.24; if 400 W m-2 ≤ RSx ≤ 800 W m-2, then R = 0.32; if RSx > 800 W m-2, then R = 1.
FC is related to the structural and physical characteristics of fuel and is computed as (eqn. 4):
where LAI is the Leaf Area Index (dimensionless); LAD is the Leaf Area Density (= m2 of foliage m-3); DW is the fuel moisture content expressed as a fraction of the fresh fuel weight (0 = 100% of water; 1 = 0% of water).
The calculation of FC required the definition of specific fuel categories (i.e., fuel models). A preliminary analysis of the available Sardinia soil cover maps allowed to identify and select 6 vegetation cover types representing about 50% of the total Sardinia surface: (1) broad leaf forest; (2) cork oak forest; (3) low shrubland; (4) tall shrubland; (5) garrigue; and (6) grassland. Data for FC calculation were derived from literature and field observations taken in different periods of the year in Sardinia.
The daily IFI value ranges from a minimum of 1.05 (lowest IFI value for grassland) to a maximum of 13.86 (highest IFI value for tall shrubland).
Weather and fire dataset
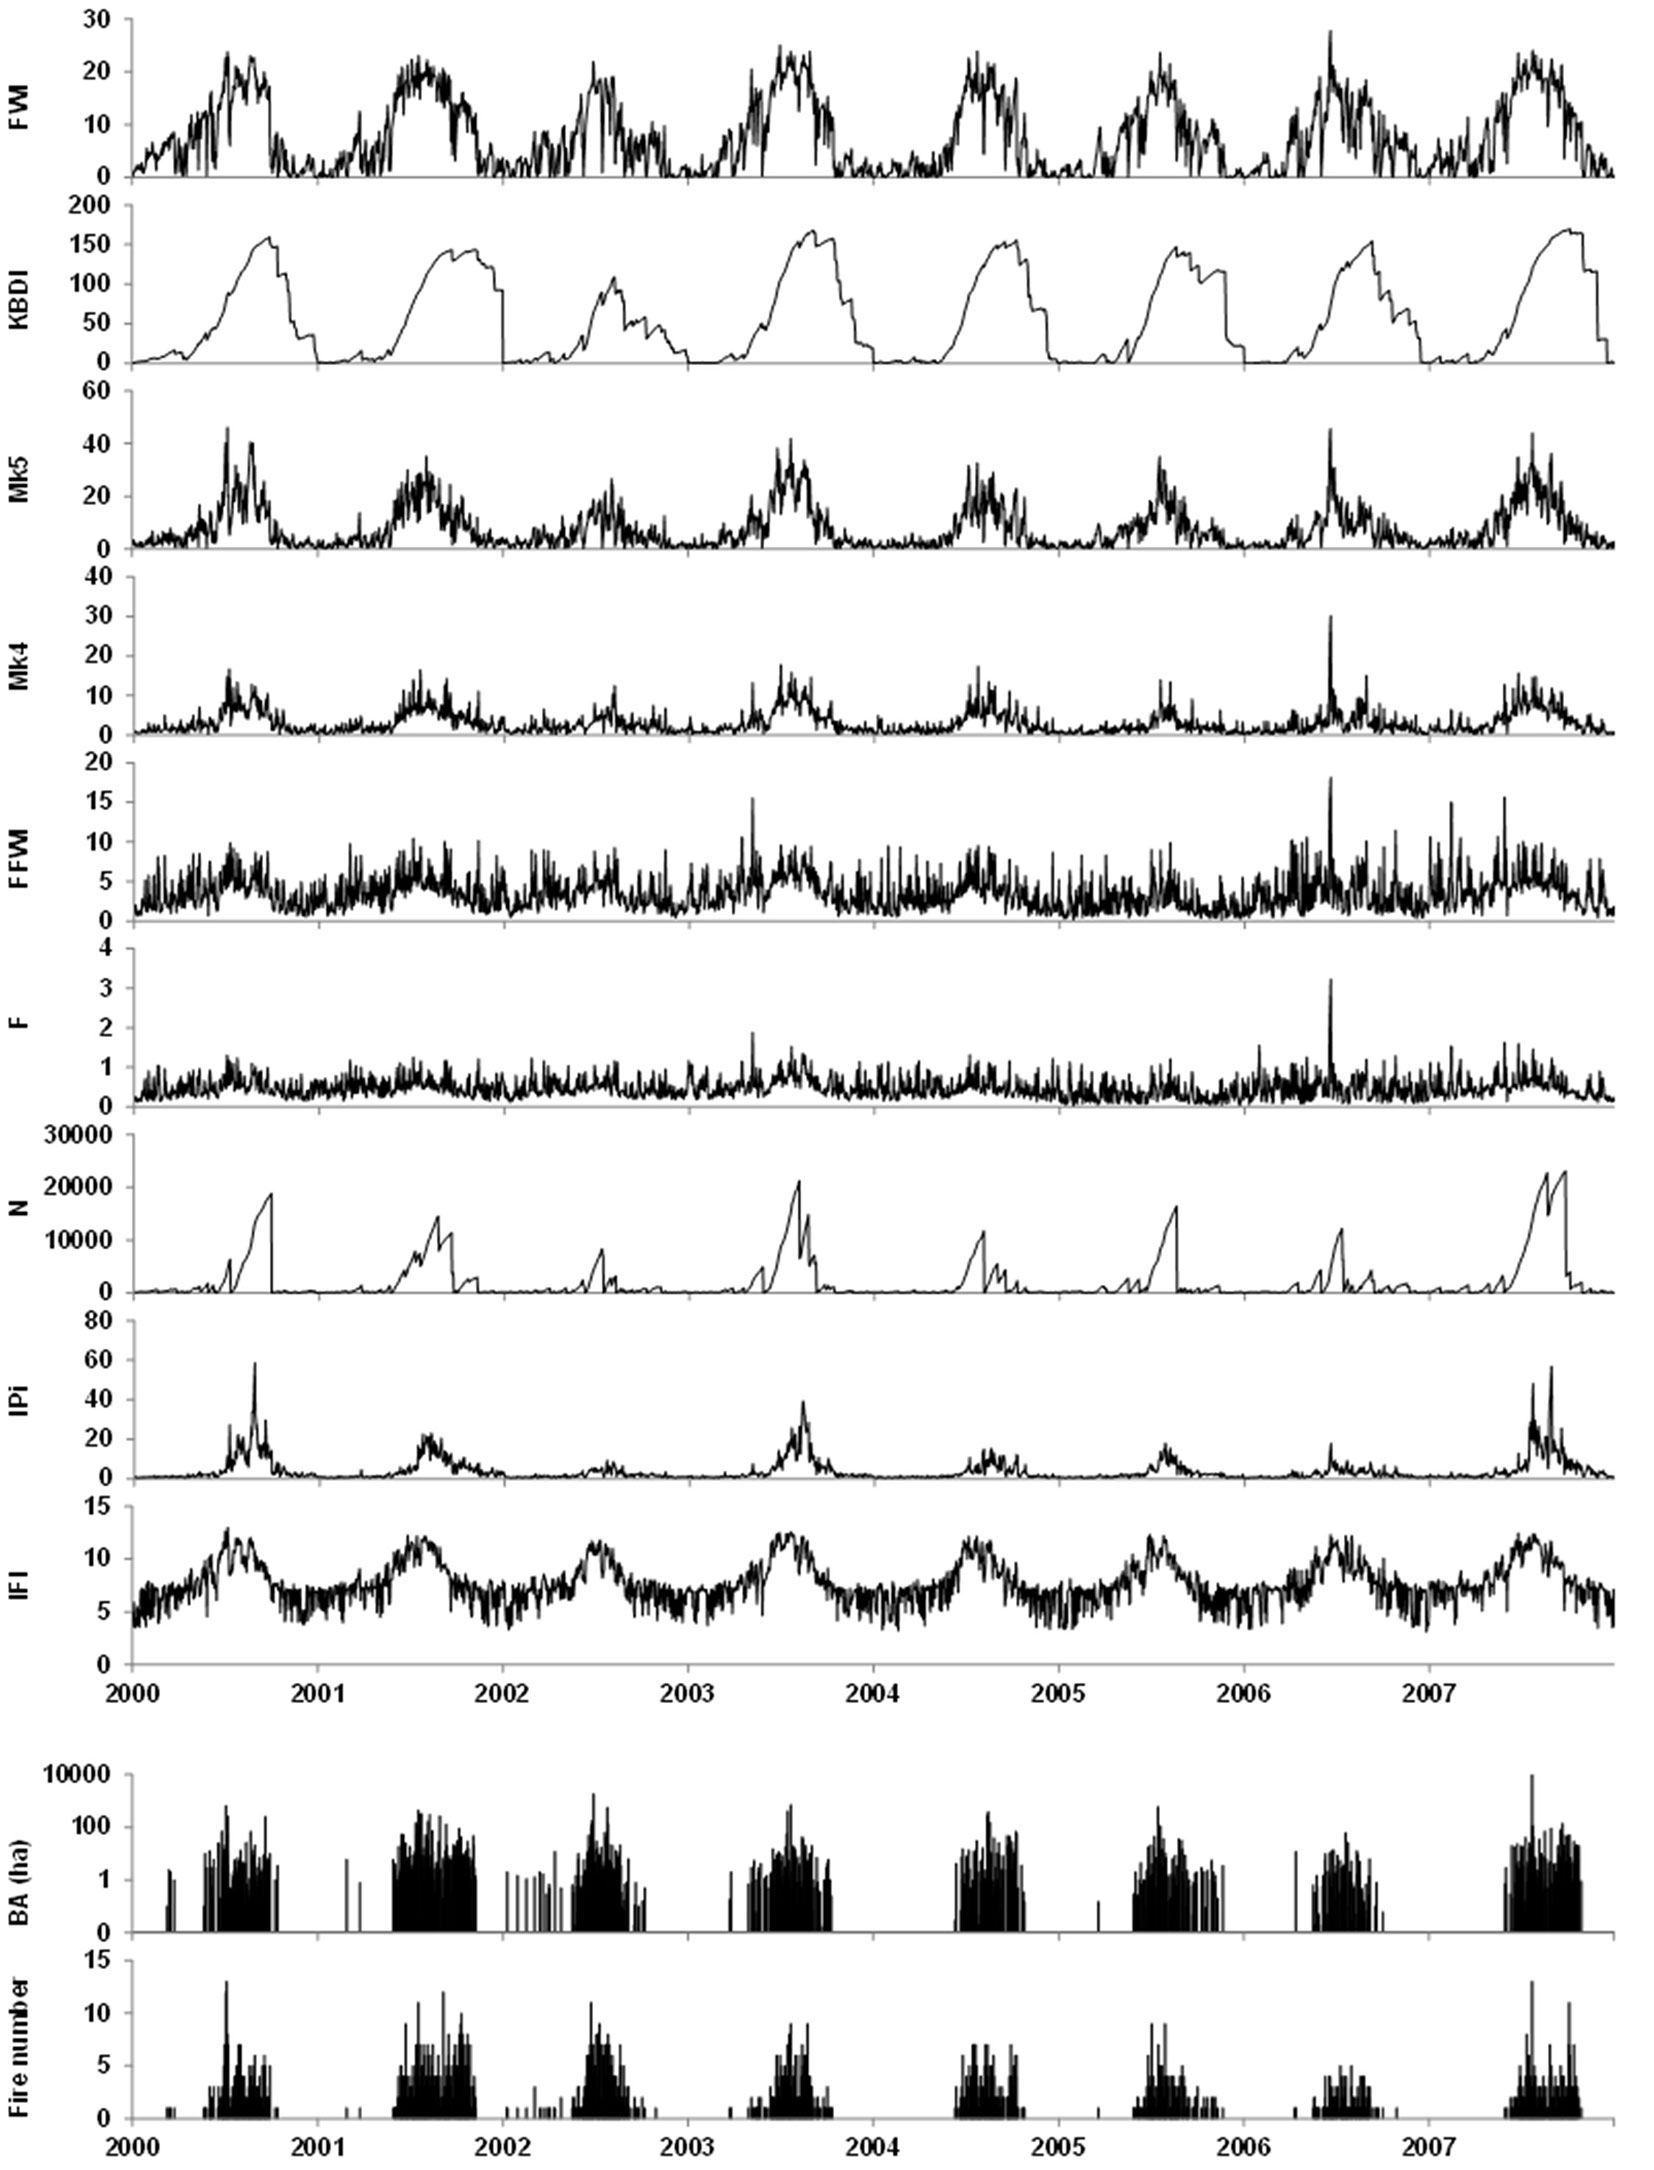
Fire and weather data are related to the years 2000-2007. We selected these years due to the high homogeneity of the available fire data and of the firefighting organisation, as both these factors could provide disturbances in the fire data series ([42]). Weather data were provided by ARPAS (Regional Environmental Protection Agency of Sardinia) from 48 weather stations. We calculated the daily FD values of each FD index per weather station. Then, following a previous climatic characterisation of Sardinia ([5]), we identified 7 homogeneous climatic areas (CA) covering the whole island surface (Fig. 2) and assumed that the FD level in a given day could be considered uniform within each CA. The daily FD value per each FD index and CA area was calculated as the mean daily FD index value of the respective CA. The whole dataset is composed by 18.263 days, which is approximately 90% of the potential maximum number of days, as the entire year 2007 for the CA no. 2 and the whole period 2002-2006 for the CA no. 6 were discarded due to the high percentage of missing data. Fig. 3 shows an example of the daily trend of tested FD indexes in the CA no. 3, the number of fires, and the burned area recorded over the period 2000-2007.
Fig. 2 - Climatic areas of Sardinia (here numbered from 1 to 7). Triangles indicate the location of the 48 weather stations used in this study.
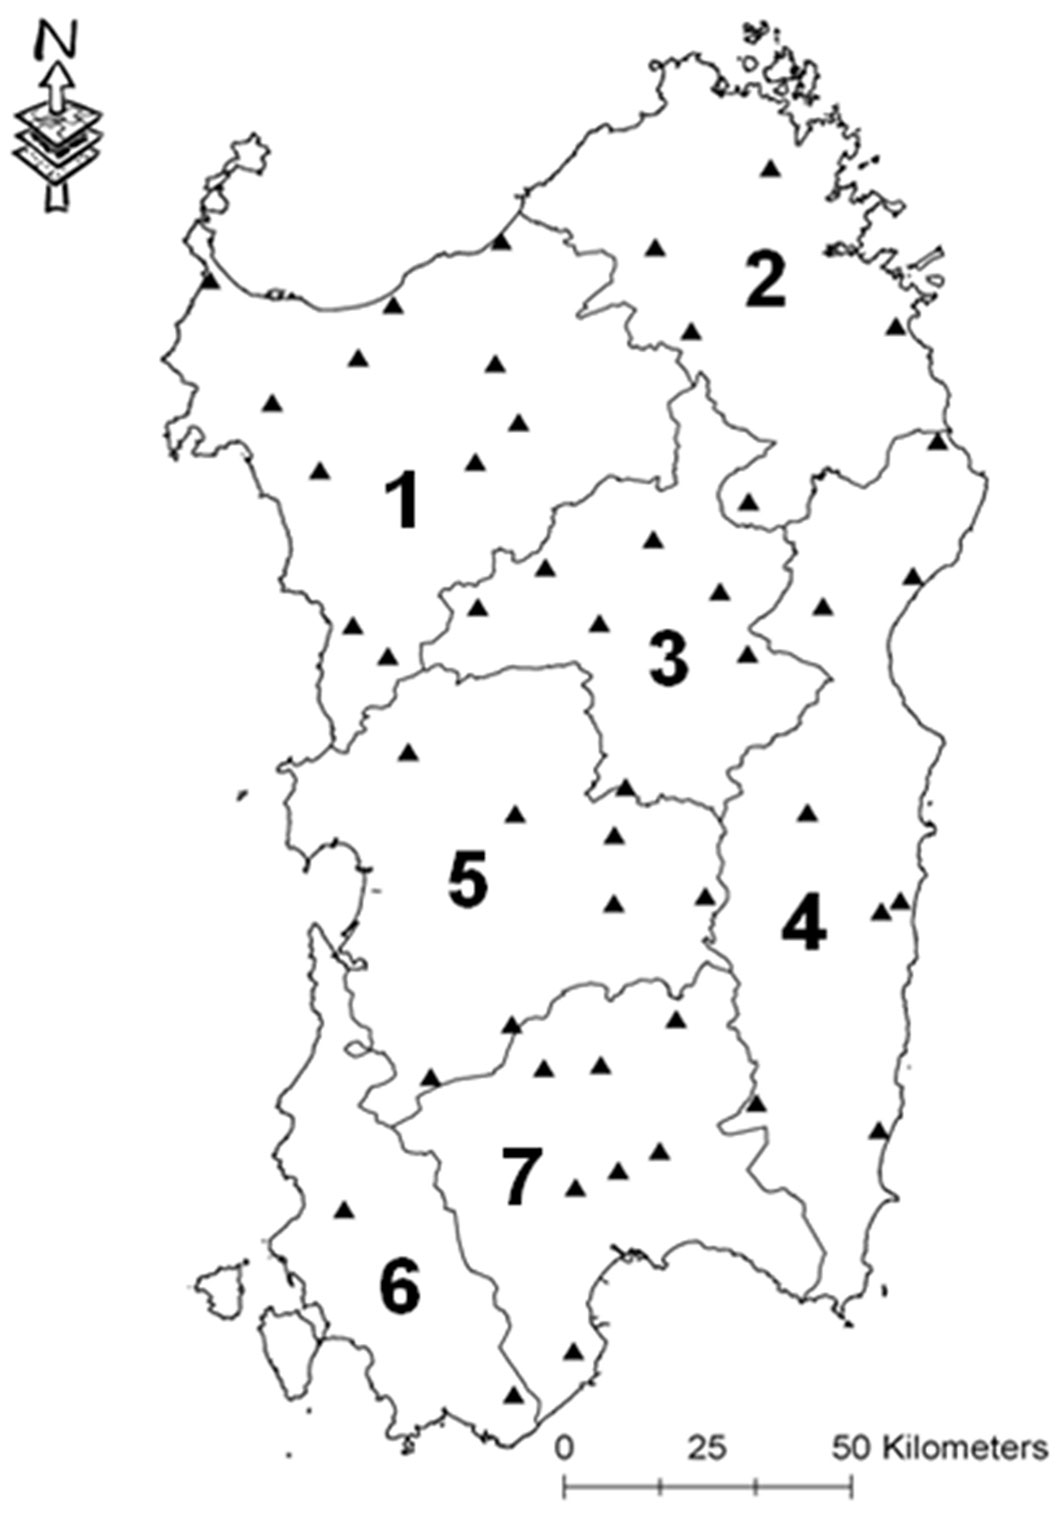
Fig. 3 - Mean daily values of the fire danger indexes within the climatic area n. 3, along with observed fire number and burned area (BA) for the study period 2000-2007.
Spearman’ rank correlation analysis
To compare the different FD indexes, we normalized each daily FD index value per CA in a scale ranging from 0 to 100 as follows (eqn. 5):
where In is the normalised daily value, I is the daily value, Imin and Imax are the absolute minimum and maximum daily values, respectively, calculated over the whole study period.
The normalised daily value In of each FD index per CA was expressed as FD danger class, considering 10 FD classes of increasing FD degree (i.e., class 1: 0-9.99; class 2: 10-19.99; etc.). We then created a data matrix containing all the regional data, and the following fire parameters were calculated for each FD index and class (8 FD indexes × 10 FD classes = 80 rows):
- P1: the percentage of days with fires (days with fires with respect to all days per FD class). We used a threshold of 4 fires per day to exclude days with occasional or small fires);
- P2: the daily burned surface area per 50 km2;
- P3: the daily fire number per 50 km2;
- P4: the mean burned surface area per fire.
Based on the assumption that the value of the fire parameters should increase when the FD class increases, we applied the Spearman’s rank correlation analysis to calculate the association between each FD index and the fire indicators, obtaining the correlation coefficient ρ for the 8 FD indexes and the 4 fire parameters (10 pairs of data for each ρ calculation). The highest ρ value (ρ = 1) indicates a perfect match between the FD class and the value of a fire parameter (that is, the fire parameter value increases when the FD class increases). Not all the selected parameters are totally independent and the relationships between FD indexes and fire activity are not always linear ([39]). Nonetheless, the aim of the analysis was to investigate whether the increase in the observed fire activity was related to the increase in the fire danger class as indicated by each index. Assuming that higher ρ values indicates a better index performance in predicting fire occurrence, a score related to the performance was calculated for each FD index by summing the ρ coefficients (p ≤ 0.05). The higher is the score (min = 0, max = 4), the higher is the index accuracy in predicting fire occurrence.
Index value distribution and percentile analysis
Percentile analysis of FD values distribution over a time interval provides useful information on its variability and can be used to determine if and how much the indicators of fire activities are correctly detected by the FD indexes.
We calculated per each CA a further set of 5 fire metrics, which reflect low to severe observed occurrence of fire in terms of ignitions and burned surface area: (i) AD (all days), days with and without fires (over 18,263 days); (ii) OFD (one fire days), days with at least one fire (6,140 days); (iii) MFD (more than one fire days), days with at least 1 fire per 1.000 km2 (2,758 days); (iv) LFD (large fire days in terms of total burned surface area): days with burned surface area larger than 0.5 ha per 50 km2 (719 days); (v) LAFD (large average fire days, in terms of mean burned surface area per fire), days with an average burned surface area per fire greater than 10 ha (495 days).
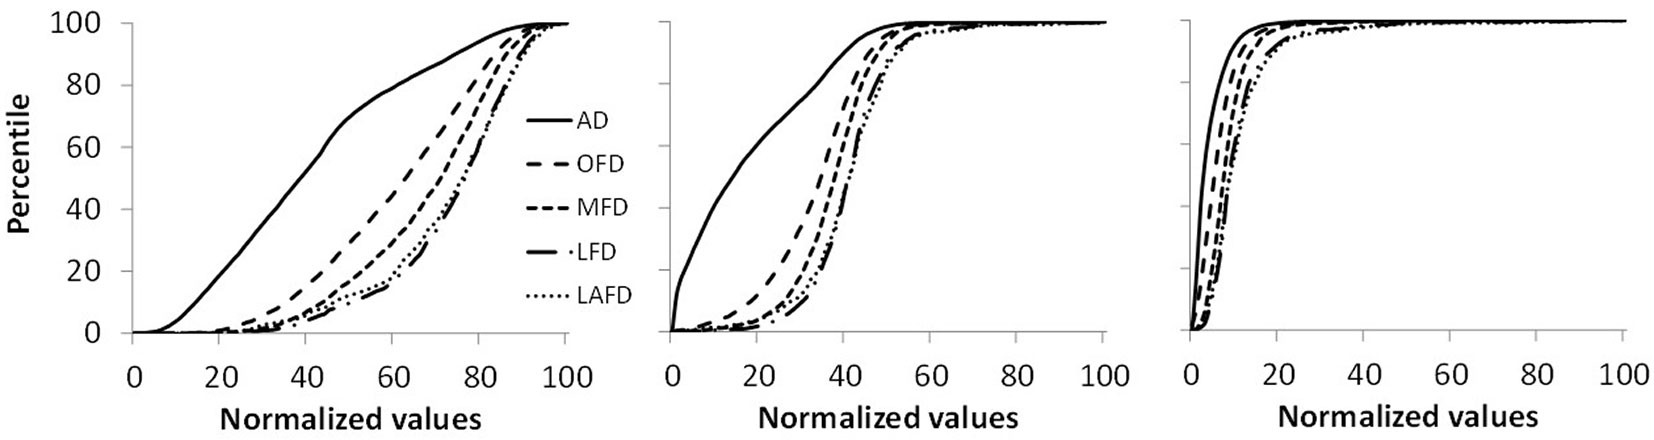
As an example of percentile analysis, the distribution values of 3 tested FD indexes for AD, OFD, MFD, LFD and LAFD related to 3 FD indexes are shown in Fig. 4. If no relationship exists between the index value and the fire activity indicators, all the distributions are expected to be similar to that of AD; vice versa, a distribution shifted to the right from AD to LAFD (from the top to the bottom of Fig. 4, corresponding to an increase in fire activity) indicates that the index value is likely increasing when fire activity is progressively increasing. Fig. 5 reports the corresponding cumulative distribution curves for each FD index. For given percentile levels (90th, 75th, 50th, and 25th thresholds were chosen in this study) we calculated for each FD index the difference between the indicators corresponding to different fire activity levels, in terms of the following 4 parameters (expressed in days): (i) all days minus fire days (AD-OFD); (ii) fire days minus multiple fire days (OFD-MFD); (iii) multiple fire days minus large fire days (MFD-LFD); (iv) large fire days minus large average fire days (LFD-LAFD).
Fig. 4 - Frequency distribution of IFI, FWI, and Mk4 normalized values considering all days (AD), days with fires (OFD), multiple fire days (MFD), large fire days (LFD), and large average fire days (LAFD).
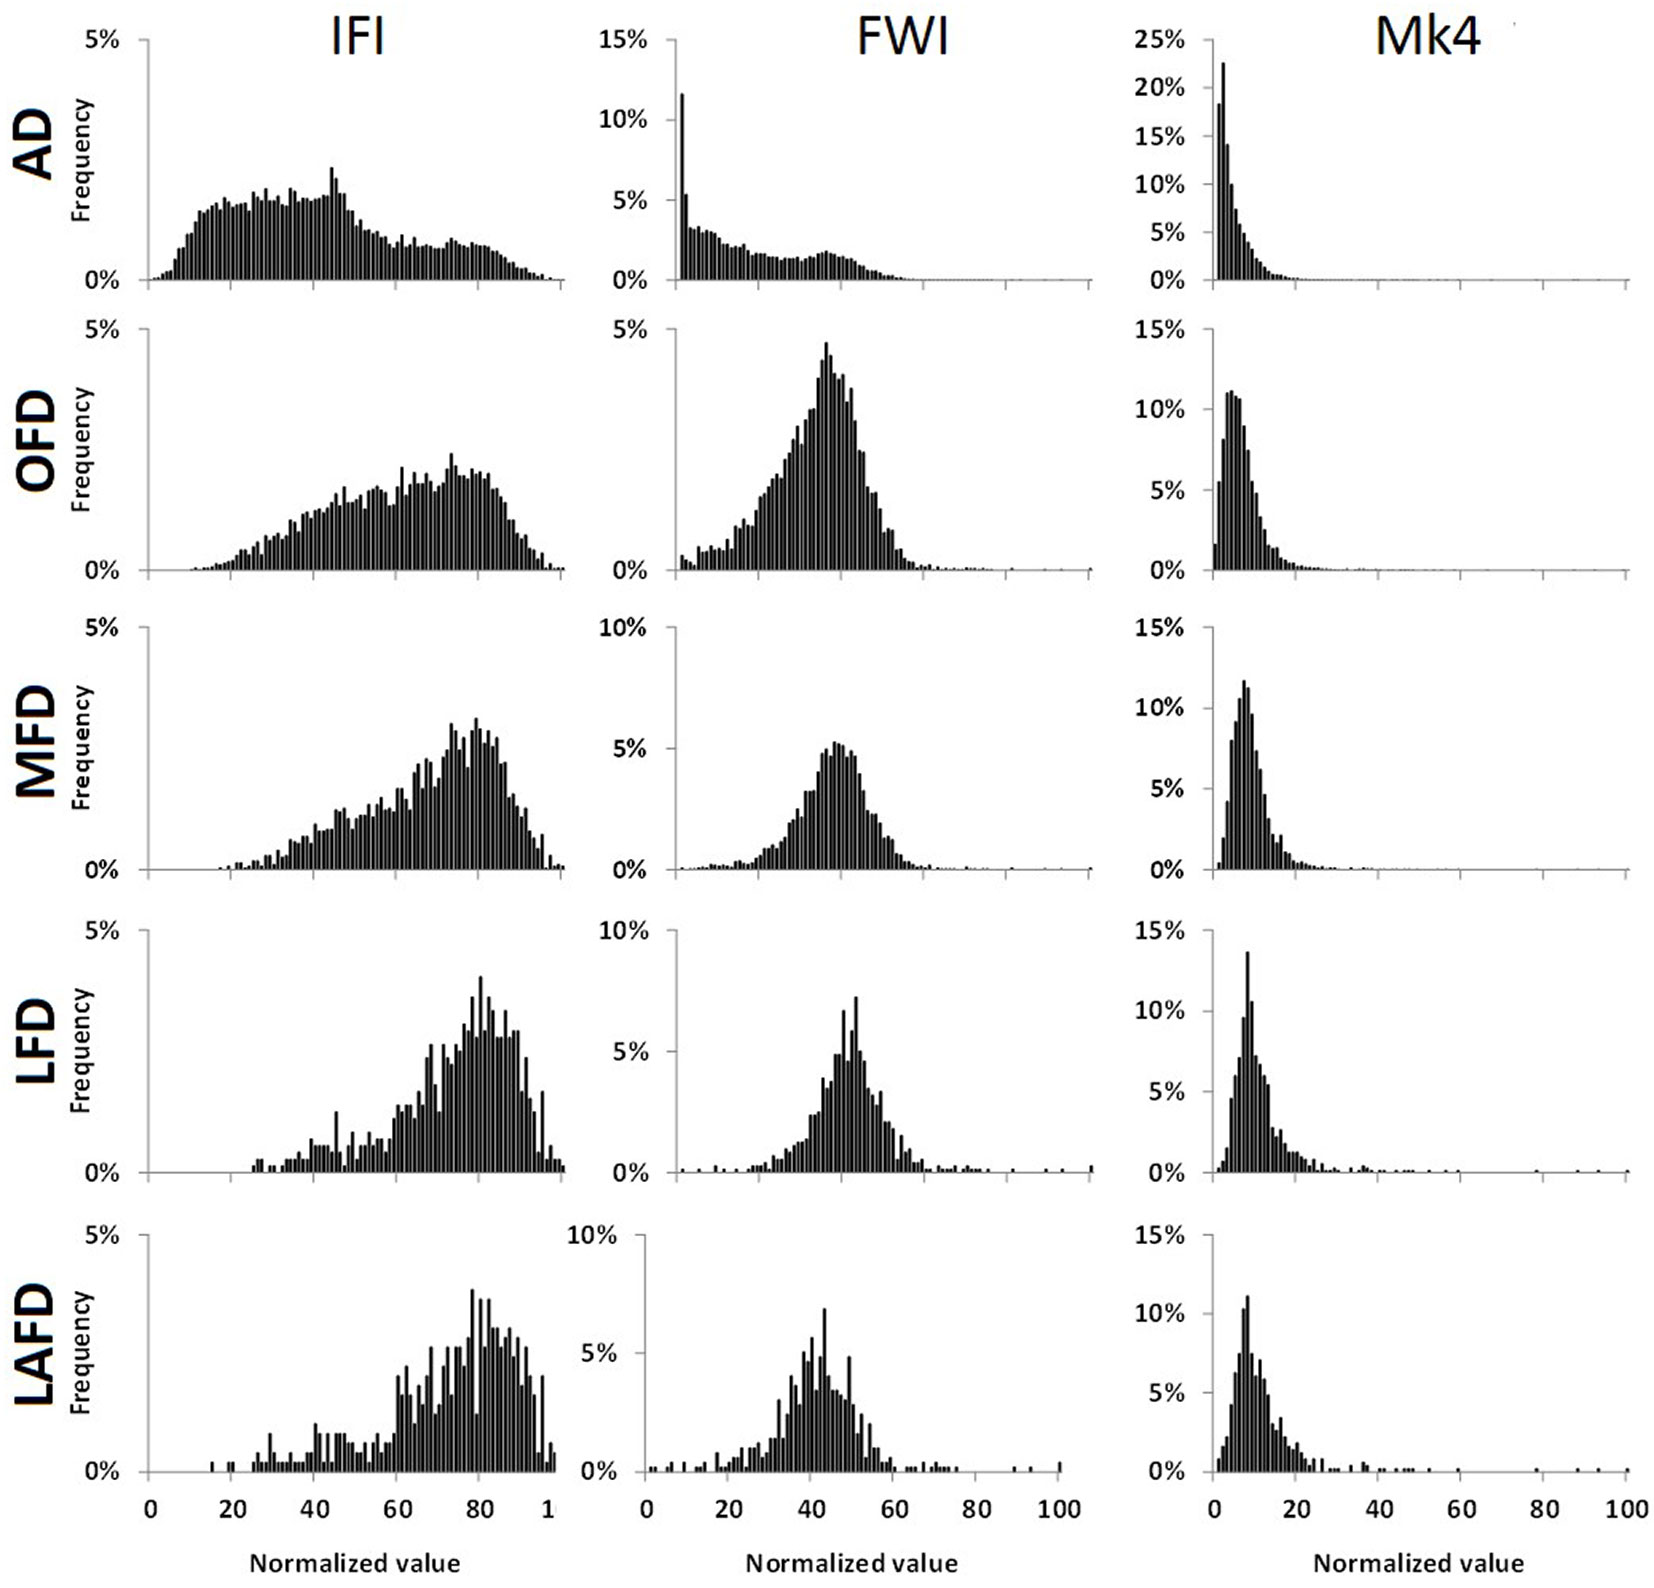
Fig. 5 - Percentile distribution of different fire activity parameters obtained using the FD indexes IFI (left), FWI (center), and Mk4 (right). (AD): all days; (OFD): days with fires; (MFD): multiple fire days; (LFD): large fire days; (LAFD): large average fire days.
The higher the sum of these 4 values, the higher is the ability of the index to discriminate days with different fire activity levels. These sums were used to rank the FD indexes. The indexes with the lowest cumulative values are expected to be less accurate, overall, in discriminating days with different fire activity.
Logistic regression
The fire activity indicators OFD, MFD, LFD, LAFD can be considered as binary (true/false) response variables that can be predicted using sets of explanatory variables (e.g., values of a fire danger index or meteorological variables). The relationship between fire probability and the predictor variables can be described by a sigmoid function, which is almost linear only for intermediate values whereas tends asymptotically to 0 and 1 at the extremes. The use of logistic regression and logit-logarithmic transformation allows to express the response probability (p) by a linear combination of a set of parameters (eqn. 6):
where α is the intercept parameter, β’ is the vector of the slope parameters, and x is the explanatory variable value. The probability of occurrence of an event can be calculated as follows (eqn. 7):
where e is the base of natural logarithms. Such probability can be used for predicting fire activity indicators, which will take a value of 1 when the probability is higher than a suitable cut-off threshold, or zero otherwise.
Different methods exists to select the best-fitting logistic regression model, such as overall model accuracy, goodness-of-fit statistics, etc. ([22], [14]). We used the overall model accuracy to test for the prediction improvement determined by the inclusion of explanatory variables over the intercept-only model (the null model). The null hypothesis (i.e., all the explanatory effects in the model are equal to zero) was tested by the Wald’s Chi-Square statistics (α = 0.05). The Wald’s statistic was also used to evaluate the significance of both the intercept and the predictors included in the models. We also evaluated the goodness-of-fit of the logistic regression models using the Hosmer-Lemeshow test ([14]). Moreover, for each model we calculated the Nagelkerke’s R2, which is an adjusted coefficient of determination which measures the increase in likelihood with respect to the null model when a predictor is included in the logistic model ([23]).
An error matrix between observed and predicted values of the fire activity indicators was constructed and used to calculate the c-statistic ([14]), which may range from 0.5 (random association between observed and expected events) to 1.0 (full association). Models are typically considered predictives when the c-statistic value is higher than 0.7, and strong to very accurate when exceeding 0.8-0.9. Moreover, the true/false positive values derived from the error matrix were used to assess the sensitivity (in terms of correctly classified fire events) and specificity (correctly classified non-fire events) of each model.
Results
Spearman’s rank correlation analysis
The Spearman’s correlation analysis was performed to obtain a general indication of the predicting performance of the FD indexes. IFI showed the highest score (4.00), indicating a perfect and positive correlation between the 4 fire parameters and the danger classes for the whole fire activity range (Tab. 2). Good results were also obtained by FFWI (score 3.55) and by the Canadian FWI (3.36). Mk5 and F indexes showed intermediate results, with a score value below 3. Fair to poor scores were observed for KBDI and IPi indexes. Mk4 and Nesterov indexes did not show any significant correlation.
Tab. 2 - Spearman’s coefficients (ρ) calculated for the fire danger indexes used in the analysis. (P1): % of days with at least 4 fires over all days of that class; (P2): burned area (in ha) over 50 km2; (P3): daily fire number over 50 km2; (P4): mean burned area (in ha) per fire. The score is obtained as the sum of the ρ of each index (only ρ with p ≤ 0.05 were considered). (**): p ≤ 0.01; (*): p ≤ 0.05; (ns): not significant.
| FD Index | P1 | P2 | P3 | P4 | Score |
|---|---|---|---|---|---|
| FWI | 0.83** | 0.85** | 0.85** | 0.82** | 3.36 |
| KBDI | 0.87** | 0.50 ns | 0.90** | 0.37 ns | 1.77 |
| Mk5 | 0.31 ns | 0.87** | 0.87** | 0.87** | 2.60 |
| Mk4 | 0.56 ns | 0.58 ns | 0.32 ns | 0.39 ns | - |
| FFWI | 0.84** | 0.95** | 0.88** | 0.88** | 3.55 |
| F | 0.93** | 0.73* | 0.94** | 0.56 ns | 2.60 |
| N | 0.10 ns | -0.25 ns | -0.14 ns | -0.49 ns | - |
| IPi | 0.77* | 0.52 ns | 0.76* | 0.33 ns | 1.52 |
| IFI | 1.00** | 1.00** | 1.00** | 1.00** | 4.00 |
Index value distribution and percentile analysis
Percentile analysis allowed to quantify the FD indexes response (in terms of its variability) at different fire activity levels. Fig. 5 shows an example of the observed percentile distribution of different fire activity parameters for IFI, FWI, and Mk4 indexes. The differences between the values of each index at selected percentile levels are reported in Tab. 3. The sum of these differences can be used to quantify the shift of each distribution under different fire activity conditions. Overall, the ranking based on the sum-of-differences revealed a good performance of the IFI and Mk5 indexes. IFI provided accurate estimates of days with low to high fire occurrence activity, except for very high fire occurrence. Mk5 well estimated medium to very high fire occurrence. KBDI was the third index in the overall ranking, and had the first and the second rank at low (OFD-AD) and high (LAFD-LFD) fire activity conditions, respectively. KBDI showed to well predict days with fire ignitions and days with very high fire occurrence, but it appears to be a poor indicator of potential severity for intermediate fire activity conditions. FWI was the fourth index in the overall ranking.
Tab. 3 - Sum of the differences of the fire danger index value for the 25th, 50th, 75th and 90th percentile between different fire activity conditions, and ranking.
| FD Index | Σ of differences | Ranking | ||||||||
|---|---|---|---|---|---|---|---|---|---|---|
| OFD- AD | MFD-OFD | LFD-MFD | LAFD-LFD | Sum | OFD- AD | MFD-OFD | LFD-MFD | LAFD-LFD | Rank | |
| FWI | 58.3 | 13.0 | 14.7 | 1.7 | 87.8 | 4 | 4 | 4 | 3 | 4 |
| KBDI | 87.9 | 6.8 | -1.6 | 2.6 | 95.7 | 1 | 7 | 9 | 2 | 3 |
| Mk5 | 55.1 | 18.9 | 26.5 | 2.9 | 103.4 | 5 | 3 | 1 | 1 | 2 |
| Mk4 | 13.1 | 5.1 | 9.3 | 1.3 | 28.7 | 8 | 9 | 7 | 4 | 9 |
| FFWI | 14.2 | 6.2 | 12.6 | 0.0 | 33.1 | 7 | 8 | 5 | 5 | 8 |
| F | 11.5 | 7.1 | 17.7 | -0.1 | 36.2 | 9 | 6 | 3 | 6 | 7 |
| N | 63.6 | 19.1 | 7.4 | -4.4 | 85.8 | 3 | 2 | 8 | 9 | 5 |
| IPi | 23.8 | 11.2 | 9.6 | -0.6 | 44.0 | 6 | 5 | 6 | 7 | 6 |
| IFI | 77.8 | 24.6 | 23.4 | -2.9 | 122.9 | 2 | 1 | 2 | 8 | 1 |
Logistic regression
The set of logistic regression models and the related statistics calculated using the different combination of predictive and dependent variables (fire activity indicators) is showed in Tab. 4. All the logistic regression models were significant (p<0.001) after Wald’s test, indicating that all models were more accurate than the null model, and that all predictors were significantly related with the outcome variables (OFD, MFD, LFD, LAFD). The usefulness of the explanatory variables in predicting the response variable was also evaluated by the Nagelkerke’s R2, which reflects the amount of variation in fire activity indexes accounted for by the models. The models developed using FWI, IFI and Mk5 as predictors had the highest values of the Nagelkerke’s R2, in particular when FD (R2 = 0.6-0.7) and MFD (R2 = 0.4-0.5) were included (Tab. 4). Lower values were obtained for the fire activity indicators LAFD and LFD, though IFI, FWI and Mk5 indexes still yielded the best results.
Tab. 4 - Logistic regression model statistics obtained for the dependent variables fire days (OFD), multiple fire days (MFD), large fire days (LFD), and large area fire days (LAFD) using the values of the fire danger indexes tested in this study as predictors. (A): All regression models showed significant (p<0.001) values of the Wald’s statistics for both the constant term and the predictor variables; (B): values of the chi-square statistics marked with an asterisk (*) are significant after the Hosmer-Lemeshow test (p>0.01), thus rejecting the null hypothesis of lack of fit.
| Output Variable |
FD Index (predictor) |
Constant (A) (B ± SE) |
Predictor (A) (B ± SE) |
Nagelkerke R2 |
Hosmer- Lemeshow χ2 |
c-statistic |
|---|---|---|---|---|---|---|
| OFD | IFI | -5.309 ± 0.083 | 0.101 ± 0.002 | 0.57 | 90.6 | 0.89 |
| FWI | -4.136 ± 0.065 | 0.165 ± 0.006 | 0.66 | 69.77 | 0.93 | |
| Mk5 | -3.323 ± 0.05 | 0.189 ± 0.003 | 0.60 | 531.9 | 0.92 | |
| Mk4 | -2.698 ± 0.042 | 0.490 ± 0.009 | 0.45 | 561.04 | 0.88 | |
| F | -1.529 ± 0.038 | 0.057 ± 0.002 | 0.07 | 259.96 | 0.66 | |
| FFWI | -1.772 ± 0.039 | 0.078 ± 0.002 | 0.12 | 518.6 | 0.71 | |
| KBDI | -2.361 ± 0.039 | 0.045 ± 0.001 | 0.37 | 742.71 | 0.84 | |
| IPi | -2.451 ± 0.038 | 0.401 ± 0.008 | 0.48 | 1171.5 | 0.90 | |
| N | -1.740 ± 0.028 | 0.144 ± 0.003 | 0.46 | 1775.8 | 0.90 | |
| MFD | IFI | -6.194 ± 0.107 | 0.084 ± 0.002 | 0.45 | 53.93 | 0.89 |
| FWI | -5.129 ± 0.092 | 0.129 ± 0.006 | 0.48 | 116.36 | 0.91 | |
| Mk5 | -3.728 ± 0.056 | 0.106 ± 0.002 | 0.40 | 459.97 | 0.90 | |
| Mk4 | -3.134 ± 0.047 | 0.274 ± 0.007 | 0.27 | 644.83 | 0.87 | |
| F | -2.634 ± 0.048 | 0.058 ± 0.002 | 0.07 | 243.11 | 0.69 | |
| FFWI | -2.743 ± 0.048 | 0.068 ± 0.003 | 0.09 | 435.34 | 0.73 | |
| KBDI | -3.279 ± 0.055 | 0.037 ± 0.001 | 0.22 | 619.06 | 0.79 | |
| IPi | -2.716 ± 0.038 | 0.153 ± 0.004 | 0.26 | 1029.4 | 0.88 | |
| N | -2.482 ± 0.034 | 0.057 ± 0.001 | 0.25 | 1228.9 | 0.87 | |
| LFD | IFI | -8.308 ± 0.228 | 0.086 ± 0.003 | 0.33 | 6.79 * | 0.90 |
| FWI | -6.885 ± 0.181 | 0.123 ± 0.01 | 0.33 | 15.12 * | 0.91 | |
| Mk5 | -5.109 ± 0.097 | 0.084 ± 0.003 | 0.29 | 103.78 | 0.90 | |
| Mk4 | -4.402 ± 0.076 | 0.200 ± 0.008 | 0.19 | 207.68 | 0.88 | |
| F | -4.416 ± 0.086 | 0.071 ± 0.004 | 0.09 | 96.23 | 0.75 | |
| FFWI | -4.385 ± 0.084 | 0.073 ± 0.004 | 0.09 | 140.8 | 0.77 | |
| KBDI | -4.501 ± 0.1 | 0.030 ± 0.002 | 0.10 | 232.45 | 0.75 | |
| IPi | -3.788 ± 0.058 | 0.078 ± 0.004 | 0.12 | 458.24 | 0.85 | |
| N | -3.802 ± 0.06 | 0.039 ± 0.002 | 0.12 | 390.56 | 0.85 | |
| LAFD | IFI | -8.229 ± 0.255 | 0.078 ± 0.003 | 0.27 | 12.62 * | 0.88 |
| FWI | -6.965 ± 0.199 | 0.113 ± 0.011 | 0.28 | 4.13 * | 0.89 | |
| Mk5 | -5.465 ± 0.114 | 0.080 ± 0.003 | 0.25 | 57.32 | 0.88 | |
| Mk4 | -4.700 ± 0.087 | 0.178 ± 0.008 | 0.17 | 99.02 | 0.86 | |
| F | -4.844 ± 0.102 | 0.070 ± 0.004 | 0.09 | 31.29 | 0.74 | |
| FFWI | -4.772 ± 0.099 | 0.070 ± 0.004 | 0.08 | 53.25 | 0.75 | |
| KBDI | -4.970 ± 0.124 | 0.031 ± 0.002 | 0.09 | 130.33 | 0.76 | |
| IPi | -4.186 ± 0.069 | 0.073 ± 0.004 | 0.11 | 208.24 | 0.85 | |
| N | -4.193 ± 0.073 | 0.037 ± 0.002 | 0.10 | 265.18 | 0.83 |
The accuracy of the models in predicting the observed values of fire activity indicators is reported in Tab. 4. The Holmer-Lemeshow test revealed no significant differences between observed and expected probabilities only using IFI and FWI as predictors and LAFD and LFD as independent variables. All the other models did not adequately fit the outcome variables after the Hosmer-Lemeshow’s test (Tab. 4).
Most of the models showed values of the c-statistic above the threshold of 0.9, indicating a high accuracy in assigning the higher probabilities to the fire activity indicator events (Tab. 4). However, the higher values of c-statistic were observed for all the fire activity indicators using the indexes IFI, FWI, Mk5, Mk4, IPi, and N as predictors.
The IFI index showed the best accuracy for all fire activity indicators and over the entire index range (Fig. 6). FWI showed a good accuracy for OFD, but a strong overestimation of the observed probability for MFD, LFD, and LAFD at index values greater than 45 (Fig. 6).
Fig. 6 - Estimated (solid line) vs. observed (points) probabilities obtained by the logistic model developed using IFI (a) and FWI (b) indexes as predictor variable of the fire activity indicators. (OFD): days with fires; (MFD): multiple fire days; (LFD): large fire days; (LAFD): large average fire days.
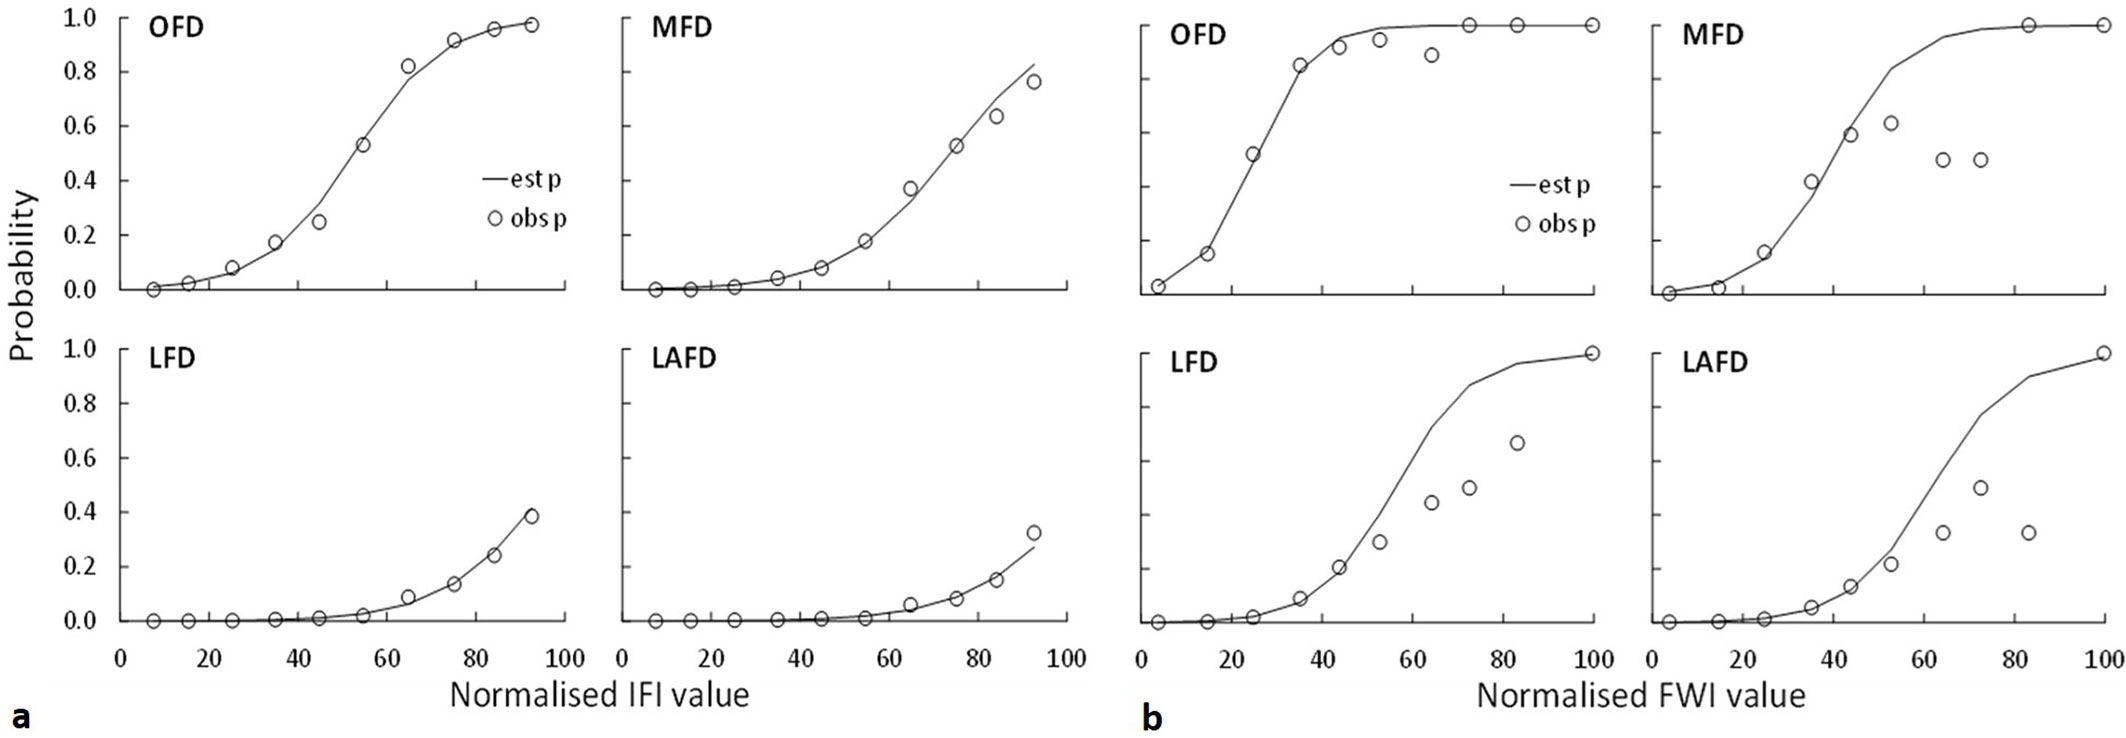
Model comparison showed that the best fitting models were those including IFI and FWI as predictors of LAFD and LFD. Regarding OFD and MFD, the different explanatory variables provided closest results, and even the models Mk5, IPi, and F showed a significant fit to observations.
Discussion and conclusions
In this study we applied a statistical approach to assess the ability of fire danger indexes to predict fire occurrence. This issue is still quite debated and the scientific fire community is far from a shared and standardized solution to this problem.
Eight fire danger indexes were arbitrarily chosen and a posteriori evaluated for their ability to represent the observed fire activity on daily basis in a typical Mediterranean area. Seven of these indexes are typically weather-based indexes, thus requiring only weather observations as input data. Contrastingly, the IFI index requires also fuel structure and fuel moisture information. In the analysis we assumed that the performance of a fire danger index is good when the fire danger index value (or the related fire danger class) increases when the observed fire activity (expressed as fire activity indicators) increases.
Although not all the statistical tests indicated the same FD index ranking, several indexes clearly exhibited better performances. The overall results indicate that IFI and FWI well estimate the observed fire occurrence. As mentioned above, the majority of the FD indexes are weather-based (do not account for ignitions); nevertheless, the correlation analysis confirmed the good performance of all indexes to represent ignitions (P1 indicator), despite a large part of fires in Sardinia are human-caused and about half of fire ignitions are classified as arson ([34], Sardinia Forest Service, personal communication). Hence, it could be hypothesized that a correlation exists between arsonists activity and FD conditions in the study area.
The high predictive potential of FWI was confirmed in a recent work which analysed wildland fire data from Sardinia (Italy) and Corsica (France) using non-parametric statistical models to understand the interactive effects of anthropogenic and weather variables on spatio-temporal patterns of fire occurrence and size in relation to weather, land use, anthropogenic features, and time of the year. They found that the FWI has a relevant predictive value in discriminating the days with high fire potential. Also, Urbieta et al. ([43]) highlighted that FWI had good ability in predicting fire activity in a study carried out in 5 southern countries of the European Union and the Pacific Western coast of the USA.
In this study, the IFI index showed the best performance over all the analyses carried out, showing a good association between observed and predicted probabilities for all the fire activity indicators over the entire FD range. The results of the logistic regression models suggested that IFI and FWI had similar performance in estimating the fire activity indicators, both at low (OFD, MFD) and high (LFD, LAFD) fire activity conditions. The Nagelkerke R2 values observed, ranging from 0.4 to 0.7 for both IFI and FWI, are slightly higher than those (0.00-0.54) obtained by Martell et al. ([20]) and similar to those (0.25-0.77) reported by Padilla & Vega-García ([28]). The chi-square values provided by the Hosmer-Lemeshow test for both IFI and FWI, are similar to the values reported by Vicente López & Crespo Abril ([46]) during the validation of a wildland fire danger (WFD) index developed in the community of Valencia (Spain). In Mediterranean areas FWI was successfully tested, although some authors ([9]) argued that the absence or the rare presence of deep fuel layers (related to the DC and DMC submodules of the FWI) can partially reduce the performance of the FWI in these areas.
From an operational point of view, our results revealed that IFI and FWI yielded better predictions than the other indexes. IFI had slightly better results than FWI, but its application outside the case study area requires a careful evaluation of input data, in particular for the Fuel Code parametrization. On the other hand, our results confirmed previous studies indicating that the widely used FWI index is suitable for an operational use in Sardinia, a typical fire-prone Mediterranean region. Therefore, a combined use of both IFI and FWI in a short-term fire danger forecast chain would be complementary and useful for FD analysis and the evaluation by fire managers.
Acknowledgements
This work was partially funded by: (i) the Italian Ministry of Education University and Research (MIUR), National Research Project PRIN: “Climate change mitigation strategies in tree crops and forestry in Italy (CARBOTREES)” (prot. 201049EXTW); (ii) the Italian Ministry of Education University and Research (MIUR), “Gemina” Project (grant agreement 232/2011); (iii) the Regional Government of Sardinia, LR7/2007, project “EXTREME - Messa a punto di metodologie e sistemi di supporto per la valutazione del rischio di incendio in condizioni meteorologiche estreme” (CRP-25405).
References
Gscholar
Gscholar
Gscholar
Gscholar
Gscholar
CrossRef | Gscholar
Gscholar
CrossRef | Gscholar
Gscholar
Online | Gscholar
Gscholar
Gscholar
Authors’ Info
Authors’ Affiliation
Donatella Spano
Dipartimento di Agraria, University of Sassari. v.le Italia 39, I-07100 Sassari (Italy)
Michele Salis
Donatella Spano
CMCC - Centro Euro-Mediterraneo sui Cambiamenti Climatici, IAFES Division. v. de Nicola 9, I-07100 Sassari (Italy)
Bachisio Arca
Pierpaolo Duce
CNR IBIMET - Institute of Biometeorology, National Research Council, traversa La Crucca 3, I-07100 Sassari (Italy)
Corresponding author
Paper Info
Citation
Sirca C, Salis M, Arca B, Duce P, Spano D (2018). Assessing the performance of fire danger indexes in a Mediterranean area. iForest 11: 563-571. - doi: 10.3832/ifor2679-011
Academic Editor
Enrico Marchi
Paper history
Received: Nov 08, 2017
Accepted: Jun 23, 2018
First online: Sep 01, 2018
Publication Date: Oct 31, 2018
Publication Time: 2.33 months
Copyright Information
© SISEF - The Italian Society of Silviculture and Forest Ecology 2018
Open Access
This article is distributed under the terms of the Creative Commons Attribution-Non Commercial 4.0 International (https://creativecommons.org/licenses/by-nc/4.0/), which permits unrestricted use, distribution, and reproduction in any medium, provided you give appropriate credit to the original author(s) and the source, provide a link to the Creative Commons license, and indicate if changes were made.

Web Metrics
Breakdown by View Type
Article Usage
Total Article Views: 64200
(from publication date up to now)
Breakdown by View Type
HTML Page Views: 41920
Abstract Page Views: 4327
PDF Downloads: 3645
Citation/Reference Downloads: 29
XML Downloads: 14279
Web Metrics
Days since publication: 2842
Overall contacts: 64200
Avg. contacts per week: 158.13
Article Citations
Article citations are based on data periodically collected from the Clarivate Web of Science web site
(last update: Mar 2025)
Total number of cites (since 2018): 16
Average cites per year: 2.00
Publication Metrics
by Dimensions ©
Articles citing this article
List of the papers citing this article based on CrossRef Cited-by.
Related Contents
iForest Similar Articles
Technical Reports
Comparison of fire danger indices in the Mediterranean for present day conditions
vol. 5, pp. 197-203 (online: 02 August 2012)
Research Articles
Modeling human-caused forest fire ignition for assessing forest fire danger in Austria
vol. 6, pp. 315-325 (online: 16 July 2013)
Research Articles
Fire occurrence zoning from local to global scale in the European Mediterranean basin: implications for multi-scale fire management and policy
vol. 9, pp. 195-204 (online: 12 November 2015)
Research Articles
Wildfire risk and its perception in Kabylia (Algeria)
vol. 11, pp. 367-373 (online: 04 May 2018)
Research Articles
Probabilistic prediction of daily fire occurrence in the Mediterranean with readily available spatio-temporal data
vol. 10, pp. 32-40 (online: 06 October 2016)
Research Articles
Forest fire occurrence modeling in Southwest Turkey using MaxEnt machine learning technique
vol. 17, pp. 10-18 (online: 02 February 2024)
Research Articles
Post-fire recovery of the plant community in Pinus brutia forests: active vs. indirect restoration techniques after salvage logging
vol. 11, pp. 635-642 (online: 04 October 2018)
Research Articles
Harmonized dataset of surface fuels under Alpine, temperate and Mediterranean conditions in Italy. A synthesis supporting fire management
vol. 13, pp. 513-522 (online: 13 November 2020)
Short Communications
Upscaling the estimation of surface-fire rate of spread in maritime pine (Pinus pinaster Ait.) forest
vol. 7, pp. 123-125 (online: 13 January 2014)
Research Articles
The economic value of fire damages in Tuscan agroforestry areas
vol. 14, pp. 41-47 (online: 14 January 2021)
iForest Database Search
Search By Author
Search By Keyword
Google Scholar Search
Citing Articles
Search By Author
Search By Keywords
PubMed Search
Search By Author
Search By Keyword


