Density management diagrams for sweet chestnut high-forest stands in Portugal
iForest - Biogeosciences and Forestry, Volume 10, Issue 6, Pages 865-870 (2017)
doi: https://doi.org/10.3832/ifor2411-010
Published: Nov 06, 2017 - Copyright © 2017 SISEF
Research Articles
Abstract
This study aims to develop stand density management diagrams (SDMDs) for pure even-aged high-forest stands of sweet chestnut in Portugal, defining the appropriate upper and lower limits of growing stock while considering the biological, technological and economic objectives that are expected for these stands. The SDMDs were developed with data collected from high-forest stands in northern Portugal, which is the main representative area of these stands in the country. Data were collected from 23 pure even-aged permanent plots with re-measurement intervals of 4-10 years, 43 semi-permanent plots and 18 even-aged temporary plots; all plots were established in chestnut high-forest stands with a broad range of ages. SDMDs were constructed by simultaneously fitting four nonlinear equations relating stand variables using the full information likelihood technique. SDMDs for the estimation of stand total volume, stand stem biomass, stand total aboveground biomass, and carbon content in aboveground biomass are presented as bivariate graphs with dominant height on the x-axis and the number of trees per hectare on the y-axis (using logarithmic scale). A tool is made available to define an optimal range of stand density for a silviculture oriented to single-stem selection on a tree-by-tree basis, focusing management on the most valuable trees. This tool is aimed to support forest managers in the decision-making process, enabling them to schedule thinnings on the basis of the dominant height growth of the trees with the greatest potential (frame trees), maintaining an adequate growing stock and assessing the corresponding aboveground wood volume, biomass, carbon, and mean diameter breast height.
Keywords
Castanea sativa Mill., Stand Density, Thinning, Biomass, Site Index, Dominant Height, Forest Management
Introduction
The area of the sweet chestnut (Castanea sativa Mill.) in Portugal increased remarkably over the last two decades under the Community Support Frameworks that have served as the primary funding sources for afforestation. The success of these funds is demonstrated by the sweet chestnut’s contemporary afforestation rate in Portugal, northern Spain and France, estimated at 4500 ha year-1 ([1]). The private sector has been the driving force behind this increase in sweet chestnut afforestation area because there is an increasing trend toward high-quality wood production that, when combined with non-wood forest products and ecosystems services, can become a profitable investment for forest owners. In Europe, the woodland area of sweet chestnut devoted to timber production has been estimated at 1.78 million hectares ([8]). In Portugal, the species covers an area slightly larger than 40.000 ha ([12]), but young plantations are poorly sampled. A considerable number of recent plantations (almost 10.000 hectares in the Bragança region between 1994 and 2000) have been established with the purpose of being managed as high-forest stands for high-quality timber production. However, many of these sweet chestnut stands, now in their twenties, lack proper tending. The management model recommended for these areas is different from the usual models for orchards or coppices, and it is oriented, in many situations, toward a silviculture system that provides other forest functions beyond the production of valuable wood. These stands, while promoting forest compartment, reduce the risk of wildfires, increase the diversity of the forest mosaic and habitats and improve landscape aesthetics. This fulfills the recommendations of the Portuguese National Forest Strategy ([10]) concerning the specialization of Portuguese forest territories.
The only known old chestnut high-forest stands in northern Portugal were studied to analyze the species productive potential ([21]). These stands are located in communal areas under collaborative management with the National Forest Service. These old growth sweet chestnut high-forest stands are healthy and are already older than the optimal rotation age; thus, the maximum sustainable revenue and the decrease in stumpage value are offset by other functions of the forest. Although there may be the so-called “memory problem” ([9], [13]) associated with changes in stand structure over time ([3]), these sweet chestnut woodlands are a legacy for forest management and can be studied to develop tools for sustainable management. Young stands are mostly found on land belonging to private landowners. In both situations, the development of practical tools to assist in sustainable forest management in these areas would be very useful. Stand density management diagrams (SDMDs) are an example of such a tool: they are intuitive graphical models of even-aged stands dynamics and reflect the fundamental relationships among tree size, stand density, site occupancy and self-thinning ([13], [17]). The diagrams are constructed by characterizing the growing stock, using indices that relate the average tree size (e.g., mean weight, volume, height or diameter) to density (e.g., number of trees per hectare - [3]). The most commonly used density indices are the stand density index ([23]), the self-thinning rule ([26]), the relative density index ([9]), and the relative spacing index ([7], [11]).
SDMDs have been widely used because of their utility in terms of the design, development and evaluation of alternative density management regimes for even-aged stands ([20]). Managing density involves manipulating and controlling the growing stock to achieve specific management objectives ([15]). Manipulating stand density by thinning will affect stand structure, yield, tree size, and rotation length. According to Long ([16]), thinning is probably the single most influential activity a silviculturist can perform between successive regeneration periods; thus, it is often the most effective technique for achieving a wide range of stand management objectives. In areas where silvicultural practice must be implemented under severe budget limitations, SDMDs can be a cost-effective approach for the management ([25]). SDMDs have been constructed for several forest species worldwide to achieve diverse management objectives. For traditional broadleaved species SDMDs are available, for example, for Quercus robur ([3]), Q. pyrenaica ([5]), and Castanea sativa coppices ([19]). In general, these tools are less available for broadleaves than for conifers.
Despite the economic, ecological, and social importance of the sweet chestnut, high-forest system management tools for quality timber production are not numerous, which justifies an increase in growth and yield research. Additionally, public administration and stakeholders are demanding management tools to implement and optimize the effective management of chestnut high-forest woodlands in terms of profitability and sustainability.
The main aim of the present study is to develop practical SDMDs for pure even-aged high-forest stands of sweet chestnut in Portugal, defining the appropriate upper and lower limits of growing stock for a silviculture based on single-stem selection on a tree-by-tree basis, thus maximizing individual-tree value and promoting the development of natural regeneration and site sustainability. These tools would support forest managers in the decision-making process, enabling them to schedule thinnings based on the dominant height growth of the trees with the greatest potential (frame trees); maintain an accurate growing stock; and assess the corresponding aboveground wood volume, biomass, carbon, and mean diameter breast height.
Material and methods
Data
Data were collected from a network of 23 pure even-aged permanent plots composed of young and mature chestnut high-forest stands with re-measurement intervals of 4-10 years, 43 semi-permanent plots (each plot was measured at least twice) and 18 even-aged temporary plots, all established in old-growth chestnut high-forest stands. Plot dimensions ranged from 100 to 3000 m2, and ages ranged from 4 to 73 years. The plots covered the existing range of sites, ages and stand densities most representative of sweet chestnut stands in North Portugal. The soils in the stands have developed over metamorphic rocks (schist). Total height (h) and diameter at breast height (d) were measured for all trees inside the plots. Descriptive statistics for the main stand variables are reported in Tab. 1.
Tab. 1 - Summary statistics for the stand variables. (hdom): stand dominant height; (t): stand age; (N): number of trees per hectare; (dg): quadratic mean diameter; (V): stand total volume; (Ws): stand stem biomass; (WT): stand total aboveground biomass; (SD): standard deviation.
| Parameter | Variables (units) | ||||||
|---|---|---|---|---|---|---|---|
| hdom (m) |
t (years) |
N (trees ha-1) |
dg (cm) |
V (m3 ha-1) |
Ws (Mg ha-1) |
WT (Mg ha-1) |
|
| Mean | 17.3 | 42 | 759 | 24.3 | 284.16 | 140.23 | 180.41 |
| Maximum | 29.9 | 73 | 2133 | 53.6 | 798.27 | 386.92 | 502.81 |
| Minimum | 2.5 | 4 | 157 | 1.5 | 0.10 | 0.10 | 0.10 |
| SD | 9.5 | 26 | 410 | 16.0 | 255.55 | 125.45 | 161.94 |
The dominant height of each stand (hdom) was computed as the average height of the 100 thickest trees per hectare ([2]). The stand total volume (V) was calculated by calculating and summing the individual-tree volume (v) inside each plot using the individual-tree volume equation from Patrício ([21]): v = 0.015160 + 0.0000324 d2h (R2adj = 0.98; RMSE = 0.00057 m3; d - cm; h - m; v - m3 tree-1). V (m3 ha-1) was obtained by extrapolation methods that varied with plot area. Similarly, the stand stem biomass (Ws) and the stand total aboveground biomass (WT) were calculated using the individual-tree equations developed by Patrício ([21]) for the sweet chestnut with data collected from the same stands used in the present study. Parameter estimates for these equations were obtained from a simultaneous fit using iterative seemingly unrelated regression (ITSUR - eqn. 1 to eqn. 5):
where d (cm) and h (m) are defined as before and wL, wBr, wB, wS_u, and wTot are individual-tree biomass from leaves, branches, bark (of the stem), stem under the bark and total aboveground biomass, respectively (kg). The biomass of the stem over the bark (ws) was obtained by adding the results of eqn. 3 and eqn. 4. Finally, Ws and WT (Mg ha-1) were calculated as the sum of the values predicted for individual trees (from ws and wTot) by using a scaling-up approach.
SDMD construction
The stand density management diagram proposed in this study included the relative spacing index (RS) and a system of four nonlinear equations as basic components.
The RS was chosen to characterize the growing stock level. Under the assumption of square spacing, expressing RS as a percentage was obtained using eqn. 6, where N is the number of trees per hectare and hdom is the dominant height:
Several authors have articulated why RS is a useful and efficient index to characterize growing stock levels in SDMDs ([3], [6]). For example, RS is independent of site quality and stand age, except in very young stands. Additionally, dominant height is one of the best criteria for determining thinning intervals from a biological point of view, and the association between dominant height growth and forest production adds further utility to SDMDs used for forest management purposes. Furthermore, in the specific case of sweet chestnut, the silvicultural model proposed by Bourgeois et al. ([4]) for producing high-quality timber in pure even-aged high-forest stands outlined recommendations for thinning according to the height growth of frame trees.
In the proposed SDMD, the y-axis contains the number of trees per hectare (N), and the x-axis shows the dominant height (hdom). The first step for the construction of the diagram consisted in fitting a system of four nonlinear equations (eqn. 7 to eqn. 10):
Equations 7-10 were simultaneously fitted using the full information likelihood technique implemented in the MODEL procedure of SAS/ETS® ([24]). The procedure was selected to address the problem of dependent regressors, often called simultaneous equation bias ([24]).
The second step in the construction of the SDMD consisted of calculating and drawing the isolines for the growing stock level (represented by RS), as well as for the stand variables: quadratic mean diameter (dg), stand volume (V), stand stem biomass (Ws), and stand total above-ground biomass (WT). These isolines were obtained by inverting eqn. 6-eqn. 10 to solve for N, as explained in Barrio-Anta & Alvarez-González ([3]).
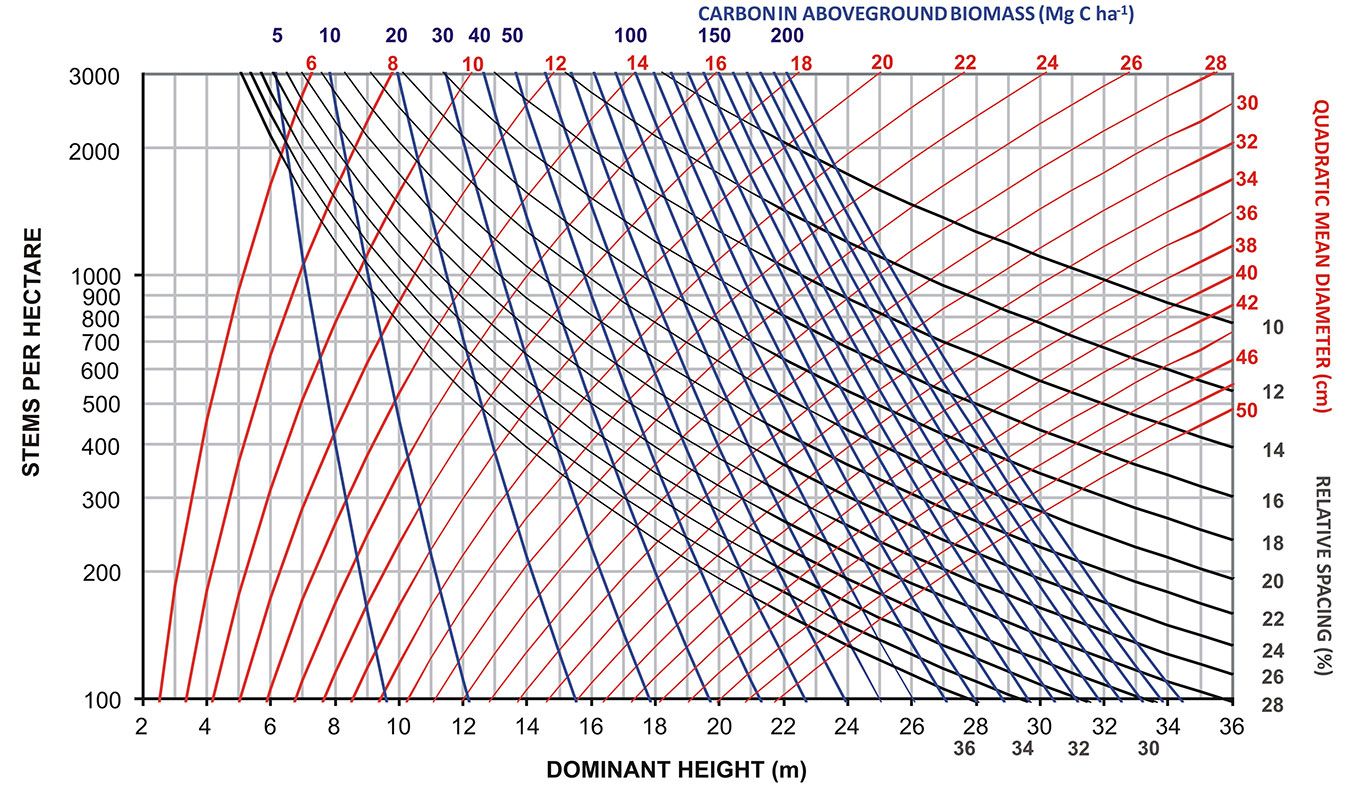
Once the values for stem and total aboveground biomass at the stand level are known, it is possible to convert them to carbon content (C in Mg ha-1). In our study, this was done using a conversion factor of 0.50.
Results and discussion
After an initial exploratory data analysis, 5 observations were identified as extreme outliers and removed from the data set. Summary statistics for the data used to fit the models, namely, mean, maximum, minimum and standard deviation, are presented in Tab. 1. In Tab. 2, we present the results of fitting the system of nonlinear equations (eqn. 7-eqn. 10).
Tab. 2 - Parameter estimates and statistics from the simultaneous fit of eqn. 7-eqn. 10. Standard deviations of parameter estimates are in brackets. (dfe): residuals degrees of freedom; (RMSE): root mean square error; (FIadj): fit index; (dg): quadratic mean diameter; (V): stand total volume; (Ws): stand stem biomass; (WT): stand total aboveground biomass.
| Variable | Estimates of the coefficients in the models | dfe | RMSE | FI adj | |||
|---|---|---|---|---|---|---|---|
| dg | b0 = 10.26562 (3.6603) | b1 = -0.3082 (0.0289) | b2 = 0.973319 (0.0798) | - | 110 | 3.84 | 0.942 |
| V | b3 = 0.000031 (9.349E-6) | b4 = 2.146777 (0.0966) | b5 = 0.801093 (0.0974) | b6 = 1.018115 (0.0348) | 109 | 14.34 | 0.997 |
| W s | b7 = 0.000019 (5.672E-6) | b8 = 2.039638 (0.0714) | b9 = 0.855506 (0.0692) | b10 = 1.019766 (0.0270) | 109 | 7.87 | 0.996 |
| W T | b11 = 0.000021 (6.094E-6) | b12 = 2.073444 (0.0837) | b13 = 0.867747 (0.0833) | b14 = 1.013969 (0.0300) | 109 | 9.51 | 0.997 |
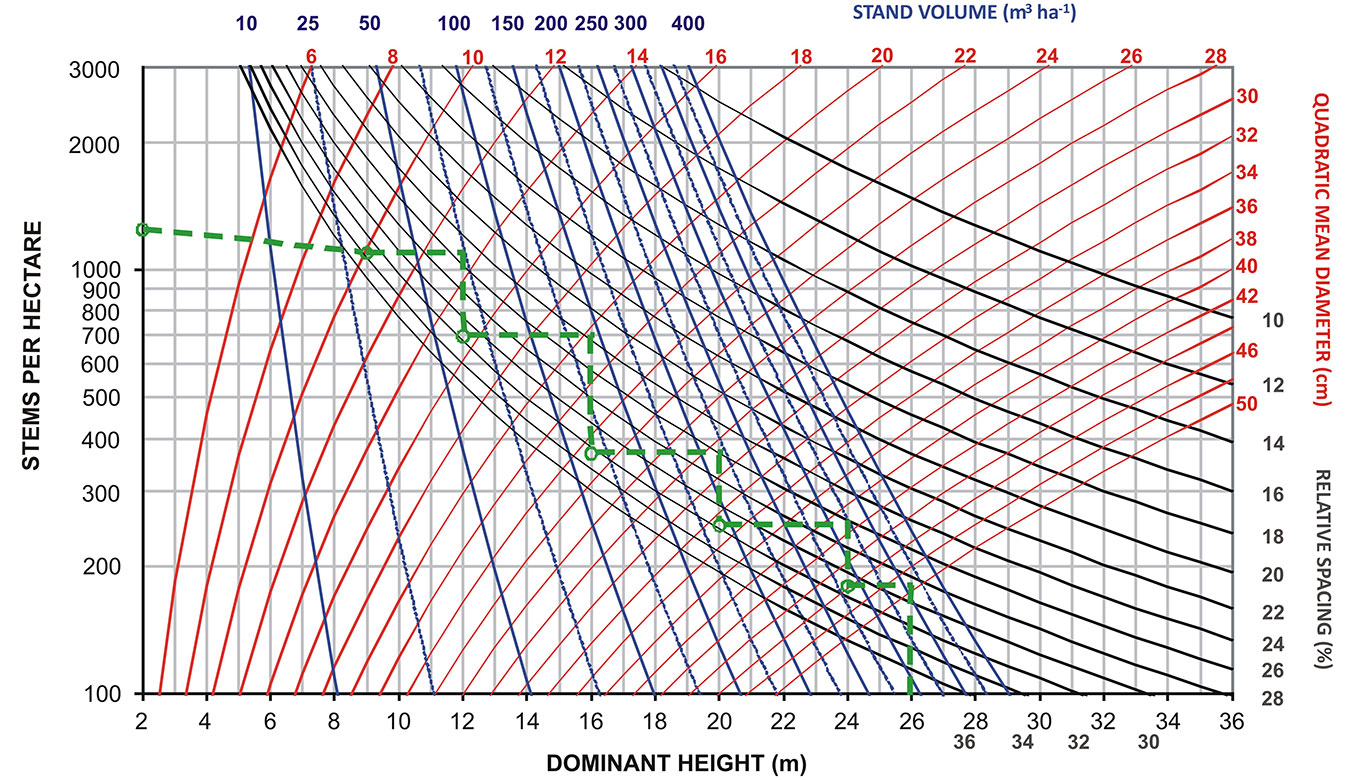
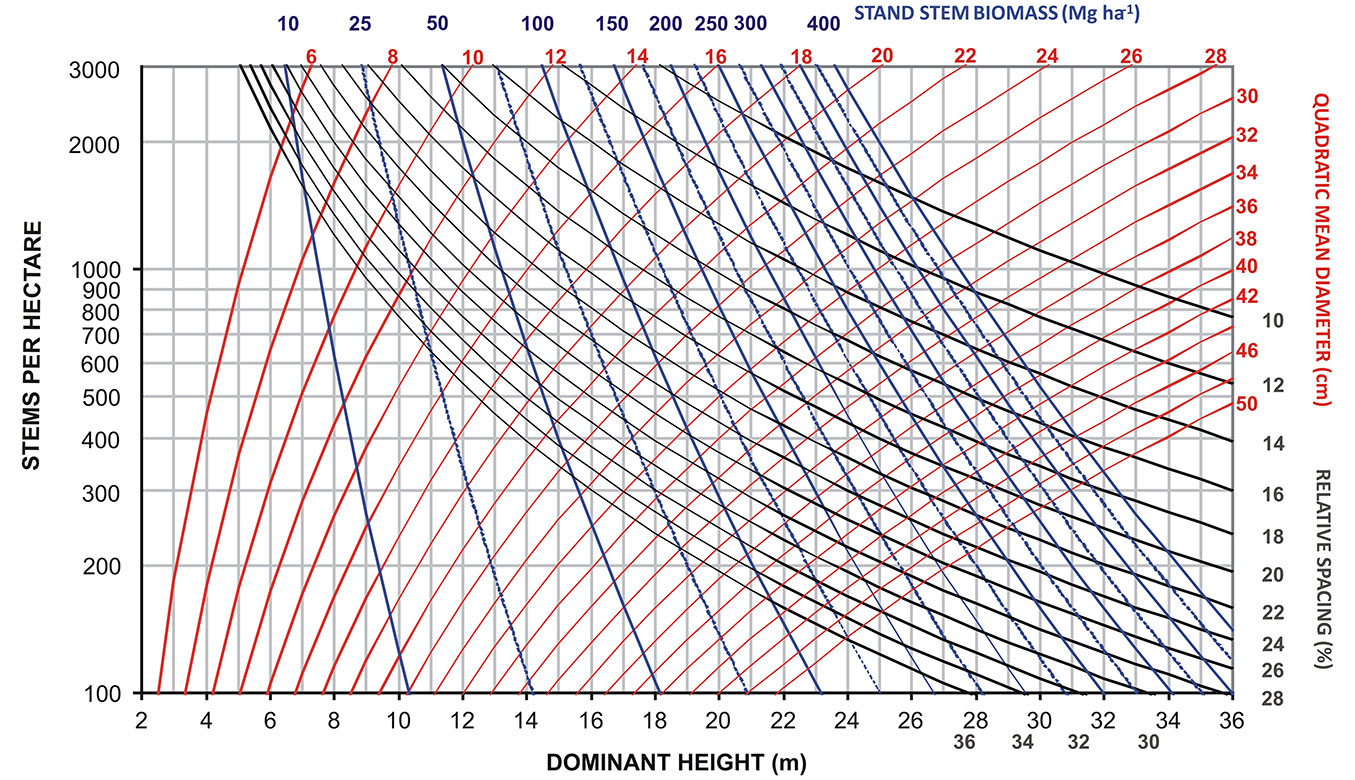
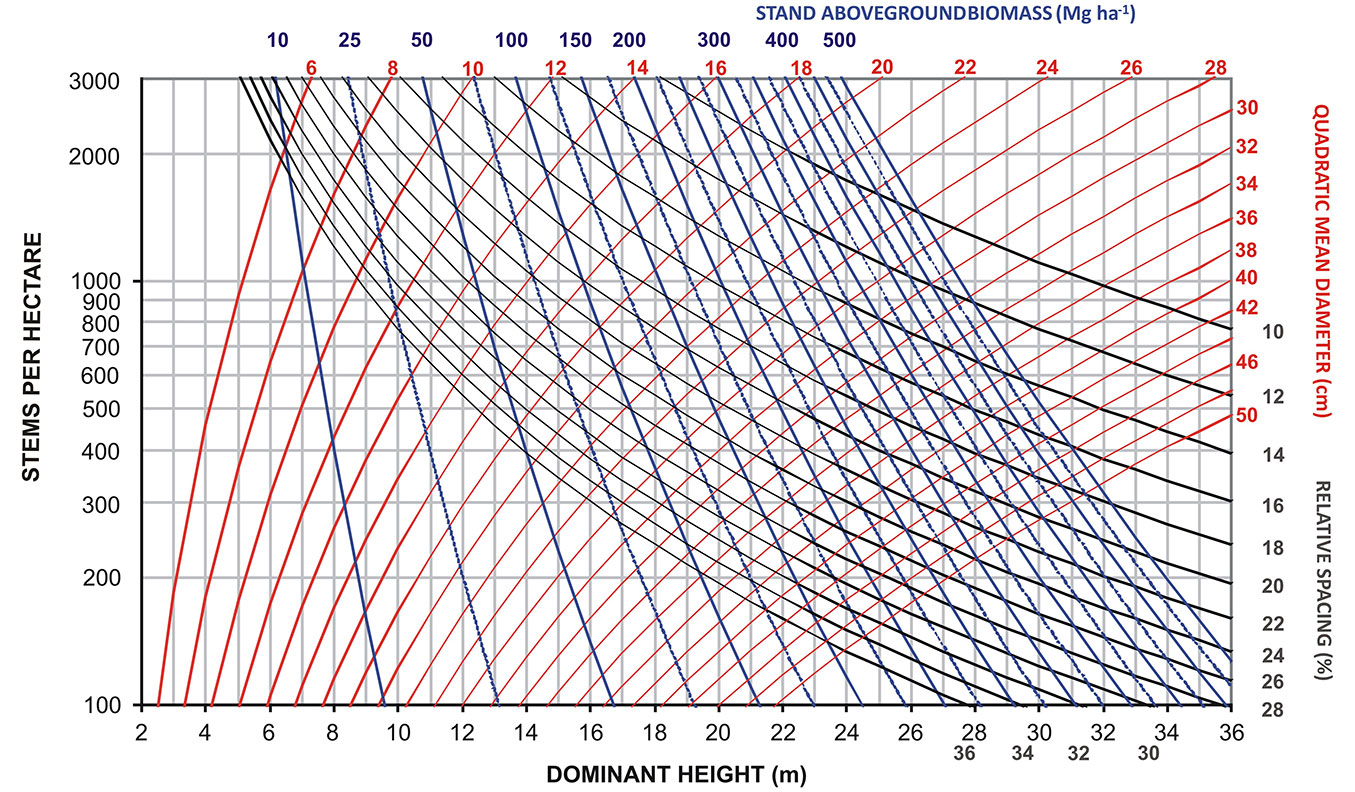
Every parameter was significant at the 1% significance level (p<0.01), and the fit index values (FIadj), a statistic similar to R2adj in linear regression, were all above 94%. Four SDMDs for even-aged high-forest stands of sweet chestnut in Portugal were constructed as bivariate graphs with hdom on the x-axis and N on the y-axis (using logarithmic scale). Isolines of dg and RS are presented in all SDMDs related to the variables V, Ws, WT and C .
In Fig. 1, the SDMD outlines the silvicultural model (dashed line) proposed by Bourgeois et al. ([4]). As previously mentioned, the main goal of this silvicultural model is to produce high-quality timber using the diameter growth of the frame trees (≥ 1 cm year-1) as a reference to achieve the desired diameter (≥ 45 cm) within a reasonable time (i.e., thinnings are intended to improve the growth rate of the frame trees). Until a dominant height of 9 m is reached, a slight decrease in the number of stems per hectare is attributed to natural mortality. From this point on, we assumed that no mortality occurs, which is not inappropriate if silviculture is regularly practiced. With respect to growing stock levels, the silviculture prescribed in the model of Bourgeois et al. ([4]) results in a range of relative spacing index values between 32 (lower limit) and 24 (upper limit). We recommend 32% as the lower limit of growing stock for producing high-quality timber in Portuguese chestnut high-forest stands, according to the existing yield tables ([22]). Below this limit, there will be considerable losses in management efficiency, with negative consequences for stumpage value and potential revenue. Thus, descending below this level should be avoided. Furthermore, below this threshold, there will be increased risk of fire ignition due to the accumulation of combustible vegetable material.
Fig. 1 - Stand density management diagram for chestnut high-forest stands in Portugal for estimation of stand volume (m3 ha-1).
To define the upper limit of growing stock, we simulated a silvicultural model that, according to our experience studying these stands, adequately achieves the objective of high-quality timber production and is representative of a silviculture based on the dominant height growth of the trees with the greatest potential (frame trees). This simulation is presented in Fig. 2 (solid ladder-shaped line), starting with approximately 1250 trees per hectare. The first thinning occurs (pre-commercial thinning) at a dominant height of 11 meters, reducing density to 800 trees per hectare, resulting in a relative spacing of 32%. After this point, the upper limit of growing stock that was most appropriate in achieving a rhythm of thinnings in accordance to wise values of dominant height growth - that allowed obtaining adequate target diameters and number of trees per hectare at the end of the rotation - was the one corresponding to a relative spacing of 26%. Following the simulation (solid ladder-shaped line in Fig. 2), three more thinnings will occur successively, reducing the number of trees per hectare to 530, 350, and approximately 230. Rotation can end when the trees have either a dominant height slightly above 21 meters and a quadratic mean diameter of 36 cm or a dg above 40 cm, allowing management to be flexible according to market opportunities. In these conditions, values of stand stem biomass (Fig. 3), total aboveground biomass (Fig. 4) and total aboveground carbon content (Fig. 5) will achieve values in the ranges of 100-175, 125-225, and 60-110 Mg ha-1, respectively. The thinning cycle is regulated by the height increment of frame trees. A new thinning should occur when there is a 2-2.5 m height increment in young stands. In older or slower growing stands, the gaps between thinnings are extended up to 4 m of height growth. The thinning cycle adjusts to the growth rate of the stand over time, and the considered height increments are consistent with the thinning practice. The usual length of the thinning cycle is shorter in young or fast-growing crops because younger trees react quickly to competition reduction and longer for older or slower growing crops. Because these values are similar to current values within the management practice and the yield tables already available for chestnut high-forest in Portugal ([22]), we suggest that growing stock should adhere to intervals of relative spacing between 32% and 26%. These values are suitable for a silviculture focused on obtaining high revenues from quality timber production in chestnut high-forest stands. These percentages represent the optimal range of densities that will control competition in chestnut stands for high-quality timber production. Moreover, we suggest that practitioners go beyond the simple density reduction suggested by SDMDs by applying a silviculture based on the selection of the best trees in the stands using matrix trees (“accompanying trees”) as a complement of management that will be removed once they hinder the frame trees. Therefore, the management objective is not to maximize volume production per hectare but rather to maximize the growth of valuable single-stems.
Fig. 2 - Simulation of a silvicultural prescription to define lower and upper growing stock limits for chestnut high-forest stands for quality timber production.
Fig. 3 - Stand density management diagram for chestnut high-forest stands in Portugal for estimation of stand stem biomass (Mg ha-1).
Fig. 4 - Stand density management diagram for chestnut high-forest stands in Portugal for estimation of stand aboveground biomass (Mg ha-1).
Fig. 5 - Stand density management diagram for chestnut high-forest stands in Portugal for estimation of carbon content in stand aboveground biomass (Mg ha-1).
Based on our results, a slight modification in the model outlined by Bourgeois et al. ([4]) is proposed (dashed ladder-shaped line in Fig. 2) to adapt the prescribed silviculture to the lower and upper limits of growing stock we defined. If a stand starts with an initial density of 1250 trees per hectare and assuming some natural mortality in young stages, the first thinning would occur at a dominant height of 12 m, reducing the number of trees to 700 per hectare. Once a dominant height of 14.6 m is reached, density will be reduced to 460 trees per hectare, and again, at hdom 17.9 m and 21.9 m, density will be reduced to 305 and 205 trees per hectare, respectively.
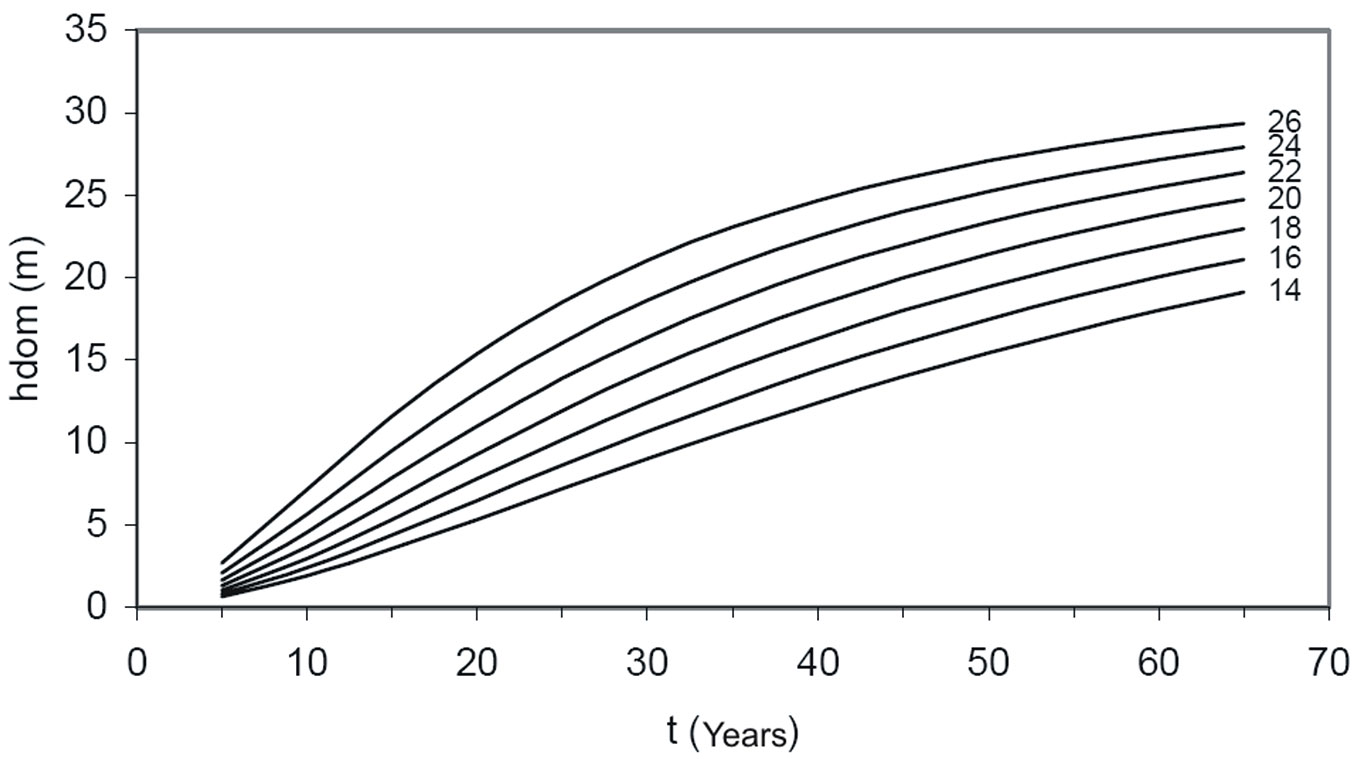
To determine the age at which thinning and harvesting should be carried out, the site index curves developed by Patrício ([21]) can be used. These curves were obtained using an algebraic difference approach (ADA) of the McDill & Amateis ([18]) equation with stem analysis data (eqn. 11):
(FIadj = 0.996; RMSE = 0.46 m) where y2 represents both the dominant height hdom2 at age t2 and the site index at the reference age of 45 years (SI45) and hdom1 represents the dominant height at age t1.
Age of thinning can be obtained by locating the stand height on the dominant height-over-age curves for a given site index (Fig. 6).
Fig. 6 - Site index curves with reference age of 45 years (SI45) for chestnut high-forest stands, established by Patrício ([21]).
The prescribed silviculture for high-forest chestnut based on single-stem selection on a tree-by-tree basis encourages the development of natural regeneration by seed and coppice. However, we recommend favoring the continuity of the stand by the seedling’s natural regeneration process towards site sustainability using the shoots as “accompanying stand” (matrix trees) only. We can select the best trees by crown thinning followed by low thinning in the final stages of stand growth or by the application of the final crop tree thinning. This type of thinning focuses management on the most valuable trees in a stand in order to achieve maximum value per tree, to develop adequate stability of individual trees and to make sure that the best individuals will have the opportunity to regenerate ([14]). The SDMDs now available for chestnut high-forest stands allow managers to set the upper and lower limits within which the density range should occur and estimate the corresponding stumpage value in volume, biomass, carbon and mean breast height diameter dg. The proposed density limits are guidelines for managers to consider when setting thinning regimes; we propose that thinning regimes should focus on single-stem selection on a tree-by-tree basis, enabling best trees to regenerate by seedling and preserving the most valuable trees for final cut, ultimately improving the stand’s quality and revenue.
SDMDs are a helpful tool for management, but the ultimate management tool is the eye of the technician who makes the single-stem selection in the field to identify trees that have the greatest potential.
Acknowledgments
Conception of the study, data analysis, drafting of the manuscript and critical revision: MSP and LN. Contributed materials: MSP. Data used in this study were collected under financial support of AGRO Program, Project 267: Sustainable Management of Chestnut Forested Areas in High-Forest and Coppice Systems, and Project PTDC/AGRCFL/68186/ “Mixed forests: Modeling, dynamics and geographical distribution of productivity and carbon storage in mixed forest ecosystems in Portugal”, funded by the Portuguese Science Foundation (FCT) and FEDER - COMPETE Program.
References
Gscholar
Gscholar
Gscholar
Gscholar
Gscholar
Gscholar
Gscholar
Gscholar
Authors’ Info
Authors’ Affiliation
Luís Nunes
Mountain Research Centre (CIMO), School of Agriculture, Polytechnic Institute of Bragança. Campus de Santa Apolónia, 5300-253 Bragança (Portugal)
Corresponding author
Paper Info
Citation
Patrício MS, Nunes L (2017). Density management diagrams for sweet chestnut high-forest stands in Portugal. iForest 10: 865-870. - doi: 10.3832/ifor2411-010
Academic Editor
Andrea Cutini
Paper history
Received: Feb 15, 2017
Accepted: Aug 11, 2017
First online: Nov 06, 2017
Publication Date: Dec 31, 2017
Publication Time: 2.90 months
Copyright Information
© SISEF - The Italian Society of Silviculture and Forest Ecology 2017
Open Access
This article is distributed under the terms of the Creative Commons Attribution-Non Commercial 4.0 International (https://creativecommons.org/licenses/by-nc/4.0/), which permits unrestricted use, distribution, and reproduction in any medium, provided you give appropriate credit to the original author(s) and the source, provide a link to the Creative Commons license, and indicate if changes were made.
Web Metrics
Breakdown by View Type
Article Usage
Total Article Views: 48842
(from publication date up to now)
Breakdown by View Type
HTML Page Views: 39852
Abstract Page Views: 3067
PDF Downloads: 4805
Citation/Reference Downloads: 21
XML Downloads: 1097
Web Metrics
Days since publication: 3017
Overall contacts: 48842
Avg. contacts per week: 113.32
Article Citations
Article citations are based on data periodically collected from the Clarivate Web of Science web site
(last update: Mar 2025)
Total number of cites (since 2017): 13
Average cites per year: 1.44
Publication Metrics
by Dimensions ©
Articles citing this article
List of the papers citing this article based on CrossRef Cited-by.
Related Contents
iForest Similar Articles
Research Articles
Effects of drought and nutrient deficiency on grafts originating from sound and shaken sweet chestnut trees (Castanea sativa Mill.)
vol. 9, pp. 109-114 (online: 19 July 2015)
Research Articles
Is it needed to integrate mixture degree in Stand Density Management Diagram (SDMD)?
vol. 16, pp. 274-281 (online: 28 October 2023)
Research Articles
Growth dynamics and productivity of pure and mixed Castanea sativa Mill. and Pseudotsuga menziesii (Mirb.) Franco plantations in northern Portugal
vol. 7, pp. 92-102 (online: 18 December 2013)
Research Articles
Assessment of age bias in site index equations
vol. 9, pp. 402-408 (online: 11 January 2016)
Research Articles
Developing a stand-based growth and yield model for Thuya (Tetraclinis articulata (Vahl) Mast) in Tunisia
vol. 9, pp. 79-88 (online: 23 June 2015)
Technical Advances
Forest stand height determination from low point density airborne laser scanning data in Roznava Forest enterprise zone (Slovakia)
vol. 6, pp. 48-54 (online: 21 January 2013)
Research Articles
The effect of the calculation method, plot size, and stand density on the accuracy of top height estimation in Norway spruce stands
vol. 10, pp. 498-505 (online: 12 April 2017)
Research Articles
Does management improve the state of chestnut (Castanea sativa L.) on Belasitsa Mountain, southwest Bulgaria?
vol. 8, pp. 860-865 (online: 27 April 2015)
Research Articles
Density management diagram for teak plantations in Tabasco, Mexico
vol. 10, pp. 909-915 (online: 01 December 2017)
Research Articles
Relationship between environmental parameters and Pinus sylvestris L. site index in forest plantations in northern Spain acidic plateau
vol. 9, pp. 394-401 (online: 16 January 2016)
iForest Database Search
Search By Author
Search By Keyword
Google Scholar Search
Citing Articles
Search By Author
Search By Keywords
PubMed Search
Search By Author
Search By Keyword

