
Potential for utilization of wood ash on coastal arenosols with limited buffer capacity in KwaZulu-Natal and its effect on eucalypt stand nutrition and growth
iForest - Biogeosciences and Forestry, Volume 10, Issue 1, Pages 180-188 (2016)
doi: https://doi.org/10.3832/ifor2146-009
Published: Nov 19, 2016 - Copyright © 2016 SISEF
Research Articles
Abstract
A field trial was established to test the effects of various wood ash and fertilizer application rates on the nutrition and early growth of a clonal Eucalyptus grandis × urophylla stand near Richards Bay, KwaZulu-Natal province, South Africa. The trial consisted of wood ash treatments of 0, 0.3, 0.6 and 1.2 t ha-1, combined with fertilizer treatments of no fertilizer (control), 150 g tree-1 of conventional ammonium sulphate fertilizer or 320 g tree-1 of controlled release fertilizer mixture containing N, P and a balanced suite of several plant nutrients. The experiment was conducted on a young sandy soil of aeolian origin with a very low buffer capacity. Ash application rates were chosen after a pilot study was conducted to test the effect of CaCO3 on the soil reaction. At 4 and 8 months after treatment, soil heavy metal concentrations for cadmium (Cd), mercury (Hg), chromium (Cr) and lead (Pb) levels were substantially lower than toxic levels. Foliar heavy metal concentrations (for the same elements) were less than 1mg kg-1 at both time intervals. The wood ash induced a temporary liming effect up to 8 months after application. Foliar nutrient assessments revealed sub-optimal nutrient concentrations for phosphorous (P), potassium (K) and zinc (Zn) at 4 months and K at 8 months of age. The positive growth responses (expressed as a biomass index) at 8 months, ranged between 13% and 683% relative to the untreated control. At 21 months, the growth response to ash and fertilizer combinations ranged from -0.5% to 50% relative to the control. This research demonstrated that 1.2 t ha-1 of wood ash can safely be disposed of on a typical, poorly buffered Zululand coastal sand with little environmental risk and minimal growth suppression, provided that it is balanced with an appropriate NPS plus trace element fertilizer mixture.
Keywords
Wood Ash, Eucalyptus grandis × urophylla, Stand Nutrition, Entisol, Heavy Metals, Fertilizer
Introduction
The processing and manufacturing of timber and timber-related products is energy intensive. As an approach to reduce the high costs of energy, commercial and privately owned companies have turned to the combustion of by-products from the manufacturing chain to generate heat and power. Sawmills and paper mills make use of foliage, branch wood, stem wood and bark biomass for energy generation ([13]). The combustion of these materials is favored due to the relatively low wood ash generation of the materials ([31], [20]). In South Africa, wood ash is generally stored on landfills. Increasing storage costs and tightening environmental laws have made it essential for companies to investigate alternative disposal methods. Wood ash contains substantial quantities of nutrients and has the potential to partly substitute nutrients removed per rotation from tree harvesting, with the exception of N ([23], [31]). In addition, wood ash induces a liming effect once introduced to a soil and is attributed to the substantial quantities of carbonates, hydroxides, oxides and other calcium containing minerals in the ash ([24]). Wood ash has the potential to increase the productivity and growth of natural and plantation forests. Its application has been tested extensively on forest soils with low pH and moderate to high buffer capacities, but very limited research has been done on sandy soils with low buffer capacity and pH>5 ([16], [6], [25], [33], [34], [35]).
In step with the international legislation, the South African National Environmental Management: Waste Act (South Africa Act No. 59 of 2008) classifies wood ash as a Level 2, i.e. Major Waste; this is due to the occurrence of heavy metals such as Cd, Pb, arsenic (As), selenium (Se), nickel (Ni) and Cr ([31], [2]). However, pure wood ash contains lower heavy metal concentrations relative to coal and boiler fired ash, and is better suited to land applications ([12], [31], [2]). The potential risks of heavy metal contamination, water contamination, immobilisation and volatilisation of essential macro and micro nutrients and possible nutrient imbalances is greatly influenced by site conditions, soil properties, wood ash application rate and abiotic factors ([6], [31]). It is evident from the reviewed literature that the effects of wood ash applications on stand nutrition and development tends to be highly site-specific ([35]). The Zululand coastal plain of South Africa has more than 50 000 ha of industrial plantation forests and many wood-burning processing plants. The coastal plain soils are sensitive to poor management practices, as demonstrated by the nutritional disorders that have been experienced with soils that have low organic matter in the topsoil ([10]), as well as old agricultural lands that had been intensively tilled and burnt ([9]). We explored the feasibility of disposing pure wood ash in an area where it is produced in large quantities on a plantation soil as an alternative disposal method. More specifically, this paper examined the changes in Eucalyptus grandis × urophylla stand growth and soil chemical properties, after wood ash applications were made to a typically nutrient poor soil with a low buffer capacity. The following hypothesis was formulated: tree survival and stand growth are not affected by (A) ash application and (B) fertilization.
Materials and methods
Site history
The field study was situated on the Zululand coastal plain, at longitude 32° East and latitude 28° South. It was established approximately 7 km from central Richards Bay (KwaZulu-Natal, South Africa), positioned 12 km from the Indian Ocean at an altitude of 64 m above sea level. Data provided by the South African Weather Service for the last 25 years, estimated the trial area to have a mean annual temperature and mean annual precipitation of 22 °C and 1221 mm, respectively. The experimental site has been afforested with Eucalyptus since the 1980’s. The site was previously planted with an E. grandis × urophylla clone and reached rotation age near the end of 2012. The soil was classified as an arenosol. Arenosols are characteristically sandy textured and contain little organic matter and soils from the Zululand coastal plain typically fall into this category ([9], [36], [8]). The basic soil chemical properties of the soil at the experimental site are shown in Tab. 1. The buffer capacity refers to the mg CaCO3 per kg of soil that will raise the ambient pH by one unit, and the lime requirement refers to the tons of CaCO3 ha-1 that can react with soil to a soil depth of 0.3 m and raise the pH by one unit. Soil sample 2 was excluded from the buffer capacity and lime requirement determination.
Tab. 1 - Basic soil chemical properties of the soil at the experimental site. (SE): standard error.
| Parameter | Sample | Mean | SE | ||||
|---|---|---|---|---|---|---|---|
| A1 | A2 | A3 | A4 | A5 | |||
| Sample Density (kg m-3) | 1470 | 1480 | 1480 | 1500 | 1510 | 1488 | 7.35 |
| Clay (%) | 7 | 6 | 5 | 6 | 7 | 6.2 | 0.37 |
| C (%) | 0.6 | < 0.5 | < 0.5 | < 0.5 | < 0.5 | - | - |
| N (%) | < 0.05 | < 0.05 | < 0.05 | < 0.05 | < 0.05 | - | - |
| Bray II P (mg kg-1) | 1.36 | 1.35 | 1.35 | 1.33 | 1.32 | 1.34 | 0.01 |
| K (cmolc kg-1) | 0.03 | 0.06 | 0.02 | 0.03 | 0.02 | 0.03 | 0.01 |
| Ca (cmolc kg-1) | 1.69 | 2.11 | 1.35 | 1.56 | 1.01 | 1.54 | 0.18 |
| Mg (cmolc kg-1) | 0.19 | 0.23 | 0.15 | 0.18 | 0.18 | 0.19 | 0.01 |
| Total Base Cations (cmolc kg-1) | 1.92 | 2.40 | 1.52 | 1.77 | 1.22 | 1.78 | 0.20 |
| Zn (mg kg-1) | 0.20 | 0.14 | 0.47 | 0.33 | 0.20 | 0.29 | 0.06 |
| Mn (mg kg-1) | 2.72 | 4.05 | 2.70 | 4.00 | 3.31 | 3.36 | 0.30 |
| Cu (mg kg-1) | 0.34 | 0.41 | 0.47 | 0.33 | 0.26 | 0.36 | 0.04 |
| Acid saturation (%) | 5 | 3 | 5 | 4 | 9 | 5.20 | 1.02 |
| pH (KCl) | 5.76 | 6.16 | 5.55 | 5.46 | 4.62 | 5.51 | 0.25 |
| Buffer capacity# (mg kg-1 per pH unit) | 74.07 | - | 48.78 | 55.56 | 14.99 | 48.35 | 12.34 |
| Lime requirement, 0.3m deep (t ha-1) | 326.65 | - | 216.58 | 250.02 | 215.83 | 215.29 | 54.26 |
Experimental design and field trial establishment
Wood ash application rates for the field trial were based on the results of a pilot study (a lime reaction study in the laboratory) on soil samples collected from the study site. The pilot study was based on the methodology by Aitken et al. ([1]) and required the addition of a CaCO3 solution to the soil samples and then recording the pH. The buffer capacity of each soil sample was determined by fitting linear regressions representing the relationship between the changes in soil pH and increasing rates of added CaCO3. Aitken et al. ([1]) defines the buffer capacity as the change in quantity with intensity and, as a result, the reciprocal of the slope is recorded as the buffer capacity of the soil (Tab. 1). The buffer capacity was then used to determine the lime requirement and subsequently the wood ash application rate, using the calcium carbonate equivalent (CCE) approach ([4]). In this experiment the lime requirement was defined as the amount of CaCO3 needed to raise the soil pH and did not necessarily mean the soil required lime before trial establishment.
Guided by the lime reaction in the pilot study, a field experiment was subsequently established, using a 4 × 3 factorial design in six replications, i.e., a total of 72 plots. The field experiment tested four wood ash application rates of 0, 0.3, 0.6 and 1.2 t ha-1 in factorial combination with three levels of fertilizer, i.e., zero fertilizer, a conventional ammonium sulphate nitrate (ASN) fertilizer mixture or a NPK controlled release fertilizer mixture (see active ingredient contents in Tab. 2). Wood ash application rates were represented as A0, A0.3, A0.6 and A1.2, respectively. The controlled release fertilizer was polymer-coated to release approximately 25% of the contained nutrients up to 2 months and 75% up to 8 months after application. The controlled release fertilizer dosage of 320 g per seedling (FCRF) supplied 80 g of nitrogen and 20 g phosphorous (with some Ca, S and trace elements) and was chosen as it yielded the best responses in recent experiments with controlled release fertilizers ([17]). The conventional fertilizer (FCV treatment) supplied 40 g N as ammonium sulphate nitrate, and was chosen because it is a standard fertilizer recommendation for these soils ([10]). Wood ash application rates were relatively low, due to the limited buffer capacity and the high initial pH of the soil.
Tab. 2 - Application rates of nutrient elements used in the FCRF (controlled release) prescription blend and FCV (conventional) fertilizer.
| Element | Treatment | |
|---|---|---|
| FCRF | FCV | |
| N (g tree-1) | 80 | 40 |
| P (g tree-1) | 20 | - |
| K (g tree-1) | 0 | - |
| Ca (g tree-1) | 10 | - |
| Mg (g tree-1) | 1 | - |
| S (g tree-1) | 12 | 19 |
| B (mg tree-1) | 0 | - |
| Cu (mg tree-1) | 90 | - |
| Fe (mg tree-1) | 128 | - |
| Mn (mg tree-1) | 96 | - |
| Mo (mg tree-1) | 0 | - |
| Zn (mg tree-1) | 1152 | - |
A total of 72 plots were demarcated for this experiment. Trees were planted at a standard spacing of 2.4m x 3m. Individual plots comprised of 7 × 7 rows of trees and consisted of an outer and inner plot. Outer plots were designated as the buffer row, therefore data collection and sampling was limited to the inner plot. Inner plots consisted of the inner 5 × 5 rows and had an effective area of 180 m2.
The site was planted on 14 October 2013. Fertilization and wood ash applications commenced on 22 October 2013, 8 days after planting. First weeding was done on the 28th January 2014.
Biomass index and growth response
Diameters were measured at 1.3 m from the base (DBH) using diameter tapes at 8 and 21 months after trial establishment. Heights were measured at 8 and 21 months after trial establishment. Height rods, calibrated at 10 cm, were used at 8 months of age and a Haglöf Vertex IV at 21 months. A Biomass Index (BI) was used as a substitute for calculating volume, due to the young age of the trial. This was done according to the methodology outlined by Donald et al. ([7]); the BI was calculated as a product of the diameter at breast height squared (cm2) and height (m) of each tree per plot. The response was calculated from the BI for each treatment and expressed as a percentage of the growth increase relative to the control treatment.
Soil analysis
Sample collection
Soil samples were collected at 4 and 8 months after trial establishment. A Beater auger was used to sample in the 0-10 cm soil surface mineral layer. The Beater auger is designed to take multiple, small diameter soil cores from the topsoil and bulking them per plot. Plots treated purely with wood ash (no fertilizer treatment) were selected for soil nutrient analyses and plots treated with the highest wood ash application of 1.2 t ha-1 were also subjected to heavy metal analysis.
Soil nutrient analysis
Soil samples were air dried and sieved through a 2mm sieve; this additionally allowed for the determination of the stone fraction for each sample. The pH for each sample was determined in 1M KCl. Total C and N content was determined by means of high temperature combustion using the Leco Truspec® C and N analyser. P content was determined using the Bray II method and extractable cations K, Ca, Mg and Na were extracted with 0.2 M ammonium acetate solution (pH 7). Extractable acidity was determined by titration with 0.05M NaOH after extraction with 1M KCl. Extracted solutions were analysed for chemical composition and elemental concentrations by Inductively Coupled Plasma Optical Emission Spectroscopy (ICP-OES). Total P was extracted at 80 °C for 30 minutes using a 1:1 mixture of 1 M nitric and hydrochloric acid. Phosphorous concentration was determined using Varian ICP-OES. Effective cation exchange capacity (ECEC) was calculated as the sum of the base cation charge plus the extractable acidity at ambient pH.
Soil heavy metal analysis
Individual samples were sieved (2 mm) and then dried. Extraction was done by adding 20 ml HNO3 (55%) and 5 ml H2O2 (30%) to 5 g of each sample. These were then placed on a heated sandbed for 8 hours and then filtered using Whatman no. 2 filter paper. Extraction was done using atomic emission with Varian ICP-OES. Heavy metals were measured according to each element’s wavelength.
Foliar analysis
Sample collection
Samples were collected at 4 and 8 months after trial establishment. Four young, fully expanded leaves were selected from each tree per plot and subsequently placed in a plastic bag and cooled to prevent deterioration. Foliar concentrations were assessed according to critical levels determined by Dell et al. ([5]) for E. grandis × urophylla.
Foliar nutrient analysis
Samples were washed with a low concentration detergent solution (Teepol), rinsed with de-ionised water and oven dried at 70 °C. The samples were then milled and ashed at 470 °C. A 50:50 HCl (32 %) solution was mixed into each ashed sample and extraction was done using filter paper. The N content was determined by means of combustion in a Leco N-analyser. Micronutrients and cation concentrations of the extract was measured with Varian ICP-OES.
Foliar heavy metal analysis
Foliage samples were ashed and extracted using similar methodology to the foliar nutrient analysis procedure. After ashing and extraction, the aliquot was transferred to a 20 ml ICP tube and analysed using Varian ICP-OES. Heavy metal content was determined according to each element’s wavelength.
Wood ash analysis
Wood ash elemental composition
Ash was supplied by DukuDuku sawmill, situated approximately 10 km from St. Lucia. The mill generated pure wood ash from the combustion of Eucalyptus off-cuts and waste (e.g., sawdust) produced during timber processing. Five wood ash samples were collected periodically at three intervals to account for variation in composition (Tab. 3). This variation could be caused by site, species and silvicultural treatments in the plantation, as well as variations in the combustion process on the specific day.
Tab. 3 - Elemental concentrations for 5 wood ash samples collected at different time intervals. (SE): standard error.
| Element/ Parameter |
Sample | Mean | SE | ||||
|---|---|---|---|---|---|---|---|
| A1 | A2 | A3 | A4 | A5 | |||
| C (g kg-1) | 93.0 | 45.7 | 170.7 | 73.4 | 44.5 | 85.5 | 23.2 |
| N (g kg-1) | 0.4 | 0.2 | 0.8 | 0.3 | 0.5 | 0.4 | 0.1 |
| P (g kg-1) | 8.9 | 6.4 | 12.4 | 8.6 | 3.6 | 8.0 | 1.5 |
| K (g kg-1) | 37.2 | 37.8 | 82.3 | 20.4 | 12.3 | 38.0 | 12.1 |
| Ca (g kg-1) | 292.7 | 199.1 | 173.8 | 272.4 | 84.0 | 204.4 | 37.3 |
| Mg (g kg-1) | 37.0 | 21.3 | 173.8 | 33.0 | 9.1 | 54.8 | 30.1 |
| Na (mg kg-1) | 11 867 | 9 275 | 20 723 | 8 171 | 4 046 | 10 816 | 2 779 |
| Mn (mg kg-1) | 7 160 | 2 803 | 4 534 | 6 110 | 1 320 | 4 385 | 1 063 |
| Fe (mg kg-1) | 1 754 | 7 699 | 3 411 | 1 254 | 2 117 | 3 247 | 1 169 |
| Cu (mg kg-1) | 28 | 57 | 92 | 87 | 85 | 70 | 12 |
| Al (mg kg-1) | 1 742 | 5 419 | 2 769 | 856 | 1 440 | 2 445 | 806 |
| Moisture (%) | 0.10 | 0.29 | 0.60 | 1.20 | 0.50 | 0.54 | 0.19 |
| pH | 12.76 | 11.99 | 12.14 | 13.40 | 13.40 | 12.74 | 0.30 |
Analysis procedure
Fresh wood ash samples were selected for total C, N and S determination using the Dumas dry combustion method. Samples were burnt at 1350 °C in a furnace, converting elemental carbon, nitrogen and sulphur into gasses. The gasses produced from combustion were homogenised and passed through infrared detection (CO2 and SO2) and thermal conductivity cells (N2 and NOx) to measure the elemental C and N contents. The elemental concentrations of Ca, Mg, K, Na, P, Cu, Zn, Mn, Fe and Al were determined using the Inductively Coupled Plasma Optical Emission Spectroscopy (ICP-OES). Heavy metal concentrations were determined using Inductively Coupled Plasma Atomic Emission Spectroscopy (ICP-AES); the wavelengths of each tested heavy metal were used to determine the concentrations.
Statistical analysis
The effects of wood ash application rate and fertilizer variety on E. grandis × urophylla growth were analysed by the analysis of variance (ANOVA). A least significant difference (LSD5%) was used to show any significant interaction among treatments if the F statistic was significant for the treatment effect. Treatments with p<0.05 were reported as having statistical significance, unless stated otherwise. Data was initially tested for normality using the Shapiro-Wilk test and Normal Probability plots. Homogeneity was tested using Bartlett’s and Levene’s tests. Fischer’s LSD test was used to compare specific treatment differences for data collected at 4, 8 and 21 months. Data analysis was completed using the software STATISTICA® v.11.0 (StatSoft inc., Tulsa, OK, USA). In all instances, we used the factorial structure of the treatments in the experiment to ascertain if there were any interactions. In cases where there were no interactions, the main effects were reported.
Results
Seedling survival
A blanking operation was implemented one week prior to treatment implementation and as a result the initial survival was 100%. At 629 days after treatment implementations (approximately 21 months) tree survival was 95.0%. The main effect of wood ash application rate, at both time intervals, and the interaction for time after planting and fertilizer type were not statistically significant. However, the main effect of fertilizer type on survival was significant (p=0.006). Average survival was lowest for untreated plots (F0; 98.0%), followed by plots treated with controlled release fertilizer (FCRF; 98.2%) and lastly conventional fertilizer (FCV; 98.8%).
Height growth
The effect of wood ash treatment on height growth was not significant, and there were no significant interactions between factors. The average height growth per plot was statistically significant (p < 0.001) for fertilizer type as a main effect at 8 and 21 months after treatment implementation. At 8 months of age, plots treated with FCRF had the greatest mean height ± standard error of mean, followed by FCV and lastly F0 treated plots (267.8 ± 8.1, 239.8 ± 5.3 and 201.3 ± 7.3 cm, respectively). Similarly, at 21 months FCRF treated plots had the greatest mean height growth, followed by FCV and F0 treated plots, with mean heights of 678.8 ± 12.7, 656.8 ± 13.0 and 607.8 ± 13.2 cm, respectively.
Diameter growth
The effect of wood ash treatment on diameter growth was not significant, and there were no significant interactions between factors. The main effect for fertilizer type on diameter growth was statistically significant (p<0.0001) at 8 and 21 months after treatment implementation. At 8 months, plots treated with FCRF had the largest mean diameter ± standard error of mean of 2.12 ± 0.09 cm. FCV treatments had a mean diameter of 1.74 ±0.03 cm and F0 treated plots a mean value of 1.28 ± 0.07 cm. At 21 months, FCRF treated plots had the greatest mean diameter value of 6.74 ± 0.09 cm, followed by FCV and F0 treated plots with mean diameters of 6.63 ± 0.11 and 5.84 ± 0.10 cm, respectively.
Biomass index and BI growth response
The main effect of wood ash application rate and the interaction for wood ash application rate and fertilizer type was not statistically significant at 8 and 21 months. However, the effect of fertilizer type on the BI at 8 months was weakly significant on a 90% confidence interval (p=0.081). Mean BI was highest for FCRF treated plots and lowest for F0 treatments (22.92 ± 6.09 and 6.16 ± 0.60, respectively).
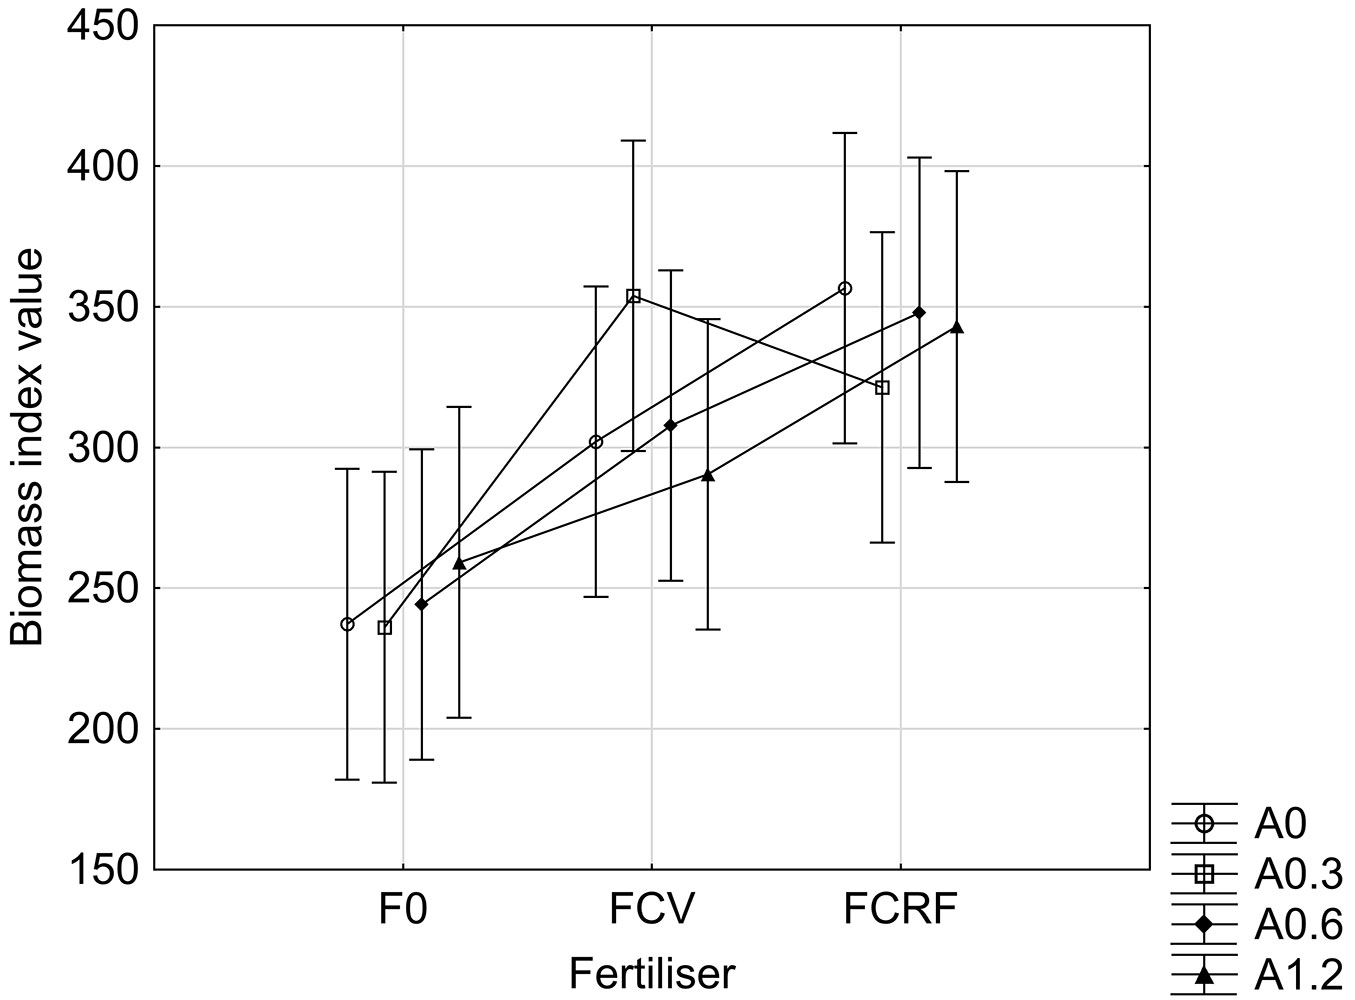
At 21 months of age, the main effect of fertilizer type was significant (p<0.001) on a 95% confidence interval. At 21 months of age, BI was highest for FCRF treated plots and lowest for F0 treated pots, but the difference in BI for FCRF and FCV treated plots was minor, with respective mean ± standard error of mean values of 342.20 ± 13.53, 313.57 ± 11.12 and 244.21 ± 15.03. Similar to the 8 month data, the effect of the ash applications on BI growth was not statistically significant (Fig. 1), but a significant effect was visible for type of fertilizer used in the experiment.
Fig. 1 - Biomass Index at 21 months of age for the main effect of fertilizer type. Standard error (p<0.05) is shown by whiskers.
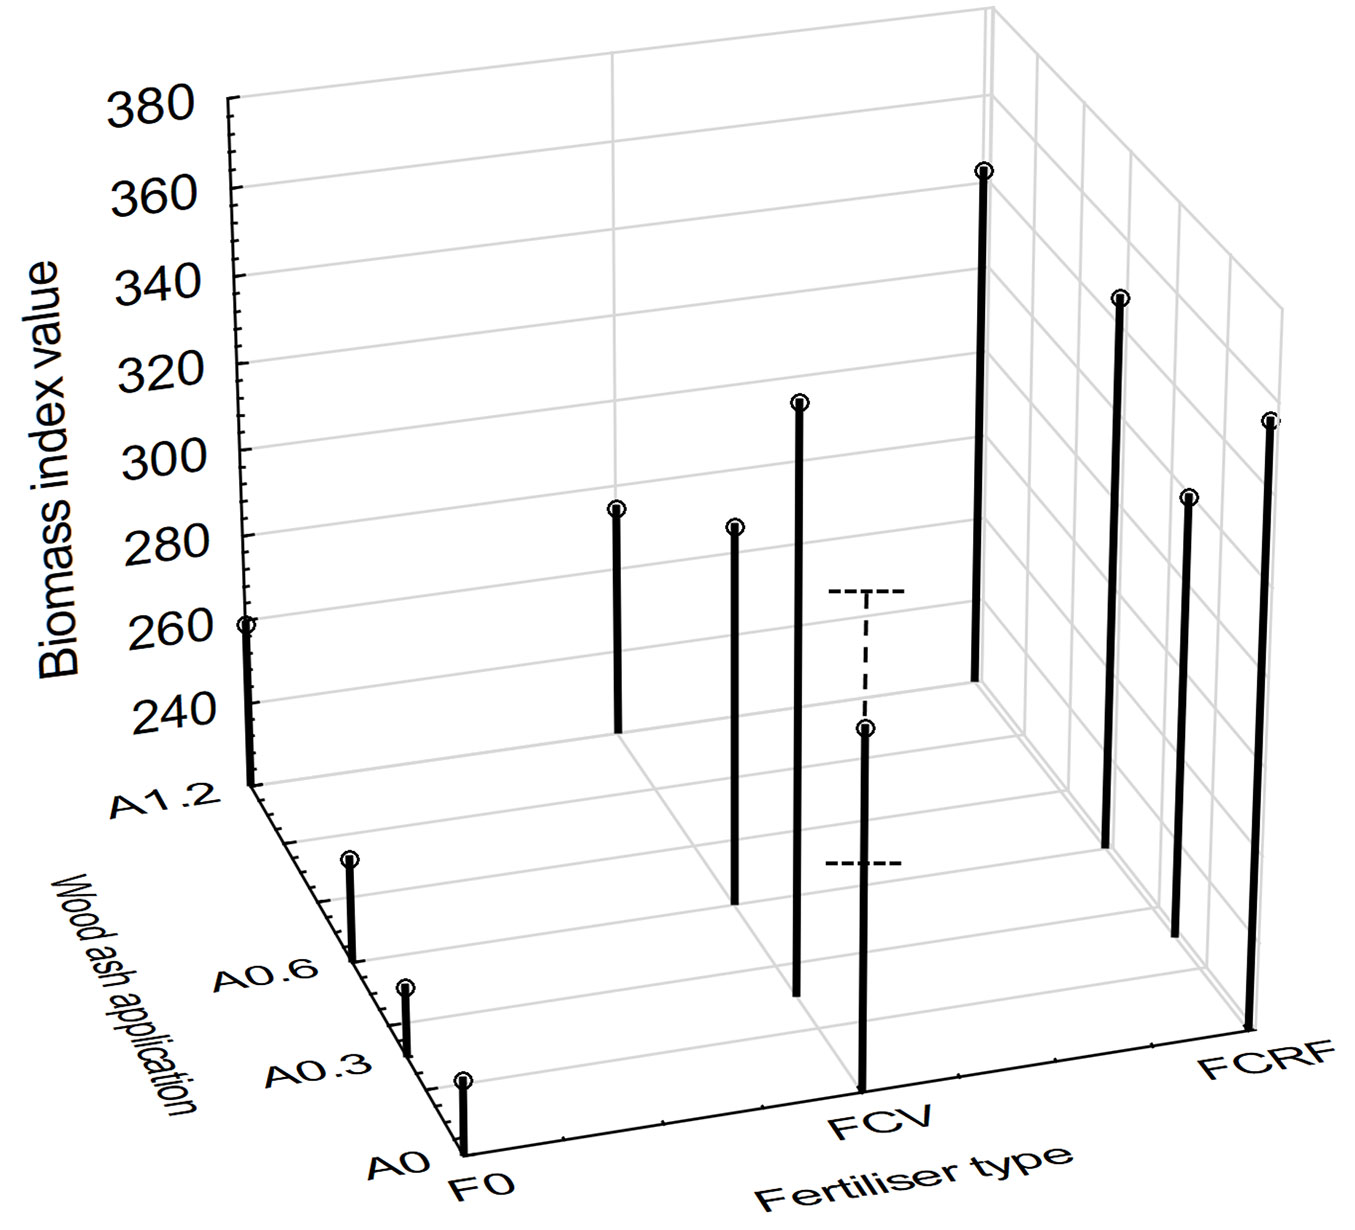
At 8 months after treatment implementation, the highest mean growth response of 683% over the control was recorded for plots treated with A0.6FCRF (Fig. 2). Plots treated with no fertilizer and purely wood ash had the smallest growth response. At 21 months after treatment implementation, the mean growth response was highest for the A0FCRF treatments; a 50.3% increase relative to the control treatments. A negative growth response of -0.5% was found for the A0.3F0 treatment, but this was statistically similar to the untreated control. Similar to the 8 month data, the weakest growth responses were found for treatments that received no fertilizer and purely wood ash. The A0.3F0, A0.6F0 and A1.2F0 treatments had responses of -0.5%, 2.9% and 9.2%, respectively, relative to the control.
Fig. 2 - Mean biomass indices for ash and fertilizer treatment combinations at 21 months after treatment implementation. The x-axis for the wood ash treatment is spaced out to reflect the scale of the actual increments in ash application. Standard error (p<0.05) is shown by whiskers.
Effect of ash application on topsoil
Soil analyses were performed on data gathered at 4 and 8 months after trial establishment on samples collected from 0 to 10 cm soil depth.
Soil C
Mean carbon content differed significantly (p<0.001) for the fixed effect of time after trial establishment. At 4 months, mean soil carbon content was 0.39% and at 8 months after trial establishment, mean soil carbon content decreased to 0.19% (Tab. 4).
Tab. 4 - Soil C, ECEC, exchangeable acidity, mean base cation concentrations and respective standard error values at 4 and 8 months after treatment implementation.
| Period | Parameter | C (%) | K (cmolc kg-1) |
Ca (cmolc kg-1) |
Mg (cmolc kg-1) |
Na (cmolc kg-1) |
Extractable acidity (cmolc kg-1) |
ECEC (cmolc kg-1) |
|---|---|---|---|---|---|---|---|---|
| 4 months | Mean | 0.39 | 0.062 | 1.991 | 0.498 | 0.054 | 0.338 | 2.943 |
| SE | 0.14 | 0.004 | 0.209 | 0.020 | 0.002 | 0.020 | 0.255 | |
| 8 months | Mean | 0.19 | 0.045 | 1.182 | 0.322 | 0.037 | 0.263 | 1.849 |
| SE | 0.05 | 0.002 | 0.065 | 0.011 | 0.001 | 0.013 | 0.092 |
ECEC, exchangeable acidity and base cations
Exchangeable base cations and effective cation exchange capacity were significantly different for the fixed effect of time after treatment implementation. ECEC decreased from 4 to 8 months after treatment implementation months (Tab. 4); in 4 months ECEC decreased from 2.94 to 1.88 cmolc kg-1. Extractable acidity decreased from 0.34 to 0.26 cmolc kg-1 for the same period.
Mean values of exchangeable Ca2+, Mg2+, Na+ and K+ concentrations decreased from 4 to 8 months. Mean Ca2+ concentration was significantly higher at 4 months after trial establishment and showed a decrease by 8 months, i.e., from 2.00 to 1.18 cmolc kg-1. Between 4 and 8 months mean Ca2+ concentration decreased by 0.81 cmolc kg-1, this decrease was indicative of the temporary effect of wood ash additions on soil Ca2+ concentrations in the topsoil (Tab. 4). The mean Mg2+ soil concentration was 0.50 cmolc kg-1 at 4 months after trial establishment and 0.32 cmolc kg-1 at 8 months. During this 4 month period, mean Mg2+ concentration decreased by 0.18 cmolc kg-1. Mean Na+ concentration was greatest at 4 months after trial establishment and showed a decrease at 8 months, 0.05 to 0.04 cmolc kg-1. Mean Na+ concentration decreased by 0.02 cmolc kg-1 during the 4 month period (Tab. 4). Mean exchangeable K+ cation concentration did not vary considerably at 4 months and 8 months after trial establishment, but were significant. The mean concentration was 0.06 cmolc kg-1 at 4 months and 0.05 cmolc kg-1 at 8 months after trial establishment. Mean K+ concentration decreased by 0.02 cmolc kg-1 during the 4 month period (Tab. 4).
Soil pH
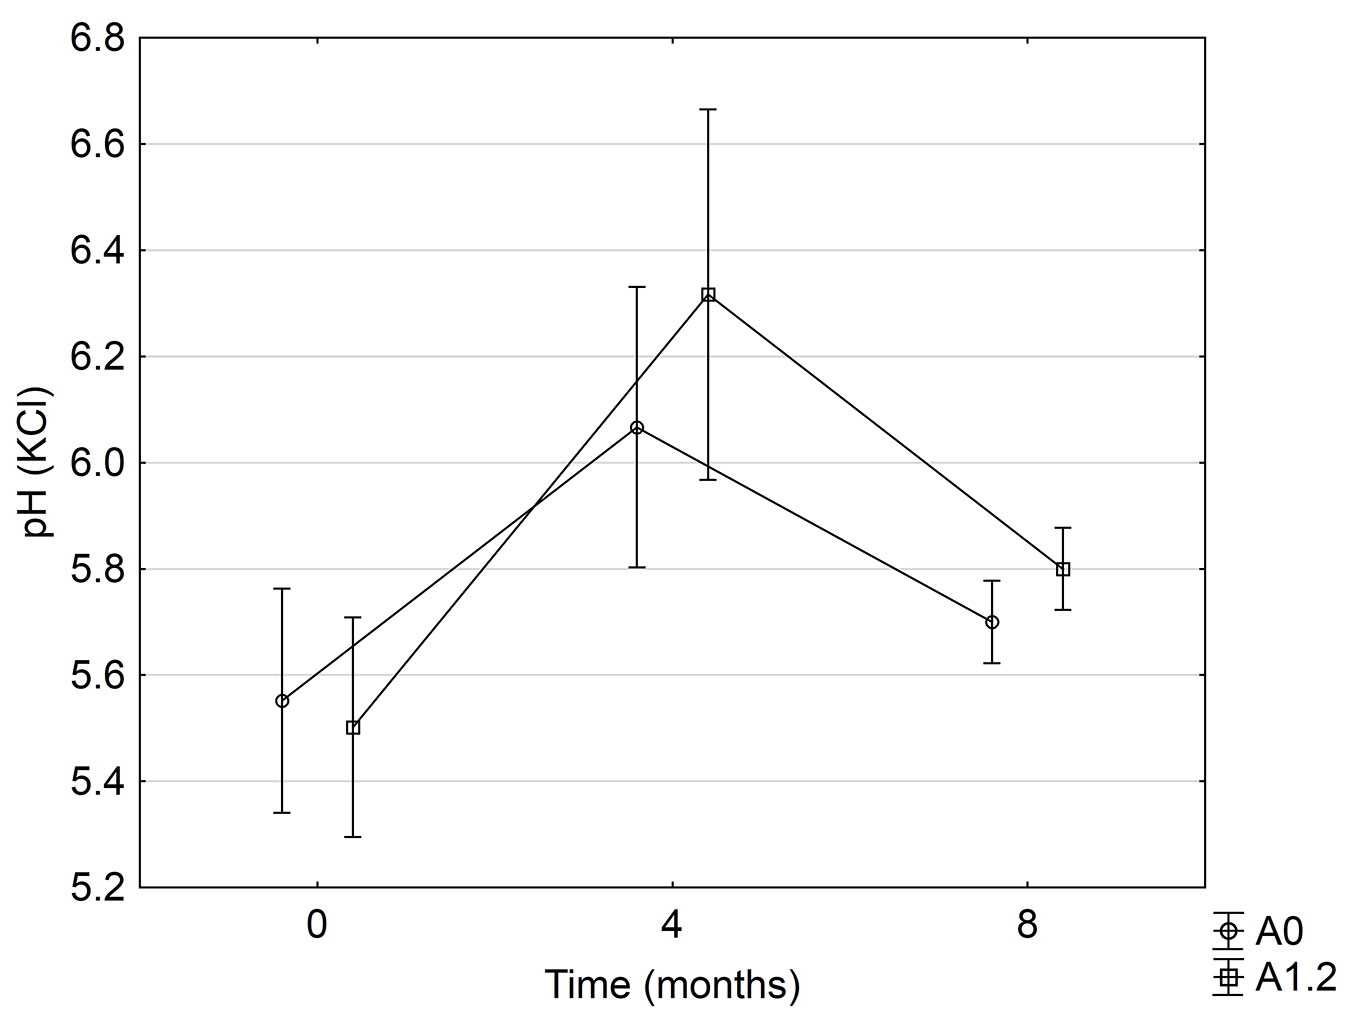
The changes in soil pH were significant for the fixed effect of time after treatment implementation (Fig. 3). Wood applications did not significantly affect the soil pH, and Fig. 3 provides an illustration of this for the highest and lowest (control) application rates over the experimental period. The mean pH increased from 5.5 to 6.1 in the first 4 months, and decreased to 5.7 from 4 to 8 months, indicating a small temporary liming effect during the first part of the experimental period.
Fig. 3 - Significant soil pH changes over time, for the highest and lowest wood ash application rates. Standard error (p<0.05) is shown by whiskers.
Heavy metal concentrations
Results indicated significant treatment differences (p=0.001) for the fixed effect of time on soil heavy metal concentrations. Heavy metal concentrations for Cd, Hg, Pb and Cr increased significantly from 4 to 8 months, but were well below the screening values set by the National Environmental Management: Waste Act, 2008 (Act no. 59 of 2008) of South Africa for protection of ecosystem health and the European Union ([18] - Tab. 5). At both intervals, mean Cr concentrations were found to be the highest in the soil and mean cadmium concentrations were nearly undetectable (Tab. 5). At 4 months, mean Cr and Cd concentrations were <0.001 mg kg-1 and 0.008 mg kg-1, respectively. At 8 months, concentrations were 2.215 mg kg-1 and 7.375 mg kg-1, respectively.
Tab. 5 - Mean and standard error of mean soil heavy metal concentrations at 4 and 8 months after establishment.
| Period | Parameter | Cd (mg kg-1) |
Hg (mg kg-1) |
Cr (mg kg-1) |
Pb (mg kg-1) |
|---|---|---|---|---|---|
| 4 months | Mean | 0.000 | 0.009 | 2.215 | 0.965 |
| SE | 0.000 | 0.002 | 0.114 | 0.060 | |
| 8 months | Mean | 0.008 | 0.029 | 7.375 | 3.859 |
| SE | 0.004 | 0.003 | 0.515 | 0.238 | |
| Allowable soil metal levels | NEMA - South Africa | 37 | 4.1 | 260 (Cr VI) | 100 |
| European Union | 1-3 | 1-1.5 | - | 50-300 |
Foliar analysis
Critical levels and nutrient concentrations
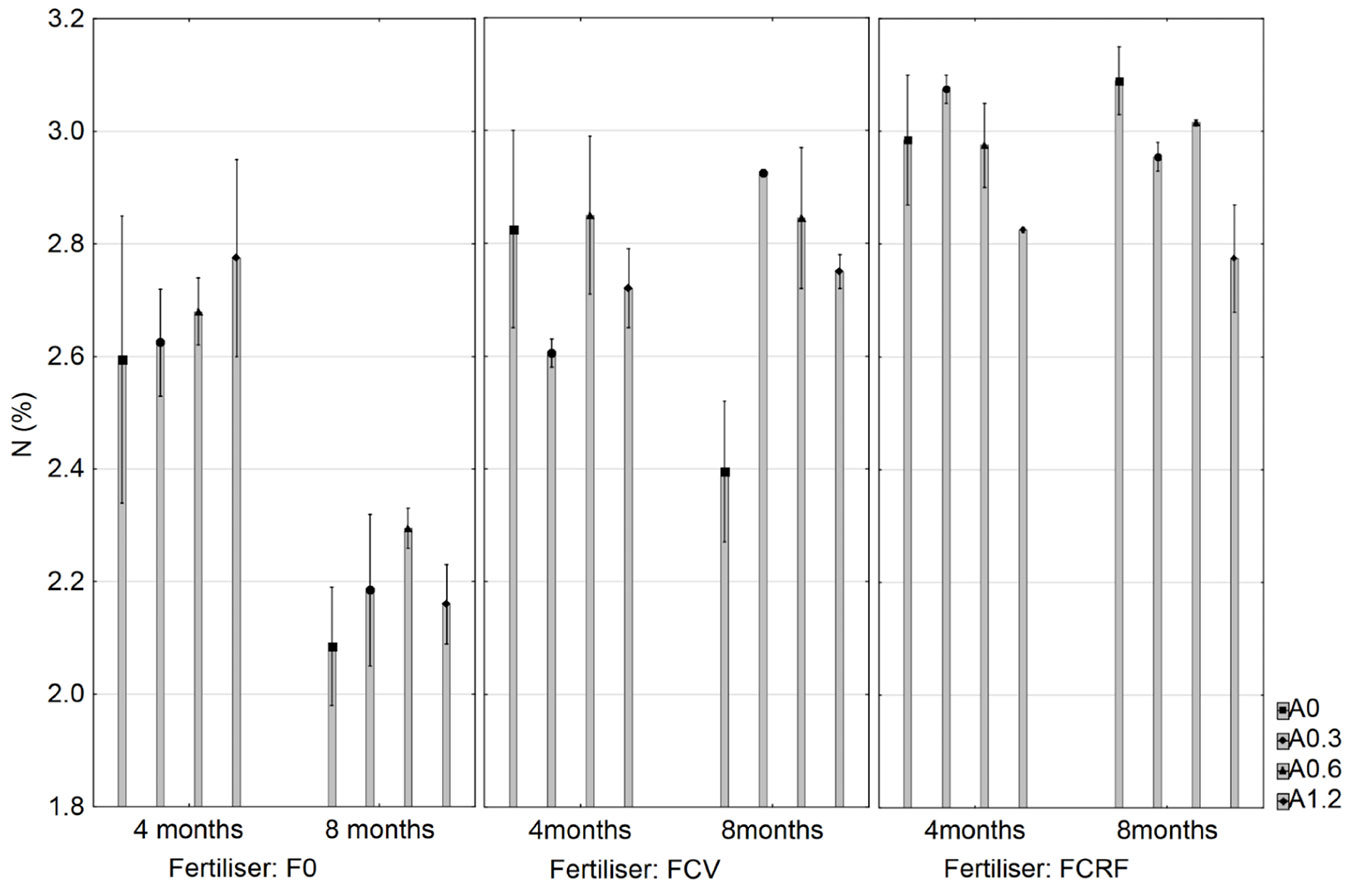
Several plots showed sub-optimal foliar P, K and Zn concentrations at 4 months of age according to the critical value assessment method ([5]). They were defined as sub-optimal, due to concentrations below the critical values suggested by Dell et al. ([5]), but not near acute deficiency levels. At 8 months after treatment implementation, several plots showed potentially sub-optimal P and K concentrations. Mean N concentration was the only nutrient significantly affected by time, fertilizer and the interaction of wood ash with both variables (p=0.005). At 4 to 8 months after treatment implementation, mean foliar N concentration decreased significantly by 0.17% for unfertilized plots (Fig. 4). Mean N concentrations remained fairly stable over time for FCRF, FCV treatments and all the tested wood ash application rates (Fig. 4).
Fig. 4 - Mean foliar N concentrations for the effects of fertilizer, time and wood ash application rate. Standard error (p<0.05) is shown by whiskers.
Significant treatment differences were found for the single effect of fertilizer type on mean foliar P concentration (p=0.016). Plots treated with FCRF had the greatest mean P concentration and FCV treatments the lowest, namely 0.197% and 0.171%, respectively. Significant treatment differences were found for the interaction of fertilizer type and time after treatment implementation on mean K concentration; at 4 months the mean concentration was highest for F0 treated plots and lowest at 8 months for FCRF treatments, namely 1.13% and 0.95%, respectively (details not presented).
The critical value nutrient assessment technique identified a single treatment with a sub-optimal Zn and P concentration at both age intervals and thus did not provide enough evidence to suggest potentially severe macro or micronutrient imbalances could ensue from wood ash applications of up to 1.2 t ha-1 (details not presented).
Heavy metal concentrations
Treatments with the highest wood ash applications were selected for heavy metal analyses. At 4 months of age, Cd was undetectable and Hg, Cr and Pb concentrations were in the range of 0.01 to 0.02 mg kg-1. At 8 months, Cd was yet again undetectable and Hg, Pb and Cr concentrations ranged from 0.01 to 0.04 mg kg-1 (Tab. 6). Arsenic, Hg and Pb have a low bio-availability ([22]) and this could likely serve as an explanation for the observed concentrations. Cadmium, Hg, Cr and Pb values for the A1.2FCRF treatment were not determined at 4 months.
Tab. 6 - Foliar heavy metal concentrations (in mg kg-1) for selected plots treated with 1.2 t ha-1 wood ash at 4 and 8 months of age.
| Treatment | 4 months (mg kg-1) | 8 months (mg kg-1) | ||||||
|---|---|---|---|---|---|---|---|---|
| Cd | Hg | Cr | Pb | Cd | Hg | Cr | Pb | |
| A1.2F0 | 0.0 | 0.01 | 0.02 | 0.01 | 0.0 | 0.01 | 0.04 | 0.00 |
| A1.2F0 | 0.0 | 0.02 | 0.02 | 0.00 | 0.0 | 0.00 | 0.04 | 0.01 |
| A1.2FCV | 0.0 | 0.01 | 0.02 | 0.00 | 0.0 | 0.00 | 0.04 | 0.01 |
| A1.2FCV | 0.0 | 0.01 | 0.01 | 0.00 | 0.0 | 0.01 | 0.04 | 0.00 |
| A1.2FCRF | - | - | - | - | 0.0 | 0.00 | 0.04 | 0.01 |
| A1.2FCRF | 0.0 | 0.01 | 0.02 | 0.00 | 0.0 | 0.00 | 0.04 | 0.00 |
Discussion
Mortality
The main effect of wood ash application rate on seedling mortality was not significant. However, at 8 and 21 months after trial establishment, seedling mortality was significantly greater for plots that received no supplementary nutrients from fertilization. This may partly be due to the poor nutrient status of the soils, potentially exacerbated by ash applications with low N. The results suggest that the wood ash (in the absence of NPS fertilizer) was not able to entirely supply the seedlings with the necessary nutrients for increased survival during the nutrient-demanding growth phase that commonly occurs at time of establishment ([21]).
Growth response
The growth responses observed at 8 months of age showed that applications of purely wood ash or fertilizer did not suppress growth for any treatments, bearing in mind the magnitude of the responses and weak significance. However, at 21 months of age, the A0.3F0 treated plots had a small negative growth response of -0.50% relative to the control treatment at the respective age. This was noted for single treatments that purely received 0.3 t ha-1 wood ash and no supplementary nutrients from fertilization. This degree of the response was such that there was statistically no difference between the treatment and the control. Growth suppression from wood ash additions in excess of 5 t ha-1 to Picea abies forests has been reported by Mandre et al. ([25]). In our trial, it was unlikely that the negative growth response resulted from an over-application of wood ash, since the higher application levels did not suppress growth. This experiment showed that wood ash has the potential to increase the growth of eucalypts, but the effect of wood ash was insignificant on the biomass index and a balance nutrient supplement was needed to obtain a significant increase in growth (Fig. 1). Guerrini et al. ([16]) found that wood ash and paper sludge applications on predominantly sandy soils can increase growth in the range of 38% to 64% relative to chemical fertilizers. The addition of a supplementary nitrogen-rich nutrient source has been shown to increase growth and is recommended if improved growth responses are anticipated from wood ash additions ([6], [19], [12]).
Soil properties
Soil pH
A temporary liming effect was observed for the 8 month monitoring period. Soil analyses at 0, 4 and 8 months showed respective mean pH values of 5.5, 6.1 and 5.7 (Fig. 3). The temporary fluctuation in soil pH could likely have been attributed to the low intensity burn at site establishment and the resultant moderate slash retention before treatments were implemented. du Toit et al. ([11]) found that topsoil pH increased significantly after clear felling and re-establishment of an E. grandis plantation, grown on a humic ferralsol (treatments where slash was retained showed a modest increase and slash burning elicited a larger increase in pH). In that trial, topsoil pH increased during the first 2 years after re-establishment and returned to initial levels when re-measured at rotation end (7 years). Although the longer term effect of wood ash on soil pH was not significant, it is worth noting that wood ash incubation studies by Ohno & Erich ([28]) also found that soil pH increased for the first 25 weeks and gradually declined as time progressed; soil pH stabilised at 42 weeks after that experiment was initiated.
Soil C and macronutrients
Mean soil C decreased from 4 to 8 months. Soil C was nearly 50% less at 8 months relative to the previous measurements. Comparable results were obtained by Gonçalves et al. ([15]), working on a eucalypt stand situated on a haplic ferralsol in Brazil with 77% sand content: they recorded a decrease in organic matter contents in the top 5 cm of the soil of 22.2 to 14.9 mg g-1 (33%) over a 10 month period following clear felling and burning. It is possible that a substantial amount of topsoil carbon was lost due to the surface fires and subsequent wind erosion, as the site is situated close to the coast with strong winds in spring (August to November). The carbon content of the higher ash applications was roughly two orders of magnitude smaller than the carbon pool of the 0-10 cm soil layer, and for this reason, the effect of our wood ash applications on soil organic carbon levels were insignificant.
Although there were no statistically significant effects for individual wood ash treatments on extractable soil phosphate and potassium concentrations, the short term nutrient fluctuations over time were of note. The elevated levels of phosphorous at 4 months followed by a significant reduction by 8 months is a pattern often observed in acid or moderately acid forest soils following slash burning: a temporary increase in plant-available P which coincides with a temporary rise in soil pH, in the so-called ash-bed effect ([32], [11]). The higher temperatures, changes in soil moisture and soil pH could stimulate microbial organisms responsible for P mineralisation and decomposition and result in larger P concentrations ([27], [26]). Soil P is increasingly fixated by Fe2+ and Al3+ compounds at pH values smaller than 6 and is also rendered unavailable by the formation of sparingly-soluble calcium and magnesium phosphates at pH values exceeding 7 ([4]). The buffering capacity of a soil is central in determining the rise in soil pH from the application of a liming material. The application of a liming material on a low buffered soil can reduce P anion availability, due to the alkalinity and the high Ca2+ additions to the soil ([4]). In addition, some P could have leached from the soil given the high leaching ability of a sandy soil.
Exchangeable base cations CEC
Calcium cation concentrations were the highest of the soil base cations (Tab. 4) and it also displayed the largest change from 4 to 8 months after trial establishment. This may be attributed to the burning of wood harvesting residue, as well as wood ash composition, as the wood ash used in the experiment contained a significant amount of Ca. The addition of large quantities of divalent Ca2+ in the form of wood ash on the soil possibly displaced the monovalent cations Na+ and K+ and ions with a smaller mass and ionic radius like Mg2+. The decreases in total soil K+, Mg2+ and Na+ concentrations observed after 8 months deviated from most of the documented wood ash-soil responses. Guerrini et al. ([16]) found that the combined application of wood ash and sludge can induce Ca2+:K+ soil imbalances and result in acute foliar K deficiencies. This was not observed in our experiment, probably because of the lower ash applications.
The significant CEC decreases observed at 8 months was likely a product of decreased soil carbon contents in the same interval. The elevated levels of ECEC at 4 months could have stemmed from the slash burning operation which may have resulted in a temporarily increase in CEC from variable charge sources ([14], [11]). After 8 months the CEC likely returned back to initial levels. Organic carbon greatly affects soil CEC and can be responsible for up to 80% of the CEC in highly weathered soils ([37]).
Foliar nutrient levels
Foliar macronutrients
Initially a foliar N limitation was expected given the chemical properties of the wood ash, but foliar analyses showed that the FCRF and FCV used in the experiment was able to sustain adequate N levels. After 8 months, FCRF outperformed FCV and was able to maintain higher and slightly more uniform foliar N concentrations over time. However, the critical value nutrient assessment method by Dell et al. ([5]) showed a strong likelihood that sub-optimal and deficient P and K foliar concentrations can be expected from wood ash additions. The significant decline in mean foliar P in the 4 and 8 month monitoring period was similar to results found by Ohno & Erich ([29], [28]). Incubation studies by Ohno & Erich ([28]) found that wood ash temporarily increases P and K plant availability, but the effects were brief and concentrations declined after the first 25 weeks. In a similar experiment, Ohno & Erich ([29]) concluded that the best predictor for P availability from wood ash is based on the level of P in the soil prior to ash application. Decreases in mean foliar K concentrations could be attributed to Ca2+:K+ soil imbalances from wood ash and pulp/paper residual applications on sandy soils ([16]).
Micronutrients
The Foliar Nutrient Critical Value method identified a single plot with a sub-optimal Zn concentration at both time intervals, but did not provide enough evidence to suggest that wood ash could induce potentially severe Zn deficiencies in foliage. In addition to time, the main effect of fertilizer type was statistically significant for foliar Na, Cu and Zn concentrations; F0 treated plots had the greatest concentrations relative to other fertilizer treatments. Nutrients absorbed by Eucalypts often become more diluted as total tree biomass increases over time ([3]). The decreased macro- and micronutrient concentrations observed at 8 months of age can potentially be explained by the translocation of nutrients in the tree with increasing age, and result in the dilution of nutrient concentrations. In addition, the increased foliar Mn, Zn and B micronutrient concentrations observed at 8 months could likely be a result of the temporary liming effect induced by the wood ash. Cationic micronutrient solubility is strongly governed by soil pH ([4]) and this may strongly affect foliar nutrient levels. Cationic micronutrients become increasingly available at slightly acidic soil conditions and less available to plants at slightly alkaline conditions ([4]). The availability of B usually increases when pH of moderately acid soils are raised.
Heavy metal concentrations
Soil concentrations
Cadmium, Hg, Cr and Pb concentrations were well-below the allowable limits set by the National Environmental Management: Waste Act of South Africa. Nonetheless, all soil heavy metal concentrations increased significantly from 4 to 8 months after trial establishment. This could be attributed to the solubility of the heavy metals and soil pH. Patterson ([30]) found that the solubility of heavy metals and trace elements like Cd and Zn increases as soon as pH values decrease below 6.5 and considerably more once pH values decrease from 6 to 5.5. The solubility of heavy metals in wood ash is low and can hinder root uptake ([23]). The trial site is located close to the industrial town of Richards Bay and the fallout generated by factories on the surrounding areas could likely also affect the background soil heavy metal concentrations.
Foliar concentrations
The increases in Cd, Hg, Cr and Pb concentrations were significant for the 4 month monitoring period, but the increases were small for the maximum tested wood ash application rate of 1.2 t ha-1. This showed that the tested heavy metals had a low bio-availability and were possibly affected by the edaphic conditions at the trial site (and the greater Richards Bay area). However, the increases were statistically significant and concentrations have to be carefully monitored if heavier wood ash applications are implemented.
Conclusion
This paper showed that up to 1.2 t ha-1 pure wood ash can safely be disposed of on a typical coastal arenosol with minimal environmental risk from Cd, Hg, Cr and Pb contamination. Furthermore, wood ash applications of 0.3 to1.2 t ha-1 on a poorly buffered sandy soil can induce a small temporary liming effect. The changes in soil pH and heavy metal concentrations showed that the maximum wood ash rate used in this experiment was effectively a conservative rate and a second application or increased application rates are possible. Cadmium, Hg, Cr and Pb concentrations in soil and foliar samples were well-below toxic levels for all application rates; nonetheless the soil levels increased over time and the foliage showed signs of bio-accumulation. This accentuates the importance of intensive soil monitoring if greater wood ash applications are to be implemented. This experiment showed that wood ash applications in combination with a supplementary N and P source can (to some extent) substitute nutrients removed from tree harvest operations, without severely affecting stand nutrition and nutrient stability. No ash treatments elicited a significant decrease in stand growth, and ash treatments in combination with NPS fertilizers showed that it can increase growth significantly up to 21 months after treatment implementation. In reference to the hypothesis formulated in the introductory section, we could thus accept part A (because ash application did not affect tree growth) but reject part B (because fertilization did improve growth). The addition of a supplementary N and P source is recommended if greater growth increases are expected from wood ash applications to a eucalypt plantation. The effects of wood ash on eucalypt growth and soil properties are site-specific, and it is essential that a comprehensive site-classification, soil analysis and buffer capacity tests are done to prevent the possibility of environmental degradation through over-application or heavy metal contamination.
The importance of this work lies in demonstrating that fertilization combined with wood ash disposal can be safely practiced on coastal plain plantations with low soil buffer capacity, whilst still increasing stand productivity. If implemented, the treatment will reduce pressure on landfill sites and at the same time mitigate against the impact of base cation removals caused by intensive plantation forestry practices over successive rotations.
References
Gscholar
Gscholar
Gscholar
Gscholar
Gscholar
Online | Gscholar
Gscholar
Online | Gscholar
Gscholar
Online | Gscholar
Gscholar
Authors’ Info
Authors’ Affiliation
Ben Du Toit
Department of Forest and Wood Science, Stellenbosch University, Private Bag X1, Matieland 7602 (South Africa)
Corresponding author
Paper Info
Citation
Scheepers GP, Du Toit B (2016). Potential for utilization of wood ash on coastal arenosols with limited buffer capacity in KwaZulu-Natal and its effect on eucalypt stand nutrition and growth. iForest 10: 180-188. - doi: 10.3832/ifor2146-009
Academic Editor
Claudia Cocozza
Paper history
Received: Jun 20, 2016
Accepted: Oct 04, 2016
First online: Nov 19, 2016
Publication Date: Feb 28, 2017
Publication Time: 1.53 months
Copyright Information
© SISEF - The Italian Society of Silviculture and Forest Ecology 2016
Open Access
This article is distributed under the terms of the Creative Commons Attribution-Non Commercial 4.0 International (https://creativecommons.org/licenses/by-nc/4.0/), which permits unrestricted use, distribution, and reproduction in any medium, provided you give appropriate credit to the original author(s) and the source, provide a link to the Creative Commons license, and indicate if changes were made.

Web Metrics
Breakdown by View Type
Article Usage
Total Article Views: 50074
(from publication date up to now)
Breakdown by View Type
HTML Page Views: 41276
Abstract Page Views: 3296
PDF Downloads: 4149
Citation/Reference Downloads: 49
XML Downloads: 1304
Web Metrics
Days since publication: 3510
Overall contacts: 50074
Avg. contacts per week: 99.86
Article Citations
Article citations are based on data periodically collected from the Clarivate Web of Science web site
(last update: Mar 2025)
Total number of cites (since 2017): 3
Average cites per year: 0.33
Publication Metrics
by Dimensions ©
Articles citing this article
List of the papers citing this article based on CrossRef Cited-by.
Related Contents
iForest Similar Articles
Research Articles
Validation of models using near-infrared spectroscopy to estimate basic density and chemical composition of Eucalyptus wood
vol. 17, pp. 338-345 (online: 03 November 2024)
Research Articles
Interaction between planting spacing and wood properties of Eucalyptus clones grown in short rotation
vol. 14, pp. 12-17 (online: 02 January 2021)
Research Articles
Stability analysis and selection of optimal Eucalyptus urophylla × E. grandis families
vol. 18, pp. 293-300 (online: 20 October 2025)
Research Articles
Variation of wood and bark density and production in coppiced Eucalyptus globulus trees in a second rotation
vol. 9, pp. 270-275 (online: 08 September 2015)
Research Articles
NIR-based models for estimating selected physical and chemical wood properties from fast-growing plantations
vol. 15, pp. 372-380 (online: 05 October 2022)
Research Articles
Variation of major elements and heavy metals occurrence in hybrid aspen (Populus tremuloides Michx. × P. tremula L.) tree rings in marginal land
vol. 13, pp. 24-32 (online: 15 January 2020)
Research Articles
Impact of rotation length of Eucalyptus globulus Labill. on wood production, kraft pulping, and forest value
vol. 15, pp. 433-443 (online: 20 October 2022)
Research Articles
Modelling taper and stem volume considering stand density in Eucalyptus grandis and Eucalyptus dunnii
vol. 14, pp. 127-136 (online: 16 March 2021)
Research Articles
Effect of stand density on longitudinal variation of wood and bark growth in fast-growing Eucalyptus plantations
vol. 12, pp. 527-532 (online: 12 December 2019)
Review Papers
Pathways to increase supply of sustainable wood from planted forests and trees to address bioeconomy needs: a review
vol. 19, pp. 168-185 (online: 12 May 2026)
iForest Database Search
Search By Author
Search By Keyword
Google Scholar Search
Citing Articles
Search By Author
Search By Keywords
PubMed Search
Search By Author
Search By Keyword


