Arthropod diversity in pure oak forests of coppice origin in northern Thrace (Turkey)
iForest - Biogeosciences and Forestry, Volume 8, Issue 5, Pages 615-623 (2014)
doi: https://doi.org/10.3832/ifor1318-007
Published: Dec 17, 2014 - Copyright © 2014 SISEF
Research Articles
Abstract
Oak (Quercus spp.) forests are among the most important forest types in Turkey. In the past, oak forests were managed through coppice clear-cutting, but in recent decades they have mostly been converted to high forest. This study was aimed at explaining how arthropod diversity is affected during conversion from coppice to high oak forest and during the early stages of coppice succession. We tested the hypothesis that arthropod richness, abundance and diversity in coppice oak sites varied according to stand age and a number of other forest characteristics. Arthropod communities were sampled in 50 plots using four different methods: pitfall traps, sweep nets, sticky cards and cloth shaking. A total of 13 084 individuals were collected and classified into 193 Recognizable Taxonomic Units (RTUs), with the most RTUs and the greatest number of specimens captured by sweep netting. We identified 17 taxa within RTU’s with more than 1% of the captured arthropods, which constituted 75% of the total specimens. The number of RTUs varied significantly according to trap type. Arthropod richness and Shannon-Wiener biodiversity index (H′) increased with elevation and precipitation. In young (1-40 yrs-old) and middle-aged (41-80 yrs) stands, arthropod biodiversity was not significantly affected by stand type, but slightly increased with diameter at breast height and tree height. Forest characteristics, such as the litter layer, understory and crown diameter, weakly influenced arthropod richness and abundance. Cluster analysis revealed that stand types and trap types differed taxonomically. Principal component analysis showed that stand types were clearly separated by the stand parameters measured. Insect families (Formicidae, Thripidae, Lygaeidae, Dolichopodidae, Luaxanidae, Cicadellidae and Ichneumonidae) could potentially be used as indicators of coppice oak conditions. As the coppice oak changes to mature forest, further studies are needed to better assess the relation between arthropods, forest types and structural characteristics of stands.
Keywords
Elevation, Quercus, Recognizable Taxonomic Units, Trap Types, Stand Types, Stand Characteristics
Introduction
Turkey is one of the world’s richest countries in terms of the variety of oak species and their extent. Oak forests cover vast areas in Northern Thrace (European Part of Turkey): 656 004 ha, or 27.7% of the entire land area, of which oak forests make up 71.7% of forest lands ([24]). In the past, most oak forests were managed as coppice via clear cuttings on 20-year rotations. However, the intensive use of the forest led to its long-term degradation. Therefore, Turkish General Directorate of Forestry abandoned such practice in the last decade, and now promotes conversion to high forest and natural regeneration from seeds.
Arthropods are often used as ecological indicators of ecosystem integrity ([17], [39], [31], [19], [25]). They play essential roles in ecosystems such as pollination, seed dispersal, nutrient cycling, and they serve as predators of pests and prey for valued vertebrates ([8], [42]). Arthropods also have short generation times and respond quickly to ecological changes ([44]). Habitat structure influences arthropod diversity and abundance ([35]). In general, systems that are more diverse, permanent, isolated and managed with low intensity are associated with high arthropod community diversity ([1]). Increasing plant diversity has been suggested as a means of increasing insect diversity ([37]) and thus lowering insect herbivore damage through decreased host plant density, increased interspecific competition among pest and non-pest species and improved natural enemy communities ([36]).
Arthropod species richness generally increases with stand age ([33], [4]), and richness and density of herbivorous insects are influenced by forest age ([14]). However, there is limited knowledge about arthropod diversity during the conversion of coppices to high oak forests and the early stages of succession of coppice oak forests in Turkey. In the present study, we hypothesized that arthropod richness, abundance and diversity at coppice oak sites increased with stand age. The objectives of our study were to: (1) identify differences in forest characteristics among forest stand types; (2) characterize differences in arthropod richness, diversity, and abundance among forest stand types, and (3) relate invertebrate taxa to method of capture and to forest stand characteristics.
Materials and methods
Study sites
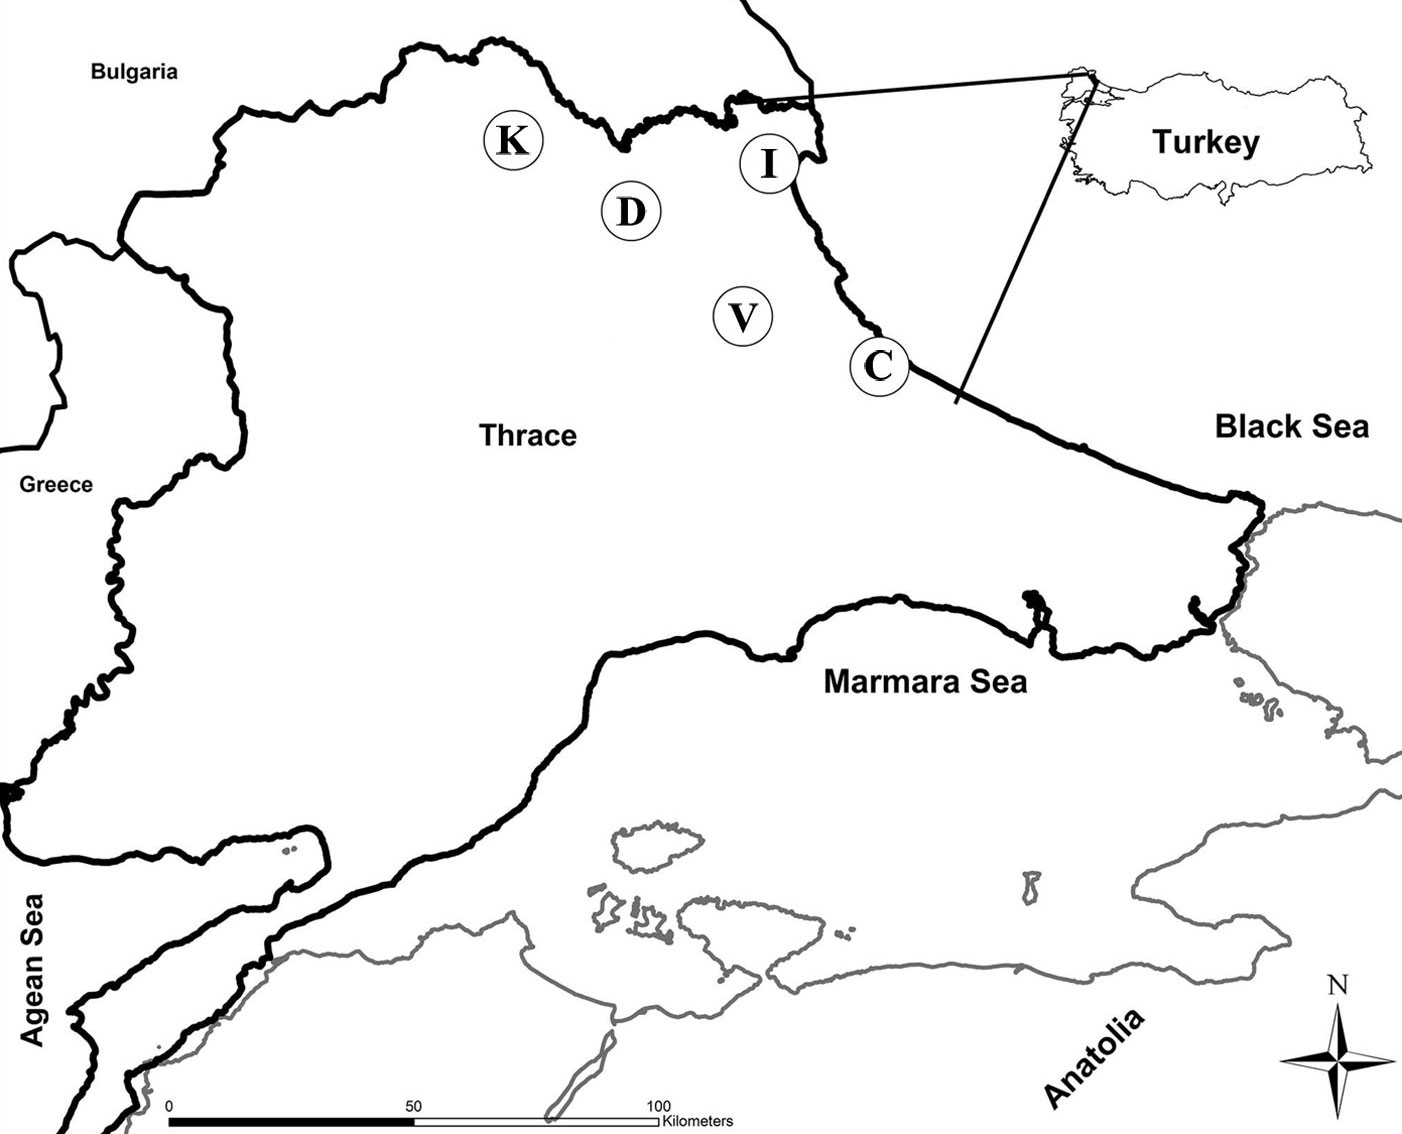
This study was carried out in pure oak stands growing at five different sites (Catalca, Demirkoy, Igneada, Kirklareli and Vize) in the Northern Thrace, Turkey (Fig. 1). Sites were coppice-originated forests, but currently are being converted to high forest. Climate (precipitation, temperature and water deficit) and elevation varied among areas (Tab. 1). Common oak species are Sessile oak (Quercus petraea (Mattuschka) Liebl.), Hungarian oak (Q. frainetto Ten.) and Turkey oak (Q. cerris L. - [24]). The previous history of rotations and the clear-cut schedules were unfortunately unknown for coppices at the study sites.
Fig. 1 - Map of Northern Thrace (Turkey) with the location of sampling sites (circles). (C): Catalca; (D): Demirkoy; (I): Igneada; (K): Kirklareli; (V): Vize.
Tab. 1 - Main characteristics of the oak sampling sites (source: [24]).
| Sampling Site |
Mean Elevation (m) |
Min-max slope (%) |
Mean annual precipitation (mm) |
Average annual temp. (°C) |
Annual water deficit (mm) |
|---|---|---|---|---|---|
| Catalca (C) | 290 | 0-20 | 844 | 14 | 212 |
| Demirkoy (D) | 680 | 10-60 | 1053 | 11 | 84 |
| Igneada (I) | 125 | 0-90 | 867 | 13 | 181 |
| Kirklareli (K) | 500 | 0-50 | 550 | 14 | 274 |
| Vize (V) | 320 | 0-45 | 720 | 12 | 244 |
Stand formations at each study plot were identified through forest management plans and field studies. Stands were classified by mean diameter at breast height (DBH) as: “a” 0-8 cm; “b” 9-20 cm; and “c” 21-36 cm; or as degraded stands (“Dg”) with a canopy closure of less than 10%, following categories used by the Ministry of Forestry and Water Affairs of the Republic of Turkey. Stand ages were determined according to Leatherberry et al. ([21]).
Data collection and arthropods sampling
For faunal studies, we selected a total of 50 plots distributed across different elevations (10-800 m), slopes (0-90 %) and locations (Fig. 1, Tab. 1). Sampling was conducted in four different stand types (“a”, “b”, “c” and “Dg”) at each of the five sampling sites. In each stand, sampling was replicated three times except for degraded stands (“Dg”), which only had one replicate. Each plot was 100 × 100 m, with plot coordinates and elevation determined by GPS. Tree species, number of tree per hectare and percentage of snags were determined by counting trees from a 20 × 20 m centrally-located sub-plot. We measured DBH, tree height and crown diameter of trees. DBH was measured using tree calipers and tree height with an altimeter. Crown diameter was measured using the diametric projection of the tree crown on the litter by a measuring tape. Litter mass, which consisted of shed vegetation parts, and understory mass, which was comprised of herbaceous plants, were also recorded. Five samples were collected from the understory and litter in each plot. Understory samples were taken by cutting above-ground parts of all herbaceous mass in a 1 m2 area, while samples of the litter were taken from a 0.25 m2 (50 × 50 cm) area by collecting all litter over mineral soil. In the laboratory, understory and litter samples were dried at 70 °C for > 24 h to a constant mass and weighed ([24]).
Arthropods were sampled in July 2009 at each of the 50 plots using four different trapping methods: pitfall traps ([44]), sweep netting ([34]), sticky cards ([11]) and cloth shaking ([1]). Each 100 × 100 m plot was divided into 16 subplots (25 × 25 m) and enumerated for allocation of sampling points. For pitfall traps, four holes, 15 cm in diameter and 15 cm in depth, were made in the ground. Pitfall traps (plastic cups) were placed and checked 24 h later for soil-dwelling arthropods. Traps were set at equal distances along the diagonal at subplots numerated as 1, 6, 11 and 16 in each sample plots and filled to a depth of 2 cm with ethylene glycol as a preservative. Three of the 200 cups were damaged by wild boar (Sus scrofa). Twenty sweeps with a sweep net were collected from two randomly chosen subplots; these samples were used to evaluate the diversity and number of arthropods present in ground vegetation. Yellow sticky cards, 15 × 30 cm, were hung on a randomly selected tree in subplots 7 and 10, placed at approximately mid-canopy height for canopy arthropods and removed 24 h later. Cloth-shaking sampling was used to sample arthropods in the oak canopies. A tree in each of two randomly selected subplots was shaken three times over a piece of cloth (3 × 3 m), using the branches rather than the stem for trees thicker than 5 cm DBH. Arthropods falling on the cloth were collected and preserved.
Data nalyses
We determined the number of trees per hectare, average DBH, height and crown diameter in the sampling plots. To test for differences between forest variables, including litter mass (kg ha-1), understory mass (kg ha-1), tree density (no ha-1), percentage of snags at sampling sites (Catalca, Demirkoy, Igneada, Kirklareli, Vize), and stand types (“a”, “b”, “c” and “Dg”), we used one-way analysis of variance (ANOVA). Collected arthropods were counted and categorized into Recognizable Taxonomic Units (RTUs), based on easily recognized features which can be used for rapid assessment of biodiversity ([28]). We calculated diversity index (Shannon-Wiener H′) based on RTUs. ANOVA was used to compare the number of RTUs, H′ and number of specimens on sampling sites to stand types. Because of the high degree of variation in arthropod densities, significance was set at α = 0.10. Separate regressions were performed to examine the relationship between percentage of snags and total arthropods, the litter mass and soil-dwelling arthropods, and between understory mass and arthropods present in the understory. We determined taxa within RTUs that comprised more than 1% of the total, which in turn constituted 75% of all specimens. Each group of RTU specimens were compared between stand types and trapping method. We also made use of Akaike’s Information Criterion (AIC) to describe the best model determined by the smallest AICc value ([5]) with H′ and DBH, height and crown diameter related to stand type. Cluster analysis and analysis of similarity (ANOSIM) was used to categorize sampling plot and trap types by RTU, using Ward’s linkage and Bray-Curtis distance metrics. Principal component analysis (PCA) was used to differentiate stand types based on all parameters measured in the study. To determine the degree of importance for each parameter in the ordination model, a Pearson’s (r) correlation analysis was conducted between variables. All tests were carried out using the software package RGui version 3.0.2 ([30]).
Results
Stand characteristics
Three oak species (Sessile oak, Hungarian oak and Turkey oak) were present in the sampling plots. Sessile oak was the most common species at all sites except at Igneada, where Hungarian oak was the most prevalent species. Although Sessile oak was dominant in Demirkoy and Catalca, the other oak species also were prevalent in Vize and Kirklareli. Additional forest tree species were ash (Fraxinus excelsior L., F. ornus L.), Oriental beech (Fagus orientalis Lipsky), maple (Acer campestre L., A. platanoides L.), hornbeam (Carpinus betulus L., C. orientalis Mill.). Fruit-bearing shrubs were also recorded, such as rowan (Sorbus aucuparia L., S. domestica L., S. torminalis L.), common hawthorn (Crataegus monogyna Jacg.), wild plum (Prunus avium L., P. divaricate Ledep., P. spinosa L.), dogwood (Cornus mas L.), wild apple (Malus sp.) and medlar (Mespilus germanica L.). The average age of trees in the stand type “a” was 13 ± 5 years, 63 ± 8 in type “b” and 76 ± 15 in type “c”. Stand type “a” was categorized as “young” (1-40 years old), while “b” and “c” as “middle-aged” (41-80 years old).
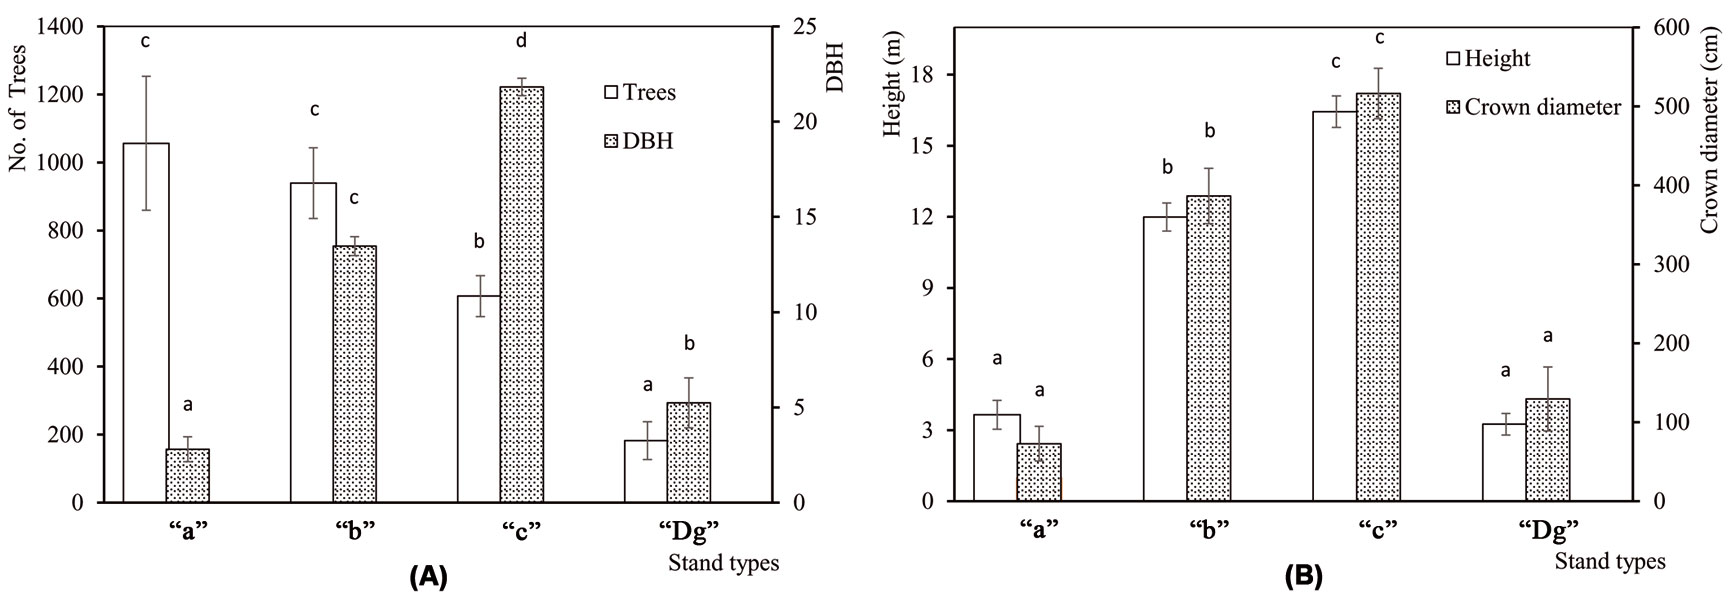
The understory mass and the percentage of snags were significanty different among sampling sites (F[4, 45] = 3.54, P = 0.014 and F[4, 45] = 2.83, P = 0.036, respecively), while no differences were detected in litter mass among sites (F[4, 45] = 0.14, P = 0.967). The understory and snags were most abundant in Demirkoy (Fig. 2a). Differences among stand types were significant for understory (F[3, 46] = 4.95, P = 0.005) and litter (F[3, 46] = 52.82, P <0.001), but not for snags (F[3, 46] = 1.01, P = 0.398). Litter mass was highest in “c” stands, and the understory mass was greatest in “Dg” stands (Fig. 2b). Number of trees per hectare was significantly different (F[3, 46] = 5.135, P = 0.004) among stand types. The standard deviation was high in young stands, and decreased with age. DBH (F[3, 46] = 198, P <0.001), height (F[3, 46] = 92.2, P <0.001) and crown diameter (F[3, 46] = 40.9, P <0.001) increased with age (Fig. 3a, Fig. 3b).
Fig. 2 - (A) Mean understory mass and percentage of snags at the five sampling sites analyzed. (C: Catalca; D: Demirkoy; I: Igneada; K: Kirklareli; V: Vize). (B) Mean understory mass and litter mass in the 4 stand types analyzed. (“a”: mean DBH 0-8 cm; “b”: 9-20 cm; “c”: 21-36 cm; “Dg”: degraded stands with a canopy closure < 10%). Error bars represent the standard deviation. Different letters among bars indicate significant differences after ANOVA (p<0.05).
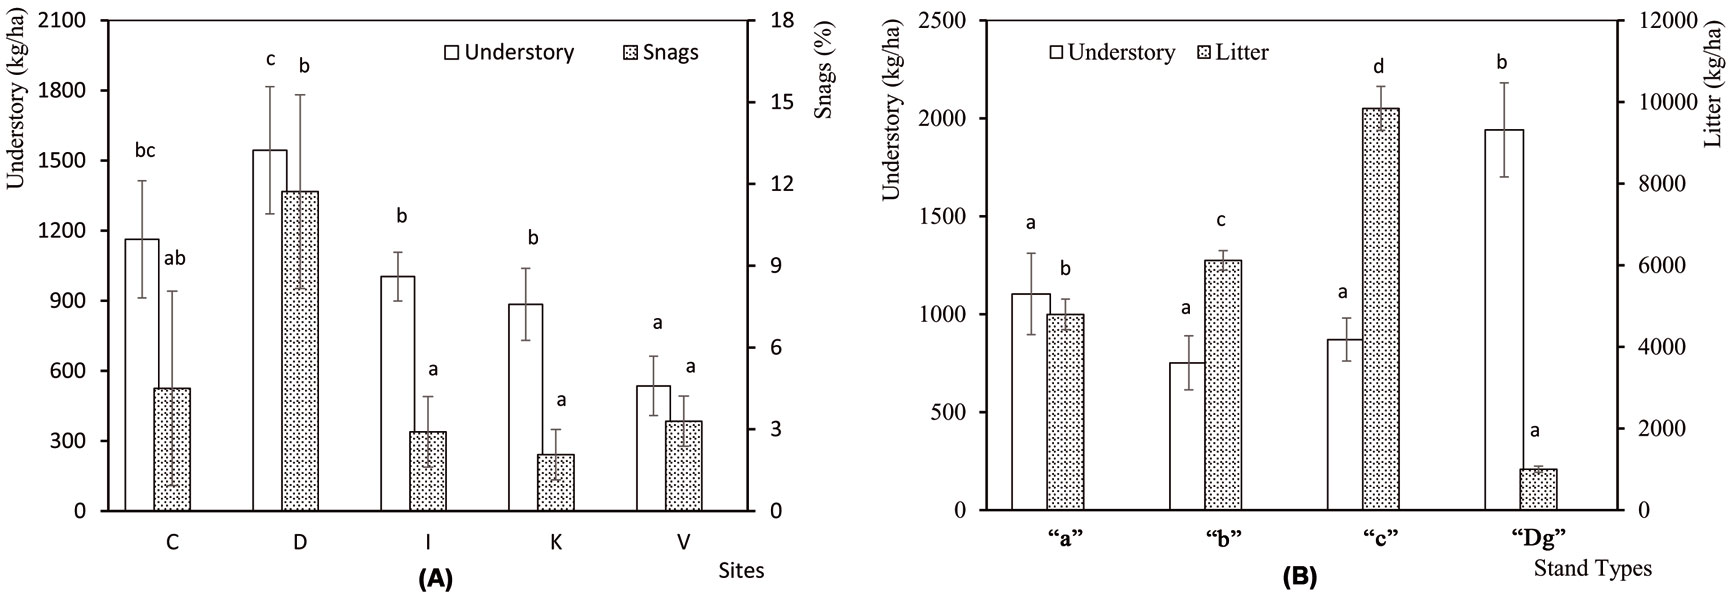
Fig. 3 - Mean structural characteristics of the four stand type classes analyzed. (A) Mean number of trees per hectare (Trees) and diameter at breast height (DBH). (B) Tree height and crown diameter. (“a”): mean DBH 0-8 cm; (“b”): mean DBH 9-20 cm; (“c”): mean DBH 21-36 cm; (“Dg”): degraded stands with a canopy closure < 10%. Error bars represent the standard deviation. Different letters among bars indicate significant differences after ANOVA (p<0.05).
Arthropod data
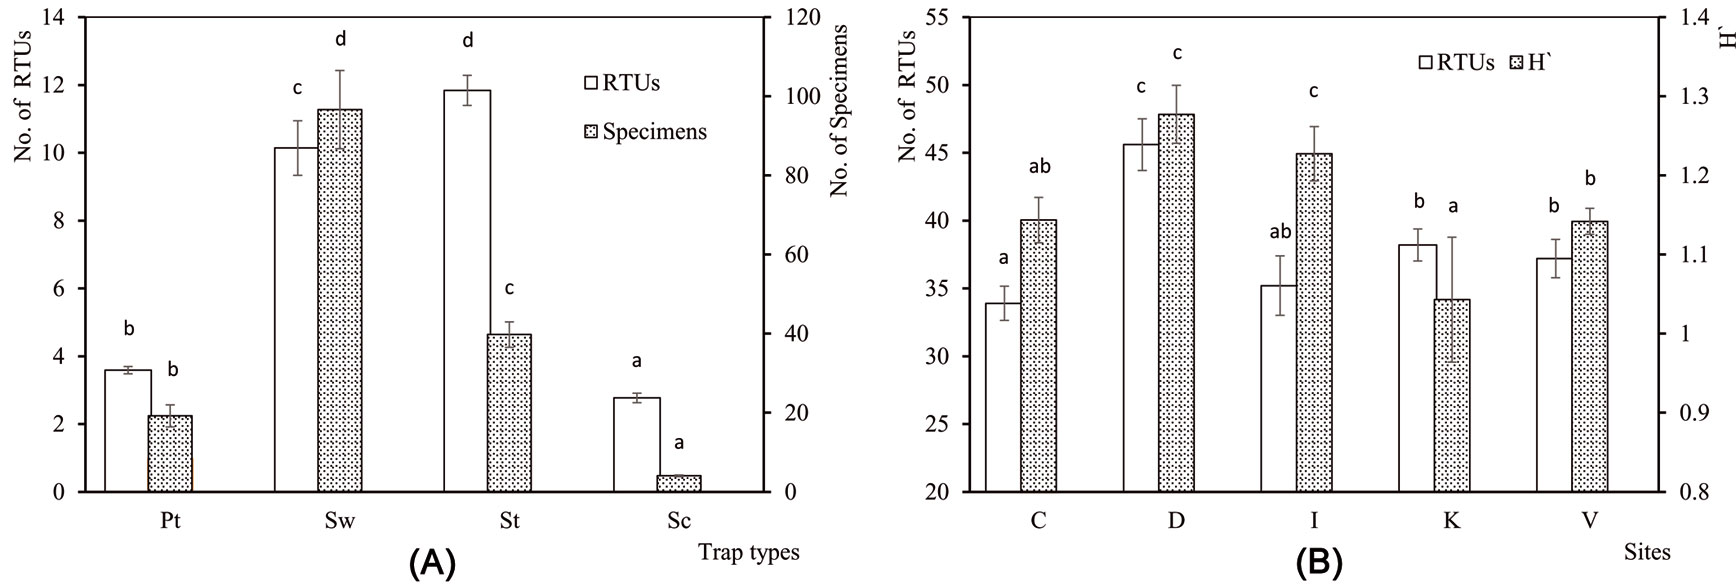
In total, arthropod sampling caught 13 084 individuals of 193 RTUs from the four combined sampling methods (Tab. 2). The number of RTUs (F[3, 493] = 73.31, P <0.001) and the number of specimens (F[3, 493] = 531.8, P <0.001) varied according to trapping methods. Most taxa were captured with sweepnets, and most specimens with sticky traps (Fig. 4a). The ANOVA revealed a significant influence of the sampling site on the number of RTUs (F[4, 45] = 10.56, P <0.001) and H′ (F[4, 45] = 2.60, P = 0.048), but not on the number of specimens (F[4, 45] = 1.51, P = 0.214). H′ was higher in Demirkoy and Igneada and more taxa were counted in Demirkoy (Fig. 4b). Based on the results of multiple regression analyses, elevation (E) and precipitation (Pr) significantly affected the number of RTUs (y = 28.65 + 0.019 E + 0.002 Pr, R2 = 0.41, P <0.001), the number of specimens (y = 187.62 + 0.224 E - 0.028 Pr, R2 = 0.14, P = 0.036) and H′ (y = 0.819 + 0.00014 E + 0.00035 Pr, R2 = 0.18, P < 0.001).
Tab. 2 - The number of arthropod Recognizable Taxonomic Units (RTU’s) and individuals (in parentheses) collected by the different sampling methods.
| Trap type | Number of traps |
No. of RTUs (max) |
No. of specimens (max) |
Means of specimens (± SE) |
|---|---|---|---|---|
| Pitfall Trap (Pt) | 197 | 46 (7) | 3783 (461) | 19.20 ± 2.79 |
| Sweepnet (Sw) | 100 | 143 (32) | 4833 (148) | 48.33 ±3.53 |
| Sticky Trap (St) | 100 | 98 (26) | 4062 (187) | 40.62 ±3.25 |
| Shaking (Sc) | 100 | 48 (7) | 406 (10) | 4.06 ±0.23 |
| Total | 497 | 193 | 13084 | 26.33 ± 2.09 |
Fig. 4 - Relationships between species characteristics, trap types and sampling sites. (A) Mean number of Recognizable Taxonomic Units (RTUs) and mean number of specimens collected by different trap types (Pt: Pitfall trap, Sw: Sweepnet, St: Sticky trap, Sc: Shaking). (B) Mean number of RTUs and Shannon-Wiener index (H′) across sampling sites (C: Catalca, D: Demirkoy, I: Igneada, K: Kirklareli, V: Vize). Error bars represent the standard deviation. Different letters among bars indicate significant differences after ANOVA (p<0.05).
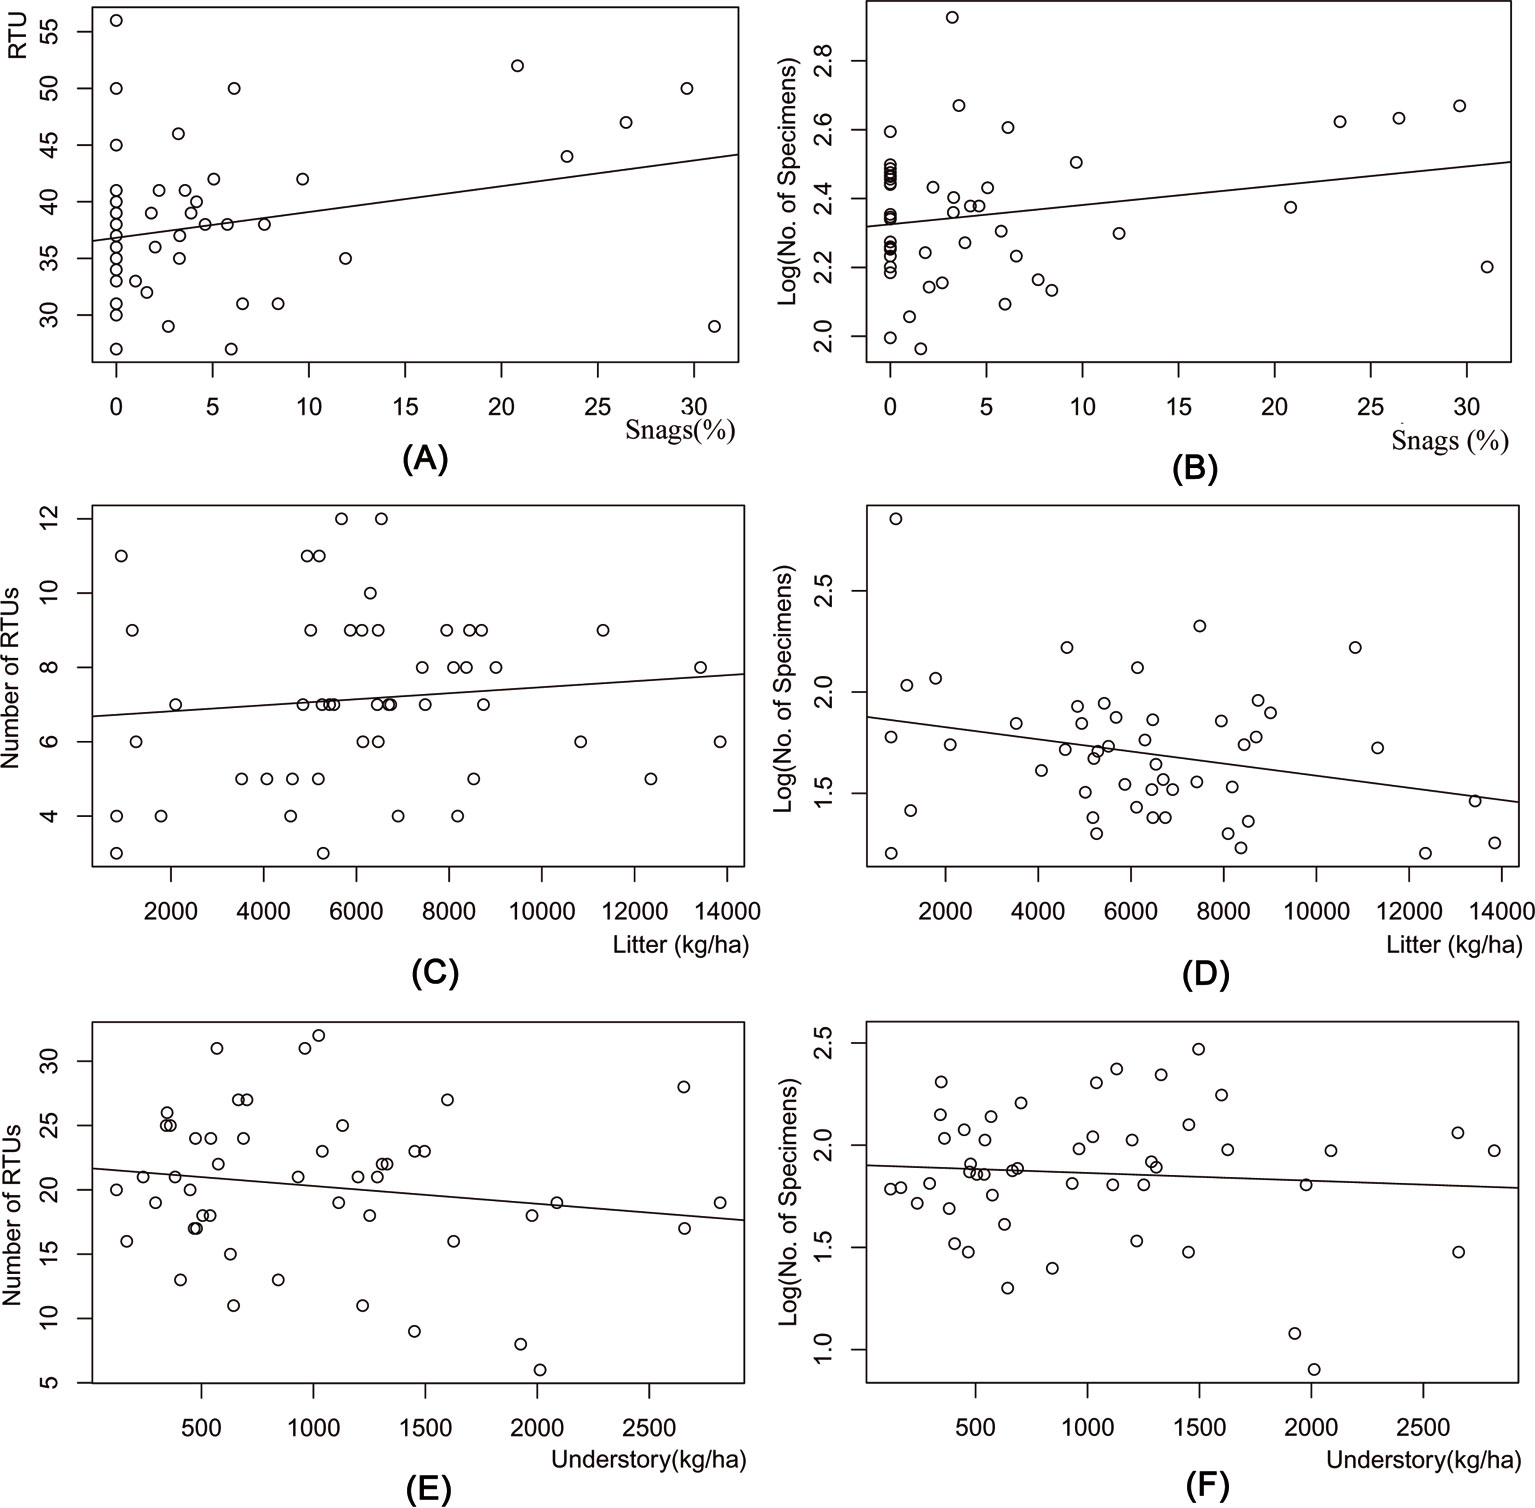
In the pitfall samples, the number of RTUs (y = 36.82 + 0.228x, R2 = 0.074, P <0.001) and the number of specimens (y = 2.325 + 0.006 x, R2 = 0.055, P <0.001) was positively influenced by the percentage of snags (Fig. 5a, Fig. 5b). There was a weak positive relation between the litter layer mass and the number of RTUs (y = 6.658 + 8.10-5 x, R2 = 0.012, P <0.001), and a weak negative relation between litter layer mass and the number of specimens (y = 1.886 - 3.10-5 x, R2 = 0.078, P<0.001 - Fig. 5c, Fig. 5d). Also, in the sweep net samples, there was no clear relationship between understory mass and the number of RTUs (y = 21.683 - 0.0014 x, R2 = 0.026, P <0.001), or with understory mass and number of specimens (y = 1.902 - 3·10-5 x, R2 = 0.006, P <0.001 - Fig. 5e, Fig. 5f).
Fig. 5 - Results of the regression analysis between arthropod diversity and stand structural characteristics. (A): Number of Recognizable Taxonomic Units (RTU) vs. percentage of snags; (B): number of specimens (log) vs. percentage of snags; (C): number of RTU (based on pitfall trapping only) vs. litter mass; (D) number of specimens (log) from pitfall trapping only vs. litter mass; (E): number of RTU (based on sweepnet sampling only) vs. understory mass; (F); number of specimens (log) from sweepnet sampling only vs. understory mass.
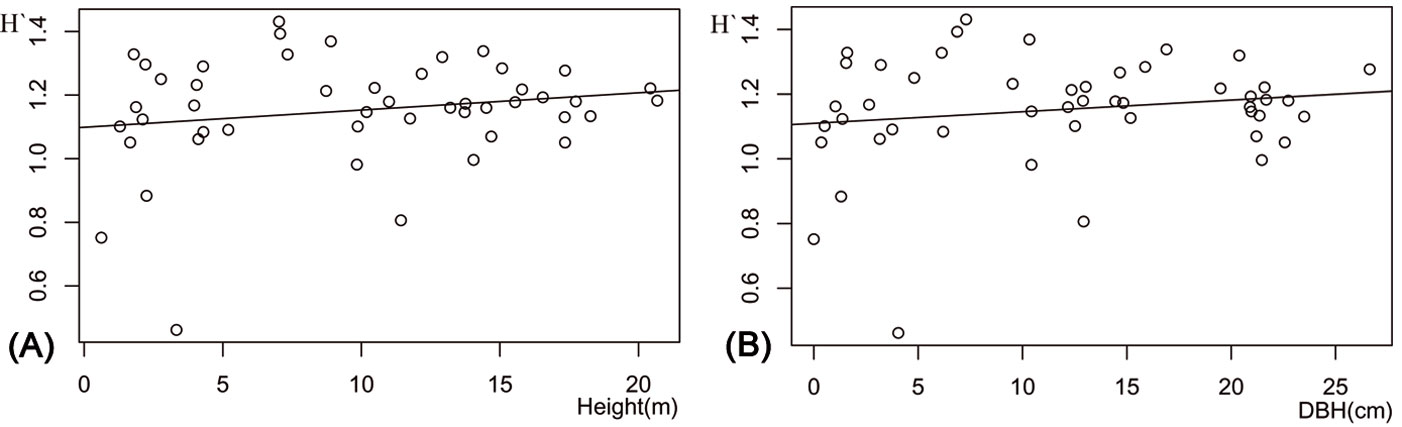
Stand types did not significantly differ in their diversity indices (F[3, 46] = 0.42, P = 0.743), the number of RTUs (F[3, 46] = 0.446, P = 0.722) or in the number of specimens (F[3, 46] = 0.580, P = 0.631). The relationship between DBH and RTU richness was weak, but positive (y = 37.75 + 0.016 x, R2 = 0.003, P <0.001), while that between DBH and the number of specimens was weakly negative (y = 263.23 - 1.16 x, R2 = 0.005, P <0.001). The best predictive models for the Shannon-Wiener index was determined based on the smallest AICc values. For AICc <2, these were H′ = 1.0987 + 0.0054·height and H′ = 1.1096 + 0.001·DBH (Tab. 3). The relation between arthropod H′ and tree DBH and height was weak (Fig. 6a, Fig. 6b). Also, the composite model for Shannon-Wiener index was H′ = 1.10793 + 0.0018·DBH + 0.0051 ·height - 0.0067·crown diameter. In the model, tree height (t49 = 22.92, P <0.001), DBH (t49 = 25.06, P <0.001) and the composite model (t49 = 19.46, P <0.001) were significant for H′.
Tab. 3 - AICc statistics of the 7 regression models for the prediction of Shannon-Wiener index (H′) of arthropod diversity using diameter at breast height (DBH), height and crown diameter of trees as predictors (n=50). Models are sorted from the lowest to the highest ΔAICc value. The total number of estimable parameters (K) and Akaike weights (wi) are reported.
| Model | DBH (cm) |
Height (m) |
Crown diameter (m) |
K | AICc | ΔAICc | wi | R2 |
|---|---|---|---|---|---|---|---|---|
| 1 | - | × | - | 2 | -30.090 | 0.000 | 0.3304 | 0.04 |
| 2 | × | - | - | 2 | -29.732 | 0.358 | 0.2763 | 0.03 |
| 3 | - | × | × | 3 | -27.903 | 2.187 | 0.1107 | 0.07 |
| 4 | × | × | - | 3 | -27.873 | 2.217 | 0.1090 | 0.04 |
| 5 | - | - | × | 2 | -27.276 | 2.814 | 0.0809 | <0.01 |
| 6 | × | - | × | 3 | -26.650 | 3.440 | 0.0591 | 0.04 |
| 7 | × | × | × | 4 | -25.520 | 4.570 | 0.0336 | 0.07 |
Fig. 6 - Variation of the Shannon-wiener index (H′) with (A) mean tree height and (B) mean diameter at breast height (DBH) of the sampled stands.
Overall, seventeen taxa within RTUs were found to comprise more than 1% of the captured arthropods, corresponding to 75% of the total specimens. Each of the 17 taxa varied significantly based on trap type (P < 0.01 - Tab. 4). There was a mid-level positive relation between DBHs and number of specimens of Cicadellidae and Ichneumonidae (R = 0.42), and a mid-level negative relation between DBHs and number of specimens of Lygaeidae (R = -0.32) and Thripidae (R = -0.38). Significant differences among stand types were found for Dolichopodidae (F[3, 46] = 2.495, P = 0.072), Lygaeidae (F[3, 46] = 2.459, P = 0.075), Cicadellidae (F[3, 46] = 3.358, P = 0.027), Formicidae (F[3, 46] = 2.713, P = 0.056), Ichneumonidae (F[3, 46] = 5.051, P = 0.004) and Thripidae (F[3, 46] = 2.452, P = 0.076 - Tab. 4).
Tab. 4 - Number and percentage of specimens (with abundance > 1%) classified in each Recognizable Taxonomic Units (RTU) using the four sampling methods described (pitfall traps, sweepnet, sticky traps, shaking), and their average (± standard error) across the four stand type classes considered. (“a”): mean DBH 0-8 cm; (“b”): mean DBH 9-20 cm; (“c”): mean DBH 21-36 cm; (“Dg”): degraded stands with a canopy closure < 10%. All taxa varied significantly among trap types (P <0.01). (R): Correlation coefficient with the average diameter at breast height (DBH) of plots and the number of specimens. (P): p-value after ANOVA between stand types and the number of specimens. (*): p<0.1; (**): p<0.05).
| RTU | Perc.(%) | No. of Specimens |
Sampling Method | Stand type | R | P | ||||||
|---|---|---|---|---|---|---|---|---|---|---|---|---|
| Pitfall Traps |
Sweepnet | Sticky Traps |
Shaking | “a” | “b” | “c” | “Dg” | |||||
| Araneae | 13 | 1691 | 414 | 1070 | 78 | 129 | 29.5±4.1 | 33.3±5.0 | 37.5±3.9 | 37.2±5.4 | 0.17 | 0.475 |
| Insecta | 1 | 146 | 0 | 4 | 140 | 2 | 5.2±2.7 | 2.5±0.9 | 1.5±0.7 | 1.6±0.4 | -0.13 | 0.830 |
| Lepidoptera | 1 | 136 | 0 | 119 | 12 | 5 | 2.3±0.6 | 3.2±0.7 | 3.0±0.5 | 1.6±0.4 | 0.15 | 0.509 |
| Chalcidoidea | 6 | 766 | 5 | 142 | 614 | 5 | 15.2±2.3 | 15.7±4.6 | 14.6±2.7 | 16.8±3.1 | -0.04 | 0.985 |
| Chrysomelidae | 1 | 133 | 0 | 71 | 52 | 10 | 4.0±1.3 | 1.9±0.7 | 1.8±0.6 | 3.4±1.6 | -0.25 | 0.459 |
| Entomobryidae | 2 | 249 | 249 | 0 | 0 | 0 | 4.4±1.1 | 5.5±1.3 | 5.8±2.0 | 2.8±1.2 | 0.20 | 0.686 |
| Dolichopodidae | 2 | 233 | 6 | 140 | 86 | 1 | 5.5±2.5 | 3.2±0.7 | 3.3±0.7 | 10.6±4.2 | -0.15 | 0.072* |
| Luaxanidae | 1 | 142 | 0 | 21 | 120 | 1 | 3.5±0.5 | 2.8±0.6 | 2.5±0.6 | 1.8±0.7 | -0.08 | 0.517 |
| Lygaeidae | 2 | 272 | 2 | 267 | 0 | 3 | 17.0±15.4 | 0.1±0.1 | 0.5±0.3 | 1.8±1.3 | -0.34 | 0.075* |
| Aphidae | 2 | 227 | 0 | 164 | 56 | 7 | 3.7±0.8 | 3.9±1.1 | 6.6±3.8 | 2.6±1.7 | 0.17 | 0.639 |
| Cercopidae | 3 | 411 | 2 | 282 | 123 | 4 | 4.7±1.5 | 8.4±3.2 | 13.5±5.6 | 2.4±1.9 | 0.22 | 0.296 |
| Cicadellidae | 7 | 864 | 3 | 347 | 509 | 5 | 8.0±1.4 | 18.3±3.2 | 27.8±7.0 | 10.4±2.8 | 0.42 | 0.027** |
| Braconidae | 3 | 446 | 0 | 54 | 392 | 0 | 9.4±4.6 | 6.7±2.3 | 12.7±6.5 | 2.8±1.1 | 0.10 | 0.640 |
| Formicidae | 23 | 2945 | 2673 | 166 | 15 | 91 | 57.6±15.1 | 44.7±13.1 | 36.7±10.1 | 172.0±130.1 | -0.22 | 0.056* |
| Ichneumonidae | 1 | 132 | 0 | 85 | 46 | 1 | 1.4±0.3 | 3.1±0.6 | 3.9±0.7 | 1.0±0.8 | 0.42 | 0.004** |
| Tettigoniidae | 2 | 213 | 3 | 189 | 0 | 21 | 4.0±1.0 | 4.6±1.4 | 4.7±1.4 | 2.8±1.1 | 0.11 | 0.723 |
| Thripidae | 7 | 856 | 0 | 14 | 842 | 0 | 39.2±14.6 | 9.9±3.0 | 5.7±1.0 | 7.0±2.7 | -0.38 | 0.076* |
| Others | 25 | 3222 | 426 | 1698 | 977 | 121 | - | - | - | - | - | - |
| Total | 100 | 13084 | 3783 | 4833 | 4062 | 406 | - | - | - | - | - | - |
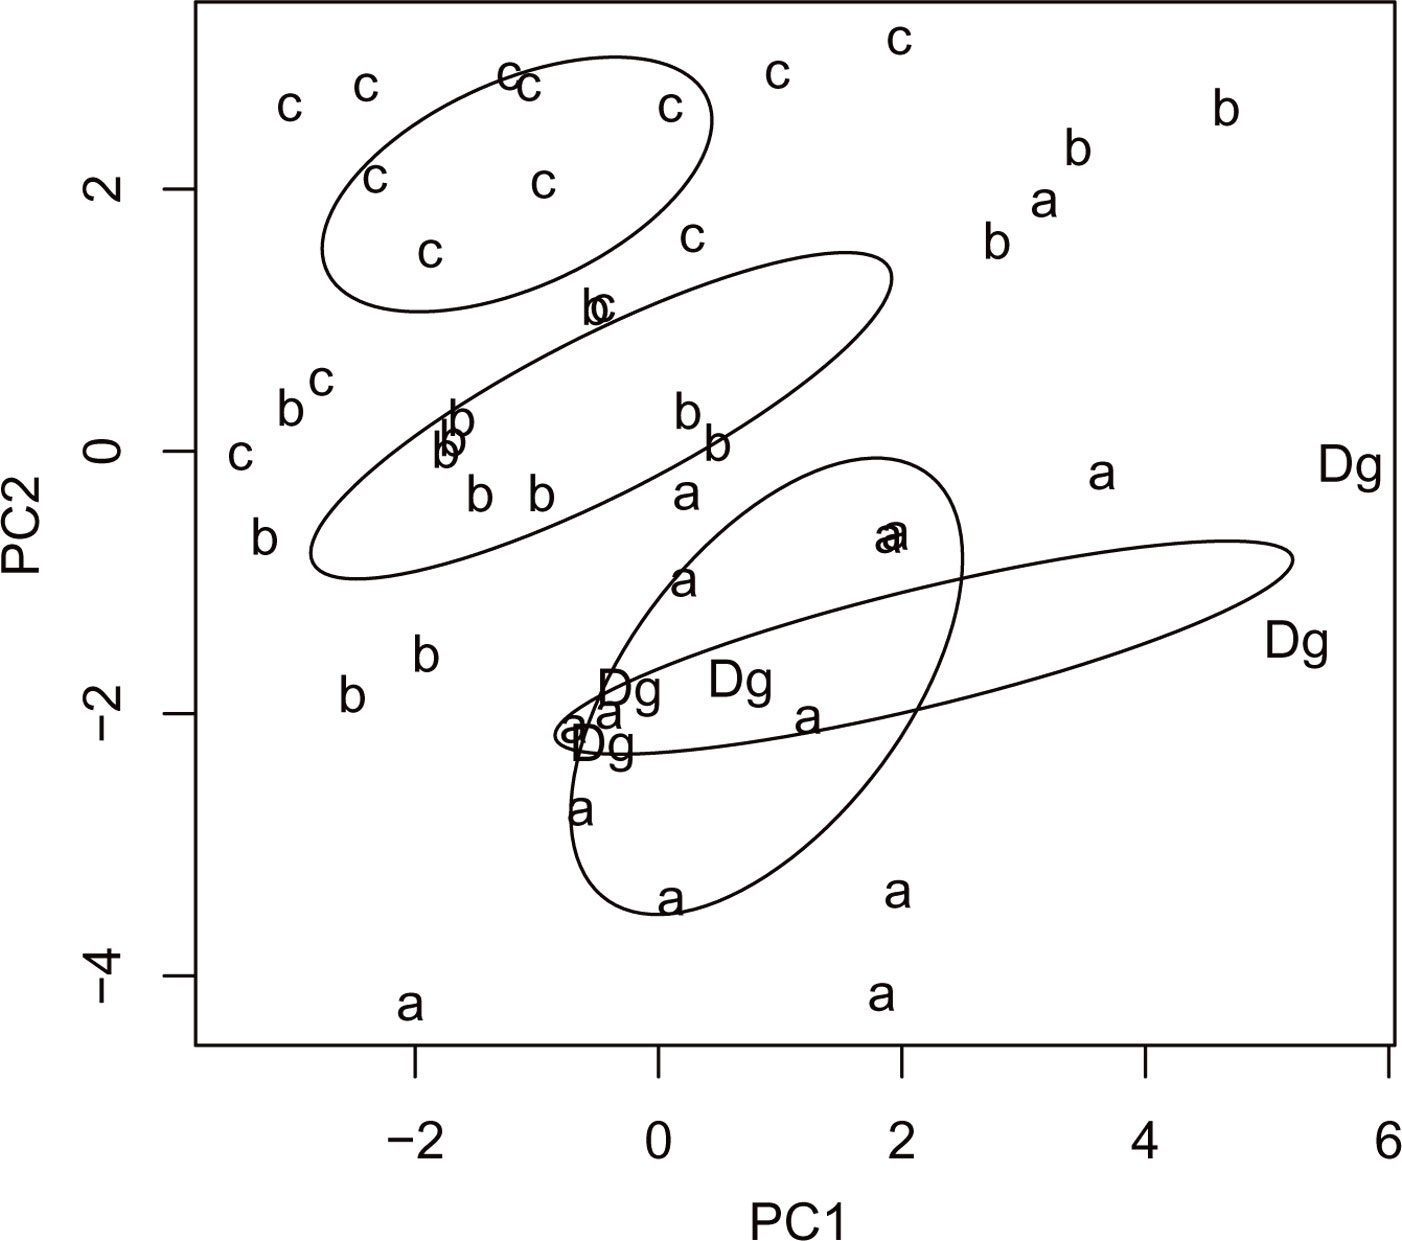
Cluster analysis of stand types based on RTUs formed three large clusters, showing that both sampling sites and stand types were significantly dissimilar (R = 0.15, P = 0.038 and R = 0.255, P = 0.001, respectively - Fig. 7), as well as trap types (R = 0.823, P <0.001 - Fig. 8). Results of the PCA based on 19 parameters (total number of RTU and total number of specimens across all trap types; number of RTUs and number of specimens within each trap type: pitfall trap, sweepnet, sticky trap and cloth shaking; H′; elevation; number of trees per ha; DBH; height; crown diameter; percentage of snags; litter mass; understory mass) showed a fairly good discrimination of stand types along the first two axes (Fig. 9), with significant differences among stand type classes (F[3, 44] = 4.43, P <0.001). The first principal component (PC1) accounted for approximately 27% of the total variation, and showed a high correlation with total number of RTUs (r = 0.73), RTUs richness in sticky trap sampling (r = 0.73), and elevation (r = 0.69). PC2 explained 21% of the total variation, and showed the highest correlations with DBH (r = 0.79), tree height (r = 0.72) and RTU in sweep net sampling (r = 0.71 - Fig. 9).
Fig. 7 - Cluster analysis of stand types based on the similarity of Recognizable Taxonomic Units (RTU) using Ward’s linkage and Bray-Curtis distance metrics. The first letter of labels refers to sampling sites (C: Catalca; D: Demirkoy; I: Igneada; K: Kirklareli; V: Vize), the second letter refers to stand types (“a”: mean DBH 0-8 cm; “b”: mean DBH 9-20 cm; “c”: mean DBH 21-36 cm; “Dg”: degraded stands with a canopy closure < 10%).
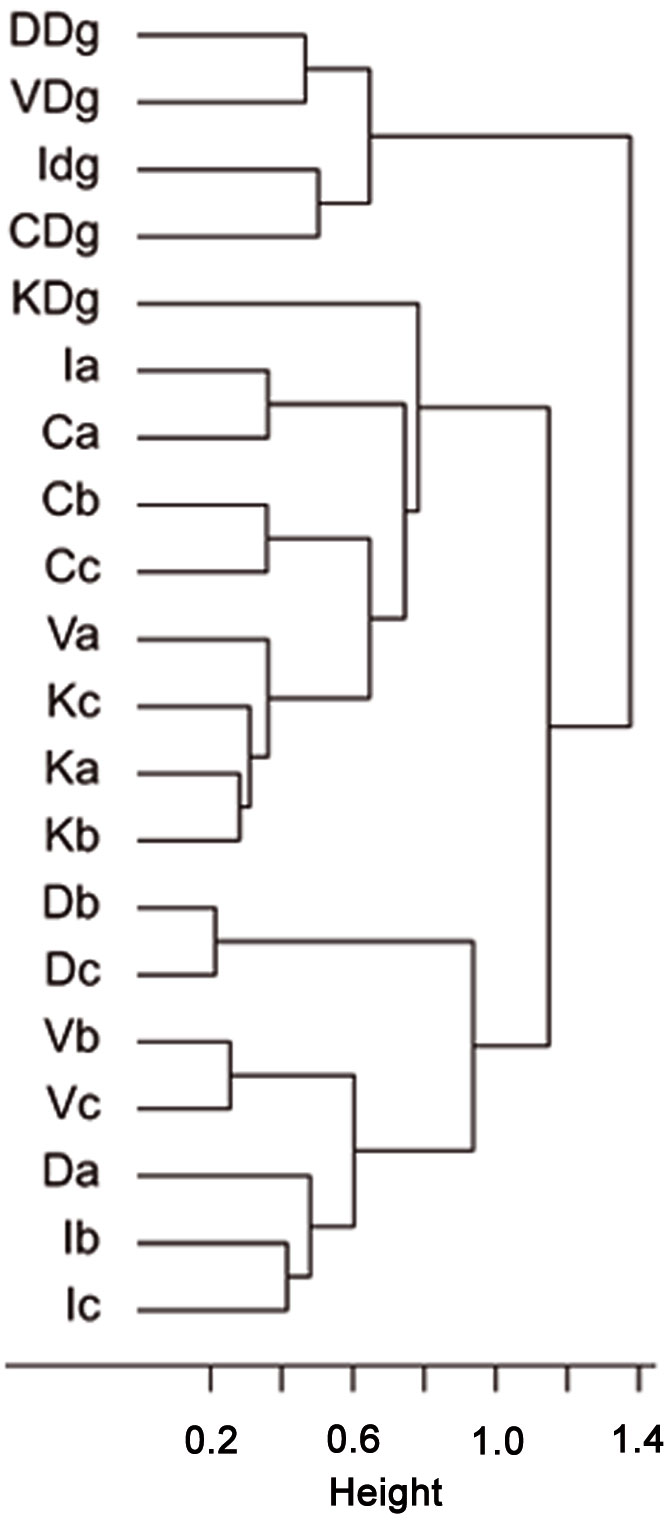
Fig. 8 - Cluster analysis of different sampling methods adopted at the different stand types and sampling sites, based on the similarityy of Recognizable Taxonomic Units (RTU) using Ward’s linkage and Bray-Curtis distance metrics. The dendrogram indicate a greater separation between soil-dwelling arthropod composition and canopy or sub-canopy arthropod composition than between canopy and sub-canopy arthropod communities. The first letter of labels refers to sampling sites (C: Catalca; D: Demirkoy; I: Igneada; K: Kirklareli; V: Vize), the second letter refers to stand types (“a”: mean DBH 0-8 cm; “b”: mean DBH 9-20 cm; “c”: mean DBH 21-36 cm; “Dg”: degraded stands with a canopy closure < 10%), while the last letter(s) refers to the sampling method (P: Pitfall trap; Sw: Sweepnet; SS: Sticky trap and Shaking).
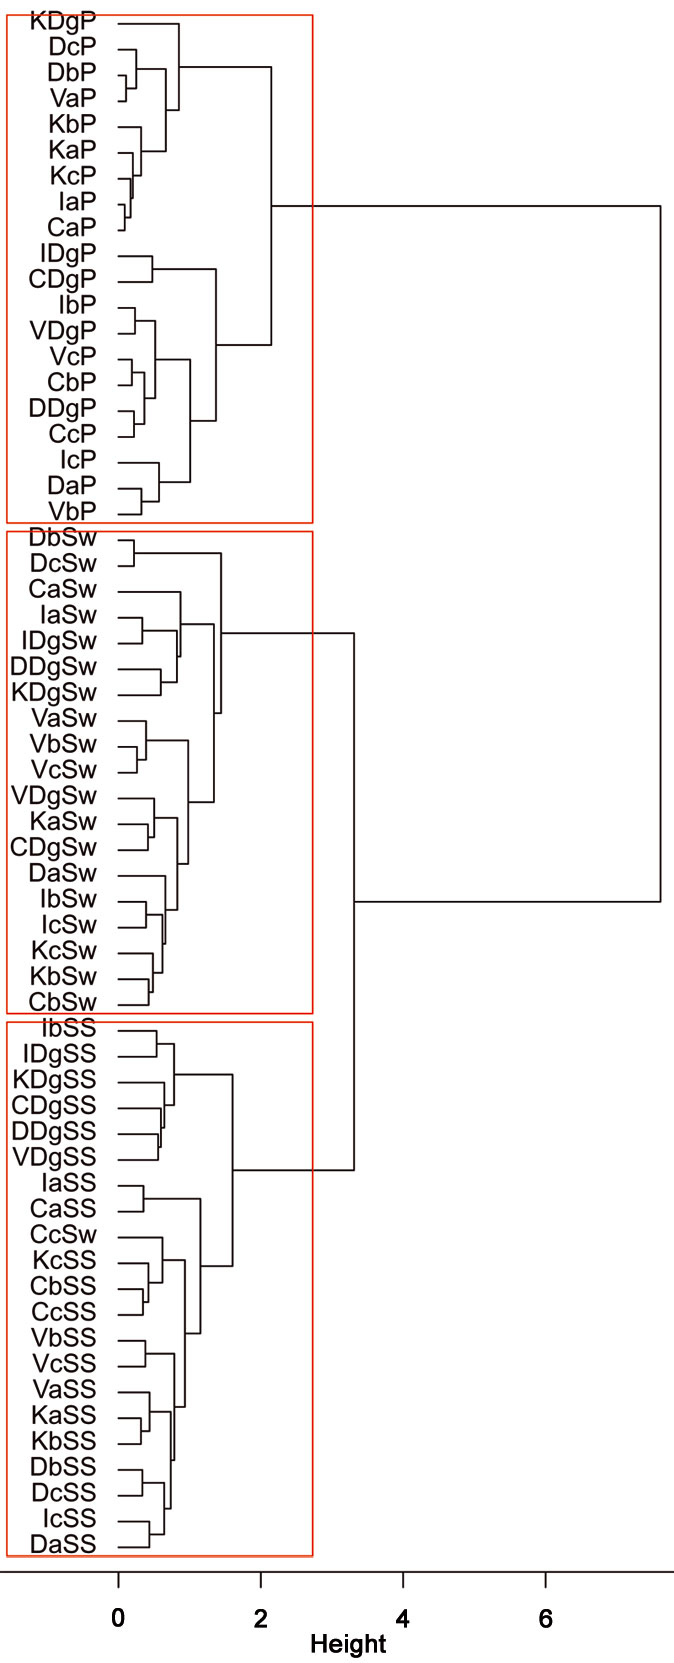
Fig. 9 - Results of the PC analysis of stand types (“a”: mean DBH 0-8 cm; “b”: 9-20 cm; “c”: 21-36 cm; “Dg”: degraded stands with canopy closure < 10%) based on the following variables: total number of RTU and total number of specimens across all trap types, number of RTUs and number of specimens within each trap type (pitfall trap, sweepnet, sticky trap and cloth shaking), H′, elevation, number of trees, DBH, height, crown diameter, number of snags, litter mass and understory mass.
Discussion
Arthropod richness, diversity and composition were influenced by climate and elevation in Thrace. Indeed, species richness, number of specimens and biodiversity increased with elevation and precipitation. The observed increase in diversity with elevation may be due, in part, to the local covariation of such factors, as reported for many temperate and arid habitats ([32]). Abundance of most arthropod taxa increased with elevation ([40]). Some insect species increased their frequency with elevation up to 600-800 m, and then decreased in southwestern USA ([26]). In tropical forest, insect species richness, number of individuals and diversity increased up to 1000 m, and then declined ([43]).
Our results did not confirm that arthropod richness and biodiversity were specifically affected by stand types in young and middle-aged forests, but arthropod diversity, richness and the number of specimens did increase slightly with DBH. In oak forest, herbivore species richness and density correlated positively with forest age ([14]). In this study, DBH, height and crown diameter did impact on biodiversity, although crown diameter had the least influence.
Some arthropods are often used as bioindicators ([17], [19], [25]). For example, Formicidae have been used as bioindicators of ecological degradation, concomitant with decreasing litter and canopy ([17]), such as in our study. Using more than one taxon as an indicator of environmental conditions or biodiversity can be problematic, since a taxonomic group may behave differently from other groups ([9]). However, several authors recommended the use of multiple taxonomic indicators as each species group is related with different habitat characteristics ([15]). Our results showed that the density of Formicidae, Thripidae, Lygaeidae, Dolichopodidae and Luaxanidae declined, while the density of Cicadellidae and Ichneumonidae increased with forest age. Dolek et al. ([7]) also found that Formicidae species decreased from pasture coppice oak to high forest in Germany. Although Araneae are often used as indicators ([29], [6]), we found their abundance only slightly increasing with age. Analogously, Barsoum et al. ([3]) found that Araneae and Carabidae diversity showed no differences between monoculture pine and monoculture oak stands, as well as Spitzer et al. ([35]), who investigated the effects of stand openness on carabids, arachnids and myriapods-isopods in lowland deciduous woodland. In a boreal forest context, Niemela et al. ([27]) found that populations of Araneae, Formicidae and Carabidae showed an increasing trend only after the first 20 years. Collembola have been reported as more abundant in coppices than in other forest types ([20]); however, their abundance was not clearly delineated among coppice oak stand types in our study.
Although Sessile oak, Hungarian oak, Turkey oak, Pedunculate oak and Aleppo oak are fairly common oak species in Thrace ([45], [23]), the latter two species were absent at our study sites. This could be due to the overall rarity of Aleppo oak on one side, and on the other side to the absence in the studied areas of floodplain forests, which have a high abundance of Pedunculate oak ([16]). Forest structure, tree species, climate, elevation and parent material influence understory and density of oak species ([46]). Litter increased with understory and stand age ([24]). Relationships between the arthropod community and understory in our study were inconclusive. Although the relationship between coarse woody debris and arthropod communities varies ([12], [41]), it is known that both woody debris and deadwood abundance can increase arthropod diversity ([38]). Coarse woody debris not only increases arthropod species numbers, but also functional diversity ([13]). The removal and addition of litter had no influence on arthropod diversity and taxonomic richness in lowland rainforests ([2]). In general, arthropod diversity increases with vegetation height, complexity ([22]) and plant species richness ([18], [37]).
Cluster analysis suggested that the RTUs composition of degraded forests differed from other stand types, except at Kirklareli, but young and middle-aged forests were not clearly separated by differences in arthropod taxonomy. In cluster analysis, trap types were separated from each other, except for the sweep net trap in the “c” stand type in Catalca (CcSw). Arthropod taxonomic composition was similar between canopy (sticky traps and cloth shaking) and sub-canopy (sweepnet) locations, because of their similar ecology, whereas composition of soil-dwelling arthropods (pitfalls) differed more than canopy and sub-canopy communities. A separation between stand types was demonstrated by PCA based on 19 different parameters, with degraded forest and young forests exhibiting similar characteristics. Effects of site history on insect communities may continue for more than 20 years post-harvest ([10]).
Conclusion
The results of the present study show that arthropod richness, diversity and composition in Thrace were not significantly distinguished in young and middle-aged forest stand types in coppice oak forests, although biodiversity, richness and number of specimens did slightly increase with DBH and tree height. As the coppice oak changes to mature forest, similar studies are needed to better assess the relation between arthropods and forest type and characteristics.
Several insect families could potentially be used as indicators for coppice oak conditions due to their decreasing (Formicidae, Thripidae, Lygaeidae, Dolichopodidae and Luaxanidae) or increasing (Cicadellidae and Ichneumonidae) abundance with forest age. However, in our study Araneae, which are often used as indicators, were not useful to this purpose. Arthropod taxonomic composition of degraded forests was clearly separated from the other stand types.
Acknowledgements
This study is part of the project “Determination of Health Condition, Biomass, Carbon Sequestration and Faunistic Characteristics on Conversion of Coppice Oak Ecosystems in Northern Thrace”, supported by the Scientific and Technological Research Council of Turkey (TUBITAK), Project no. TOVAG-107O750 (Coordinator: E. Makineci).
The Istanbul Regional Forestry Directorate for their assistance and support in the field is acknowledged. We thank Dr. George M. Merovich (Division of Forestry and Natural Resources, West Virginia University, USA) for advice on statistical analyses.
References
CrossRef | Gscholar
Gscholar
Gscholar
Gscholar
Gscholar
Gscholar
Authors’ Info
Authors’ Affiliation
Meric Kumbasli
Duzce University, Faculty of Forestry, Wildlife Ecology and Management, Duzce (Turkey)
Istanbul University, Faculty of Forestry, Forest Entomology and Protection Department, Istanbul (Turkey)
Istanbul University, Faculty of Forestry, Soil Science and Ecology Department, Istanbul (Turkey)
Duzce University, Faculty of Forestry, Department of Forest Management, Duzce (Turkey)
Ersel Yilmaz
Istanbul University, Faculty of Forestry, Forest Yield and Biometry Department, Istanbul (Turkey)
Istanbul University, Forestry Vocational High School, Ornamental Plants Growing Program, Istanbul (Turkey)
Istanbul University, Faculty of Forestry, Silviculture Department, Istanbul (Turkey)
West Virginia University, Division of Forestry and Natural Resources, Morgantown, West Virginia (USA)
Corresponding author
Paper Info
Citation
Keten A, Beskardes V, Kumbasli M, Makineci E, Zengin H, Özdemir E, Yilmaz E, Yilmaz HC, Caliskan S, Anderson JT (2014). Arthropod diversity in pure oak forests of coppice origin in northern Thrace (Turkey). iForest 8: 615-623. - doi: 10.3832/ifor1318-007
Academic Editor
Massimo Faccoli
Paper history
Received: Apr 20, 2014
Accepted: Aug 19, 2014
First online: Dec 17, 2014
Publication Date: Oct 01, 2015
Publication Time: 4.00 months
Copyright Information
© SISEF - The Italian Society of Silviculture and Forest Ecology 2014
Open Access
This article is distributed under the terms of the Creative Commons Attribution-Non Commercial 4.0 International (https://creativecommons.org/licenses/by-nc/4.0/), which permits unrestricted use, distribution, and reproduction in any medium, provided you give appropriate credit to the original author(s) and the source, provide a link to the Creative Commons license, and indicate if changes were made.

Web Metrics
Breakdown by View Type
Article Usage
Total Article Views: 54822
(from publication date up to now)
Breakdown by View Type
HTML Page Views: 45263
Abstract Page Views: 3130
PDF Downloads: 4719
Citation/Reference Downloads: 23
XML Downloads: 1687
Web Metrics
Days since publication: 4225
Overall contacts: 54822
Avg. contacts per week: 90.83
Article Citations
Article citations are based on data periodically collected from the Clarivate Web of Science web site
(last update: Mar 2025)
Total number of cites (since 2015): 8
Average cites per year: 0.73
Publication Metrics
by Dimensions ©
Articles citing this article
List of the papers citing this article based on CrossRef Cited-by.
Related Contents
iForest Similar Articles
Research Articles
Stand structure and regeneration of Cedrus libani (A. Rich) in Tannourine Cedar Forest Reserve (Lebanon) affected by cedar web-spinning sawfly (Cephalcia tannourinensis, Hymenoptera: Pamphiliidae).
vol. 11, pp. 300-307 (online: 13 April 2018)
Research Articles
Regional-scale stand density management diagrams for Pyrenean oak (Quercus pyrenaica Willd.) stands in north-west Spain
vol. 6, pp. 113-122 (online: 05 March 2013)
Research Articles
Assessment of hedge stand types as determinants of woody species richness in rural field margins
vol. 6, pp. 201-208 (online: 27 May 2013)
Research Articles
Developing stand transpiration model relating canopy conductance to stand sapwood area in a Korean pine plantation
vol. 14, pp. 186-194 (online: 14 April 2021)
Research Articles
Consistency among forest structure and biodiversity potential index (IBP): an assessment of stand structural complexity for floodplain poplar woodlands
vol. 18, pp. 335-343 (online: 04 November 2025)
Research Articles
Long-term dynamics of stand structure and regeneration in high-stocked selection fir-beech forest stand: Croatian Dinarides case study
vol. 14, pp. 383-392 (online: 24 August 2021)
Research Articles
Developing a stand-based growth and yield model for Thuya (Tetraclinis articulata (Vahl) Mast) in Tunisia
vol. 9, pp. 79-88 (online: 23 June 2015)
Research Articles
Determining basic forest stand characteristics using airborne laser scanning in mixed forest stands of Central Europe
vol. 11, pp. 181-188 (online: 19 February 2018)
Research Articles
Effects of silvicultural thinning on stand structure and coarse woody debris in the deciduous Arasbaran forest, Iran
vol. 16, pp. 377-384 (online: 19 December 2023)
Research Articles
Temperatures at the margins of a young spruce stand in relation to aboveground height
vol. 6, pp. 302-309 (online: 16 July 2013)
iForest Database Search
Search By Author
- A Keten
- V Beskardes
- M Kumbasli
- E Makineci
- H Zengin
- E Özdemir
- E Yilmaz
- HC Yilmaz
- S Caliskan
- JT Anderson
Search By Keyword
Google Scholar Search
Citing Articles
Search By Author
- A Keten
- V Beskardes
- M Kumbasli
- E Makineci
- H Zengin
- E Özdemir
- E Yilmaz
- HC Yilmaz
- S Caliskan
- JT Anderson
Search By Keywords
PubMed Search
Search By Author
- A Keten
- V Beskardes
- M Kumbasli
- E Makineci
- H Zengin
- E Özdemir
- E Yilmaz
- HC Yilmaz
- S Caliskan
- JT Anderson
Search By Keyword


