Growth patterns of Pinus sylvestris across Europe: a functional analysis using the HYDRALL model
iForest - Biogeosciences and Forestry, Volume 2, Issue 5, Pages 162-171 (2009)
doi: https://doi.org/10.3832/ifor0516-002
Published: Oct 15, 2009 - Copyright © 2009 SISEF
Research Articles
Abstract
The variability of Pinus sylvestris growth over two geographic transects across Europe has been explored through a process-based forest growth model (Hydrall: HYDRaulic constraints on ALLocation) which accounts for the effects of environmental conditions not only on short-term gas exchanges, but also on allocation and tree structure. The model has been validated against both eddy-covariance and growth data under contrasting environmental conditions. Forest growth was found to be reduced by low temperatures (-50%) and water stress (-37%) at the opposite extremes of the natural range of the species. Application of a functional model made it possible to partition growth reductions between individual processes. Gross primary production was severely affected by low temperatures and short vegetative periods at the northern extreme of the specific range (-53%), and by low air and soil humidity at the southern limit (-26%). The ratio between net and gross primary production was found to be rather constant across the temperate region, only increasing in the boreal zone in response to low temperatures (+20%). Under dry conditions, on the contrary, a substantial proportion of the reduction in aboveground productivity was attributed to the need to allocate increasing amounts of resources to fine root production and maintenance (+16%). Both short and long-term responses should be considered in the prediction of climate change impact on forests.
Keywords
Allocation, ANPP, Geographic variation, GPP, Precipitation, Scots pine, Temperature
Introduction
Forest growth is affected in a complex way by a variety of climatic factors, resulting for every species in large differences in productivity across its natural range. Moreover, the analysis of regional patterns of growth could prove a useful tool for the prediction of the future effects of climate change on forest productivity ([11]). In fact severe regional heat waves coupled with drought events, like that of summer 2003, have become more frequent in the last decade especially in central and eastern Europe ([77]). These disturbances affect forest productivity with tree damages, changes in litterfall and fine root growth rates, and more in general with changes in forests carbon pools with consequences beyond the duration of the extreme climate event ([20]). Under this climate change scenario a clear definition not only of what are the physical limiting factors on forest growth, but also of the mechanisms that are involved is central to our understanding of forest function.
Scots pine (Pinus sylvestris L.) is the most widely distributed conifer in the world ([10]), its range extending to large areas of Europe and Asia, covering a wide variety of environmental conditions within this natural range; this distribution reflects the large variability in productivity displayed by the species.
The species extends as far north as 70 °N on the Norwegian coast, reaching 37 °N at its southern limit in the Sierra Nevada of Spain; the longitudinal range covers most of Europe, spreading over Siberia as far as 138 °E. Although unevenly distributed, Scots pine stands contribute to a large proportion of European forests, comprising for example almost 65% of the total forest cover of Finland ([79]), about 20% of all high forests in the United Kingdom ([18]) and 9% of the forested area of France ([7]). Christie & Lines ([18]), in a comparison of growth and yield data from Scots pine forest around Europe, reviewed national maximum mean annual increments ranging from just above 2 to more than 18 m3 ha-1 yr-1. Since all these figures refer to optimal fertility conditions at national level, observed differences could be attributed to purely climatic factors. An interpretation of differences in growth, physiological responses and structural traits in terms of regional climate has been attempted by several studies, to identify the key limiting factors for Scots pine intraspecific climate-driven adjustments ([36], [57], [69]).
Key processes like transpiration, photosynthesis and respiration have been largely dissected, enabling to successfully predict the response of leaves to most environmental factors ([25], [46]). Moreover, simple schemes have been devised to up-scale leaf gas-exchanges to the stand and ecosystem level ([17], [21]), leading to the development of reliable models of canopy function.
The response to the environment of other processes such as carbon allocation is still poorly understood, although several approaches have been proposed ([15], [28], [35], [9], [48]). One of the hypothesis is that observed changes in growth allocation, both over the lifetime of the plant and in response to the environment, could be explained in coniferous species by a common framework, based on the observation of a functional homeostasis in water transport and on the assumption of optimal plant adaptation to a variable environment ([52], [53]). In a common garden trial of 19 European Scots pine provenances Oleksyn et al. ([65]) demonstrates a significant relationship between ANPP and the latitude and longitude of the site of origin, this is in agreement with the hypothesis that optimality in tree structure results from long-term adaptation to local climate, rather than short-term acclimation to instantaneous site conditions.
This hypothesis has been implemented in a detailed forest growth model, which represents the adjustment of both foliage function and tree structure to the environment. In the present work, the newly developed model will be used to try and explain in detail the geographic variability of Scots pine growth across Europe. The results will highlight the sensitivity of the species to key environmental parameters, laying the ground for the prediction of its response to future climate change.
Material and methods
The HYDRALL (HYDRaulic constraints on ALLocation) model the growth of a coniferous forest stand over a whole rotation. The model focuses on the key determinants of plant growth: light interception and gas exchanges, water relations and growth allocation. The main model outputs are produced by the model on a yearly time step: stand density and height, gross and net primary production (GPP and NPP), net ecosystem exchange (NEE), transpiration (E), total tree biomass and its distribution among plant organs: leaves, stem (including branches and coarse roots) and fine roots. A complete description of the HYDRALL model can be found in Magnani et al. ([54]). In comparison with other existing forest growth models, growth allocation among tree organs is not fixed, but responds dynamically to internal and external conditions. The representation of other processes is based on well established models; a brief description of the key model features follows.
Light absorption by the canopy
The representation of global radiation absorption by the sunlit and the shaded portion of a coniferous canopy is based on the two-leaf model of De Pury & Farquhar ([21]). The same approach is also used for the computation of foliage isothermal net radiation, a key variable in canopy transpiration. Light scattering and absorption in the visible, near-infrared and long-wave bands are modelled following Goudriaan & van Laar ([31]). An extinction coefficient of direct radiation for non-horizontal black leaves has been computed following Ross ([73]), assuming a spherical leaf angle distribution. Reflection coefficients for visible and near-infrared radiation are also computed following Goudriaan & van Laar ([31]), under the simplifying assumption of a common coefficient for the ground and the canopy, as could be expected if the soil is covered by a dense understorey.
Vertical functional gradients
Leaf photosynthetic parameters are integrated over sunlit and shaded foliage and adjusted as a function of absorbed photosynthetically active radiation (PPFD) and leaf temperature. The up-scaling of photosynthetic properties over the canopy is based on the approach of De Pury & Farquhar ([21]). A vertical exponential profile of leaf nitrogen content over the canopy is assumed, parallel to the reduction in diffuse PPFD, and both dark respiration and maximum carboxylation rates are assumed to be proportional to leaf nitrogen ([75], [47]).
Aerodynamic decoupling
Aerodynamic decoupling could have substantial effects on the gas-exchange of short, dense coniferous forests ([80]). Stand aerodynamic conductance is therefore computed iteratively in the model, following Monteith & Unsworth ([62]) and Garratt ([29]), as a function of wind speed and sensible heat flux from the canopy. Appropriate values of zero plane displacement and roughness length as a function of stand leaf area index and height have been derived from Shaw & Pereira ([80]). Near-field resistance to heat exchange is integrated over the whole canopy following the approach of Choudhury & Monteith ([17]).
Stand gas-exchange and respiration
The conductance and gas-exchanges of sunlit and shaded foliage are computed separately on a half-hourly basis. The representation of leaf assimilation is based on the Farquhar model ([25]). The response of leaf assimilation to PPFD follows Farquhar & Wong ([26]). The dependence of stomatal conductance upon assimilation and air vapour pressure deficit is captured by the Leuning ([46]) model, whilst a simple linear dependence of stomatal conductance upon soil water potential is assumed. Finally, following Landsberg & Waring ([44]), it is assumed that no gas-exchange takes place whenever minimum daily temperature falls below zero. Sapwood and fine root respiration are a function of average daily temperature, tissue biomass and nitrogen content, as suggested by Ryan ([74]). The empirical model presented by Lloyd & Taylor ([49]) is used to represent the dependence of tissue (and soil) respiration upon temperature, instead of the more common Q10 approach, to account for the often observed shift in Q10 with temperature ([82]). Growth respiration, finally, is assumed to be a constant fraction of available carbon ([81]).
Understorey gas-exchange and site water balance
The representation of transpiration and net carbon exchange from a generic understorey is based on the approach proposed by Dewar ([22]), who adapted and evaluated the RESCAP model (RESource CAPture - [61], [63]) for the evaluation of forest growth and forest transpiration.
According to this approach, gas exchanges are limited either by maximum potential photosynthesis, proportional to absorbed light, or by maximum potential transpiration, which is a function of soil water content. Water-use efficiency (WUE, carbon gain per water lost) is modulated by both air humidity and atmospheric CO2 concentration ([38]). The seasonal pattern of understorey foliage and root growth is derived from computed assimilation, assuming a constant ratio between net and gross primary production ([86]) and a constant coefficient of allocation to fine roots.
Canopy interception is assumed to be a fixed proportion of incoming precipitation, and superficial run-off takes place whenever the water content of the single-layer of soil exceeds soil porosity. Water drainage to a water table at a constant depth of 20 m is represented following Campbell ([13]). A rooting depth of 1 m and a soil sand fraction of 0.85 were assumed in all simulations.
Foliage water relations
Because of its effects on allocation and growth, the transport of water through the soil-plant continuum has been modelled in detail as described in Magnani et al. ([53]). Soil water potential and hydraulic resistance are a function of soil water content and texture and of fine root density ([13]). Root resistance is assumed to be inversely related to fine root biomass ([51]), whilst aboveground resistance is a simple function of sapwood basal area and tree height ([89]). Such a crude formulation has been shown to be appropriate in the case of P. sylvestris ([52]). Values of soil, root and sapwood hydraulic resistance are then adjusted for the effects of temperature ([53]).
Growth and mortality
An annual time step has been chosen in the representation of mortality and stand growth, a reasonable simplification in evergreen conifers. Growth allocation among foliage, sapwood and fine roots is driven by the assumption of optimal plant growth under hydraulic constraints ([52], [53]). Evolution is assumed to have resulted in an allocation strategy that maximizes plant fitness within the limits imposed by the species’ functional characteristics and by the environment. Height has been chosen as a fitness criterion to be maximized, because of its role in inter-individual competition and plant survival in closed canopies. Height increments are assumed to be proportional to the difference between foliage production and foliage turnover, as if new foliage, after replenishing the existing crown, formed a new layer over the top of the canopy with a fixed foliage density; the relationship was parameterized using data from Ovington ([66]).
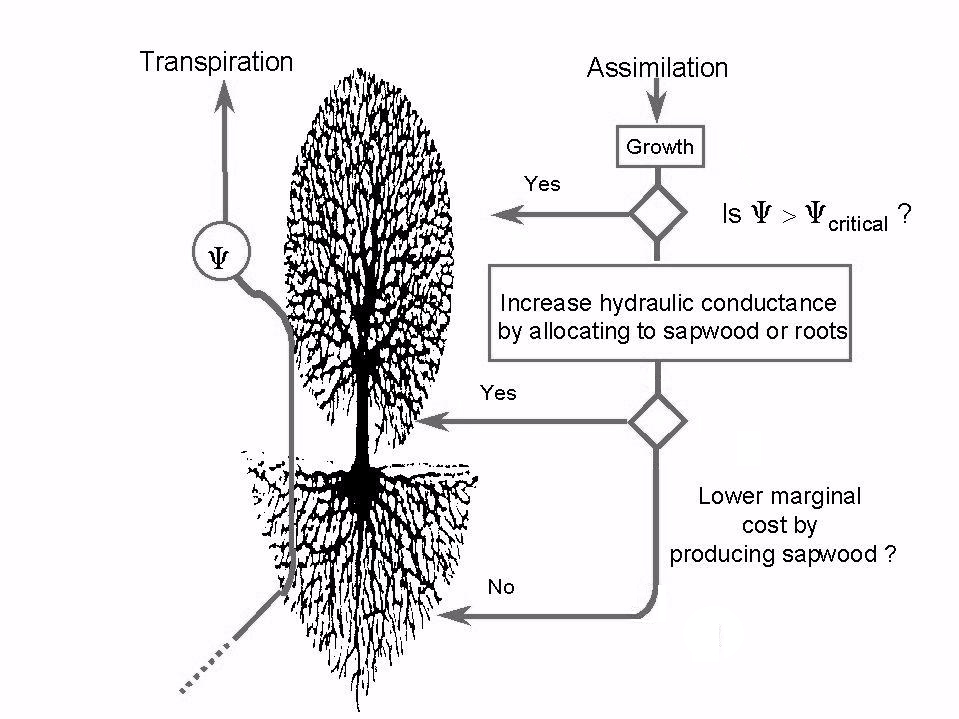
The constraints imposed by the environment on foliage production and height increments are depicted in Fig. 1. Were all resources to be allocated to foliage growth, this would result in extremely negative values of leaf water potential over the course of the year, threatening the survival of the plant ([83]). Minimum leaf water potential, on the contrary, has been found to be rather constant over a range of environmental conditions and developmental stages, as reviewed for P. sylvestris by Magnani ([50]). If this functional homeostasis is to be maintained, allocation has to favour transport tissues over foliage growth in ageing stands or under stress conditions, as often observed ([6], [59], [60]). Optimal height growth, moreover, requires that resources be allocated among transport tissues in an efficient way, in order to increase hydraulic conductance at the lowest possible carbon cost. This results in an age-independent ratio between sapwood area and fine root biomass ([52]). The balance, however, is strongly affected by environmental conditions, more carbon being allocated to feeder roots under stress conditions, in good agreement with experimental evidence ([76], [30]).
Fig. 1 - Flow diagram illustrating the criteria for growth allocation according to the hypothesis of functional homeostasis in water transport ([52], [53]). Allocation to foliage is maximized, as long as it does not induce leaf water potentials exceeding a safety range. Allocation between sapwood and fine roots, according to the principle of optimality, maximizes the return of new hydraulic conductance from carbon investment, so as to free more resources for foliage and height increments.
Finally, stand density is progressively reduced either by imposed thinnings or by distance-dependent mortality, represented by the self-thinning law ([87]). Both thinnings and mortality are assumed to reduce not only stand volume, but also foliage biomass and other living tissues to the same extent. A fixed proportion of tissue biomass is also lost every year through turnover ([81]).
Soil carbon dynamics
The two-compartment model of Andrén & Kätterer ([4]) has been chosen to represent soil respiration and the transition from young to old soil carbon pools. A constant humidification coefficient is assumed. Decomposition of young and old organic matter and humidification are affected to the same extent by soil temperature and soil water potential, as captured by the multiplicative model of Andrén & Paustian ([5]).
Weather simulation
The model relies for its input on monthly climatological data, as provided for the whole of Europe by the LINK data-set ([34]).
Air temperature is derived from daily maximum and minimum temperature as described by Goudriaan & van Laar ([31]). An average daily value of atmospheric transmissivity is obtained from relative heliophany, according to the Angstrom model ([55]). Based on this value, instantaneous global radiation and the fraction of diffuse radiation are then computed ([31]). Downward long-wave irradiance is derived from air temperature and atmospheric emissivity, which in turn is assumed to be under clear conditions a function of air vapour pressure and temperature, as predicted by the Brutsaert’s model ([43]). The effects of cloudiness on atmospheric emissivity are represented following Monteith & Unsworth ([62]).
Air vapour pressure is assumed to be constant over the day ([31]). Dew-point temperature is computed as described by Kimball et al. ([40]). Instantaneous vapour pressure deficit is then obtained as the difference from saturated air humidity, derived from Teten’s equation ([38]).
Model simulations
A summary of functional parameters for P. sylvestris applied in the model is reported in Box 1. These correspond to conditions of good nutrient availability, so as to be able to analyse the effects of climate alone. The model, in its present form, does not take into account site-specific differences in any functional parameters other than below-ground allocation. This assumption is supported by a previous study by Oleksyn et al. ([65]) in which the observed differences in leaf N concentration, a parameter of particular interest because of its relationship with photosynthetic potentials, amounted to no more than 15% over a latitudinal range of more than 20°, and opposite trends were observed in situ and in a common garden experiment. Moreover Poyatos et al. ([69]) demonstrate that, similar to hydraulic architecture, also stomatal conductance and its response to air and soil humidity change in Scots pine populations across Europe, but they attribute observed differences to acclimation rather than ecotype adaptation to site conditions.
Box 1 -
| Paramater | Definition | Units | Value | Source |
|---|---|---|---|---|
| a 1 | coeff. in gs vs. A equation | Pa-1 | 5.2 x 10⁵ | [39] |
| D 0 | coeff. in gs response to vapour pressure deficit | Pa | 1200 | [84] |
| g 0 | stomatal conductance to CO2 in darkness | mol m-2 s-1 | 2.3 x 10⁻³ | [39] |
| k fr | specific hydraulic conductance of fine roots | m3 s-1 MPa-1 kg-1 | 2.3 x 10⁻⁷ | [71], [72], [52] |
| k s | specific hydraulic conductivity of sapwood | m2 MPa-1 s-1 | 1.3 x 10⁻³ | [59] |
| l r | fine root longevity | Yr | 0.65 | [68] |
| l s | sapwood longevity | Yr | 39 | [33] |
| N f | nitrogen concentration in foliage | kg N kg-1 | 0.015 | [59] |
| N r | nitrogen concentration in fine roots | kg N kg-1 | 0.0075 | [33] |
| N s | nitrogen concentration in sapwood | kg N kg-1 | 0.0005 | [27] |
| r g | growth respiration coefficient | - | 0.28 | [19] |
| Vcmax | maximum carboxylation rate | mol m-2 s-1 | 50 x 10-6 | [39] |
| α | photosynthetic quantum efficiency | mol e- quantum-1 | 0.28 | [85] |
| ρ f | foliage density in the canopy (height vs. foliage growth relationship) | kg m-3 | 0.73 | [66] |
| Ψ | critical leaf water potential | MPa | -1.4 | [52] |
| Ψ0 | soil Ψ for maximum stomatal closure | MPa | -1.0 | [37] |
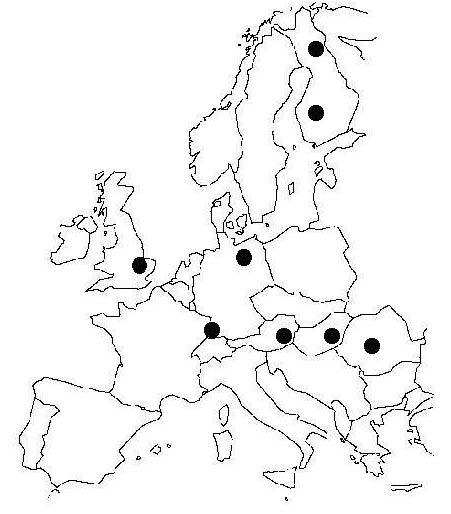
Once tested against both growth and functional data, the model has been applied to simulate Scots pine growth along two regional transects across Europe (Fig. 2 and Tab. 1). The transects explore a latitudinal gradient from Northern Finland to Southern Germany and a longitudinal one from the maritime climate of England to the more dry and continental climate of Rumania, at the south-eastern limit of the species range.
Fig. 2 - Location of sites considered in the simulation. The range of sites encompasses a latitudinal transect from Northern Finland to Southern Germany, as well as a longitudinal transect from South-east England to Rumania.
Tab. 1 - Location of sites considered in the simulation and key climatic characteristics: average annual temperature, July temperature, annual precipitation (P) and the ratio between potential evapotranspiration (PET) and precipitation. Potential evapotranspiration is based on the Priestley and Taylor model ([70]), assuming an average net longwave irradiance of 60 W m-2.
| Site | Latitude | Longitude | Annual T (°C) |
July T (°C) |
P (mm yr-1) |
PET / P |
|---|---|---|---|---|---|---|
| N Finland | 67° 15’ | 29° 15’ | - 1.9 | 10.0 | 524 | 0.45 |
| S Finland | 62° 15’ | 24° 15’ | 3.2 | 14.1 | 503 | 0.69 |
| N Germany | 53° 15’ | 13° 15’ | 8.6 | 16.0 | 535 | 1.16 |
| E England | 52° 15’ | 0° 45’ | 9.1 | 14.0 | 564 | 0.94 |
| S Germany | 47° 15’ | 7° 15’ | 10.4 | 17.6 | 963 | 0.74 |
| Austria | 47° 15’ | 15° 15’ | 9.0 | 17.4 | 715 | 1.04 |
| Hungary | 47° 15’ | 21° 15’ | 10.3 | 18.7 | 481 | 1.83 |
| Rumania | 46° 15’ | 24° 15’ | 9.5 | 18.0 | 476 | 1.72 |
In contrast with site-specific model validation, no differences in soil texture and depth were considered in regional simulations, since soil characteristics vary on a much finer scale than climate and no clear patterns are apparent at the continental level.
A list of the sites and of their key climatic characteristics is reported in Tab. 1. At all sites, climatic characteristics correspond to the lowest elevation in the LINK data-base ([34]). A very high initial stocking density of 5 x 10⁴ trees ha-1, as would be expected in a naturally regenerating stand ([66]), and no artificial thinning was assumed throughout, so as to neglect any national differences in management regimes.
Temperature and water availability are among the main limiting factors for plant growth on a regional scale. The sensitivity of model predictions to a temperature change of ± 2 °C and to a ± 10 % shift in precipitation has been therefore analysed in detail, taking the climate of south-east England as a reference, so as to be able to interpret the pattern observed along the European transects.
Model results
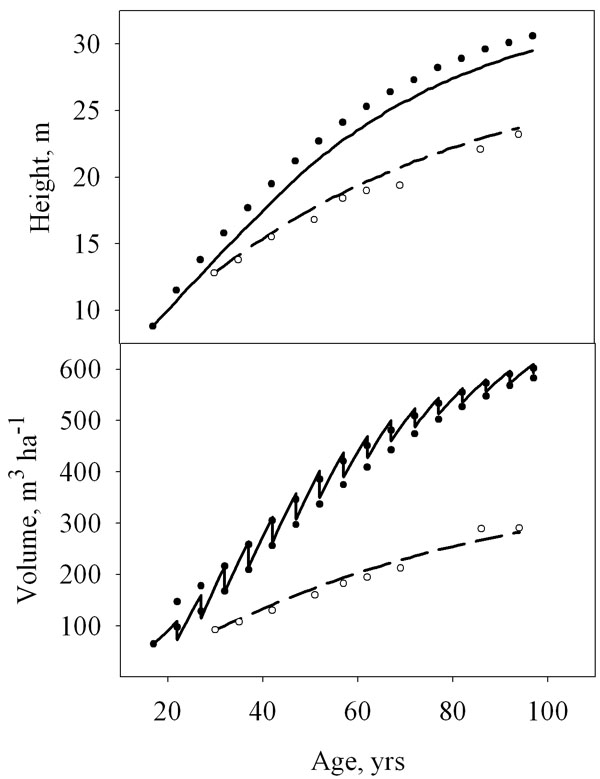
Model results for two locations in south-east England and Central Finland, respectively, are reported in Fig. 3 and compared with predictions from local Growth & Yield tables ([23]) and permanent sample plots (Sievanen, unpublished data). The systematic error in height predictions at the British site is partly explained by the fact that average stand height, as predicted by the model, is compared with tabulated values of top height.
Fig. 3 - Test of model predictions. The development of mean height and stand volume predicted by the model for Southeast England (thick line) and Central Finland (thin line) are compared with figures from British Growth & Yield tables (black circles, [23], YC 14, intermediate thinning) and from Finnish permanent sample plots (white circles, R. Sievanen, unpublished data). Prescribed thinnings were applied in the simulation for SE England, whilst self-thinning only was assumed for the Finnish stand.
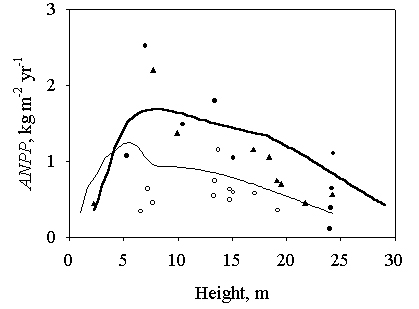
Additional support for the model comes from a comparison (Fig. 4) with literature data of annual aboveground net primary production (ANPP) from a Scots pine chronosequence in Thetford Forest (Sussex, UK - [66], [58]) and from a number of sites around Jädraås (Sweden - [3]). Both the age-related decline in productivity and the marked differences in ANPP between the two locations are well captured by the model.
Fig. 4 - Test of model predictions. The development of stand above-ground net primary production (ANPP) predicted by the model for south-east England (thick line) and central Sweden (thin line) are compared with experimental data from a Scots pine chronosequence in Thetford Forest, UK (black circles, [66]; black triangles, [58]) and from a series of sites around Jädraås, Sweden (white circles, [3]).
An analysis of model sensitivity demonstrates (Tab. 2) that both height and total volume are negatively affected by a temperature change in either direction, but for different reasons: warming, on the one hand, would beneficially affect canopy photosynthesis, but because of the direct effect on respiration a slight reduction in net primary production would be expected. Moreover, allocation to fine roots is predicted to increase under warmer conditions as a result of higher transpiration rates, leading to an overall reduction in aboveground increments. Colder conditions, on the other hand, would mainly result in lower gross primary production, whilst only marginal changes in respiration and carbon allocation are predicted. Starting from the relatively mild British conditions, precipitation changes are predicted to have a relatively minor effect on growth, mainly the result of a shift in the allocation pattern.
Tab. 2 - Sensitivity of selected growth variables to key environmental factors. Percentage changes in stand height (H) and total volume at 100 years (Vtot), average gross (GPP) and net primary production (NPP) and fraction allocated to fine root production (λr) as a result of imposed changes in air temperature and precipitation. Sensitivity is defined as S = (O1 - O0) / O0 where O0 and O1 are model output under reference and changed conditions.
| Parameter | Change | H (%) |
Vtot (%) |
GPP (%) |
NPP (%) |
λr (%) |
|---|---|---|---|---|---|---|
| Temperature | + 2 °C | - 5.2 | - 6.7 | 3.2 | - 1.5 | 7.6 |
| - 2 °C | - 8.6 | - 21.4 | - 22.7 | - 19.0 | - 0.4 | |
| Precipitation | + 10 % | 1.0 | 1.5 | - 0.4 | - 0.6 | - 3.1 |
| - 10 % | - 2.4 | - 2.4 | 0.6 | 1.1 | 4.6 |
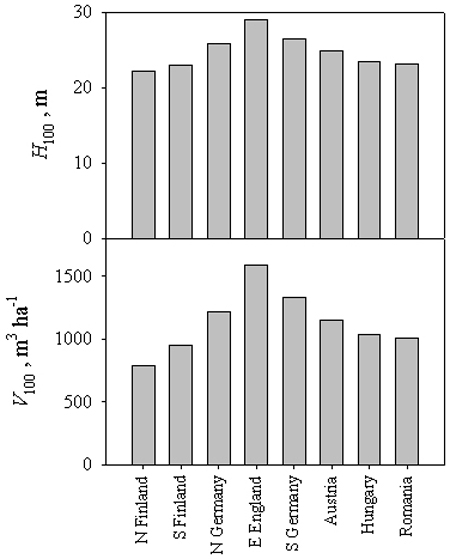
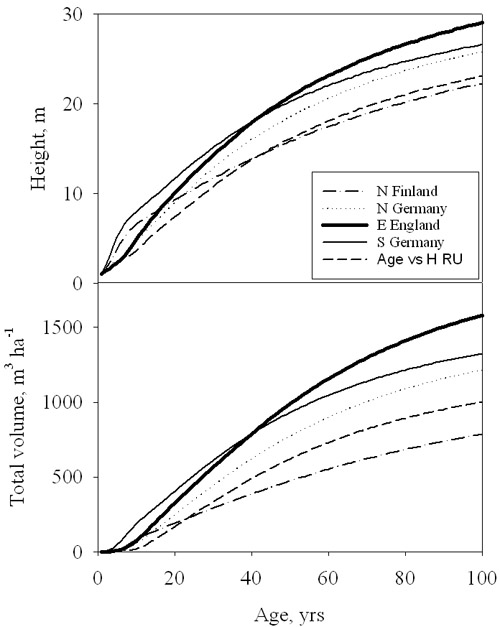
When values of stand height and total (standing plus self-thinned) volume after 100 years are compared across Europe, a rather clear picture emerges (Fig. 5), with a marked decline in final height and even more in total volume moving northwards and eastwards. The lowest volume increments are predicted at the northern limit of the range (50 % of the maximum, corresponding to south-east England), while modelled values for Rumanian stands at the south-eastern extreme are still 63 % of the maximum. Differences between sites are not limited to final values but involve the dynamics of height and volume growth (Fig. 6).
Fig. 5 - Simulated height (H100) and total volume at age 100 (V100) for a range of sites along two latitudinal and longitudinal transects across Europe.
Fig. 6 - Simulated development of stand height and total volume for a range of sites across Europe. Results are reported for Southeast England (continuous thick), Northern Finland (dash-dot), Northern Germany (dotted), Southern Germany (continuous thin) and Rumania (dashed line).
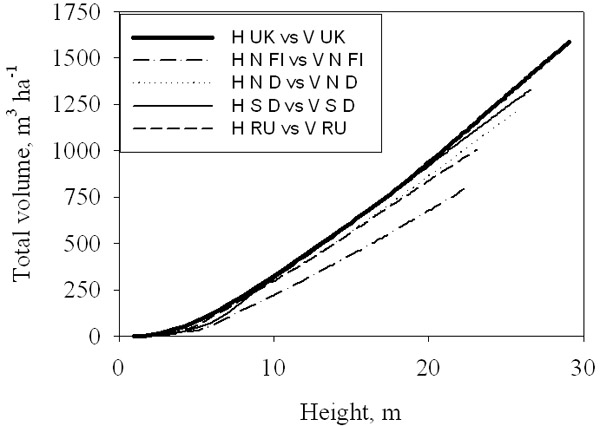
The relationship between height and total volume increments is known to be rather constant at any particular site ([24]), but quite variable at the regional scale ([18]). This variability is captured by the model, as shown in Fig. 7: the slope of the relationship is highest at the most productive sites, since total volume production is more strongly reduced than height under limiting environmental conditions (Fig. 5).
Fig. 7 - Simulated total volume production-height curves for a range of sites across Europe. See Fig. 6 for legends.
Stand aboveground net primary production (and stand current annual increment, which is closely related to ANPP) is the result of three processes, acting in series: stand gross primary production (GPP) is reduced by respiration to net primary production (NPP) which is allocated above- and below-ground. In mathematical terms (eqn. 1):
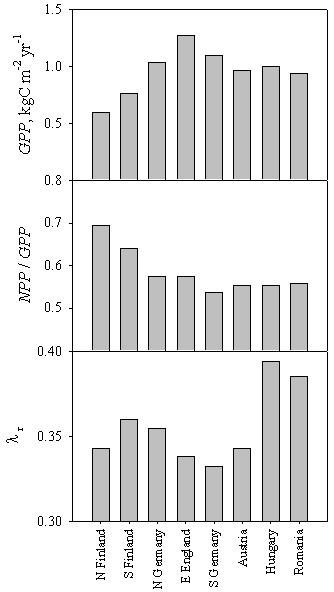
where λr represents the fraction of NPP allocated below-ground. When the relative contribution of the three terms is compared across Europe, the functional determinants of growth differences can be better understood. When figures are normalized to optimum values (Fig. 8), it can be seen that at the northern limit of the range the reduction in gross primary production (-53 %) exceeds the corresponding value for growth (-50 %; Fig. 5), as low temperatures also reduce the proportion of available carbon that is lost through respiration. The opposite is true at the dry limit of the range, where a 26 % reduction in GPP translates in a 36 % decline in growth rates. In this case the discrepancy is the result not of respiration differences, but of greater below-ground allocation (+13 %).
Fig. 8 - Simulated determinants of stand growth for a range of sites along two latitudinal and longitudinal transects across Europe. Mean values over 100 years of stand gross primary production (GPP), the ratio between net- and gross primary production (NPP / GPP) and the fraction of growth allocated to fine root production (λr) are reported.
Discussion
Several components of the model have already been independently tested, lending credibility to model results ([54]). Annual dynamics of gas exchange have been successfully compared with eddy-covariance data from three pine forests across Europe ([42]). The response of resource allocation and growth to age and the environment has also been tested against field and literature data ([52], 2002). An additional confirmation of the predictive ability of the model comes from the comparison with P. sylvestris growth dynamics at contrasting sites (Fig. 3 and Fig. 4). The sites differ considerably in latitude, climate and applied management regimes; the good agreement between modelled and measured data should be therefore viewed as a confirmation of the precision and generality of the model.
Scots pine seems to find near-optimal conditions in the English climate ([18]). It is therefore not surprising that, according to the sensitivity analysis reported in Tab. 2, growth would be reduced both by an increase and by a decrease in temperature, although by different mechanisms. Cold temperatures would mainly impair photosynthesis and net carbon exchange, in particular cold soil temperatures can affect the transpiration deficit during spring with negative effects on forest productivity ([56]). On the other hand, a climate warming would result in higher vapour pressure deficits inducing higher transpiration rates. In these warmer climate conditions, a decrease in soil water availability could affect forest productivity with a shift in carbon allocation resulting in a decrease of green parts, and at the same time in a greater allocation to below-ground fractions ([45]). This apparent sensitivity to water stress is confirmed by the response to changes in precipitation (Tab. 2) and is consistent with the conclusions by White ([88]) that variations in P. sylvestris productivity in Great Britain are associated primarily with changes in solar radiation and soil water balance. Moreover, in recent studies Briceno-Elizondo et al. ([12]) have modelled the effect of solar radiation availability on southern and northern Finland Scots pine stands under climate change scenario; under thinning, the climate change condition increased the growth of Scots pine up to 28% in the south and up to 54% in the north.
The predicted response to temperature, on the contrary, contradicts the suggestion by Cannell et al. ([16]) that a 3 °C warming could result in a growth increase as high as 54% under British conditions. This prediction, however, was derived from an analysis of growth sensitivity to temperature under boreal conditions and the authors warned that the response to temperature could flatten off at a July temperature of 15 °C. Our results suggest that the relationship could be even reversed considering an increase in warming conditions.
A key role of low temperatures at the boreal limit (as well as at the altitudinal - [32]) and of water availability in the southern part of the range ([64]) is confirmed by our regional analysis. The sites considered encompass much of the natural range of the species in western Europe ([10]), covering a wide interval of latitude, temperature and water availability (Tab. 1). Simulation results are in good agreement with the conclusions of Ineson et al. ([36]), who studied the productivity of Scots pine across Europe. From a re-analysis of a data-set of 18 P. sylvestris stands throughout Europe ([14]) by principal component analysis (PCA), they found that almost 50% of the variability in productivity was explained by the first eigenvalue, related to temperature, whilst an additional 26% was associated to the second PCA axis, related to precipitation. Once referenced to the climate of Europe, their results show a good agreement with the pattern resulting from the present paper.
The results are only partly confirmed, on the contrary, by the review of P. sylvestris growth and yield tables across Europe presented by Christie & Lines ([18]): height increments are quite similar across most of the temperate zone, but markedly lower in the boreal zone. Even greater differences are observed when volume increments are considered. On the other hand, the growth decline at southern and eastern locations predicted by the model is not apparent in growth and yield tables. This probably stems from the fact that simulations always refer to lowland sites, whilst P. sylvestris in these regions is more commonly found (and generally planted) at higher elevations and under moister conditions.
The use of a functional model makes it possible not only to predict, but also to understand the mechanisms behind such changes in forest productivity. Contrasting processes seem to be involved in the response of forest growth to limiting conditions under different climates (Fig. 8). Gross primary production is reduced below its maximum value, corresponding to the British site, because of low temperatures and a short vegetative period, on the one hand, and of low air and soil humidity (as captured by the increasing PET / P values in Tab. 1) on the other. The ratio between net and gross net primary production, in turn, is quite constant across all of the temperate region and only increases in the boreal zone, reflecting the pattern of annual mean temperature. Under dry conditions, on the contrary, aboveground productivity is most seriously hampered by the need to allocate increasing amounts of resources to fine root production and maintenance.
The potential relevance of tree structural acclimation for forest growth under dry conditions has already been stressed by [8], who considered in their simulations only potential changes in foliage-to-sapwood area ratio. In analogy with Hydrall predictions, they suggested that a strong reduction in volume increments at the southern limit can only be explained by climate-induced changes in tree functional structure. An additional increase in carbon allocation below-ground, as predicted by the HYDRALL model, could have even more important effects, because of the fast turnover rate of fine roots ([78], [41]).
Such changes in allocation, however, although of utmost importance under dry conditions, have only a minor and not so clear effect when other climates are considered. This explains why they have been generally neglected in forest growth models, traditionally applied to boreal or temperate moist conditions ([1], [2]). Explicit consideration of structural acclimation, on the other hand, appears to extend the generality of the Hydrall model to a wider range of environments.
These general considerations can be probably extended to other forest tree species. The pattern of forest productivity predicted by the Hydrall model is consistent with the results for Europe of the empirical model of Paterson ([67]), who correlated maximum forest productivity for a large number of species with summary climatic statistics. This seems to suggest that, irrespective of the species considered, the same basic processes are at work in determining the response to climate of forest ecosystems.
Acknowledgements
The work was supported by the EU LTEEF-2 Project (Long-Term Regional Effects of Climate Change on European Forests: Impact Assessment and Consequences for Carbon Budgets) and by the Italian COFIN Projects: Impact of Climate Change on Forests and Wood Production (1998-2000) and Carbon balance and carbon stocks in forest ecosystems: physiological determinants, age-related effects and environmental constraints (2000-2002). We gratefully thank the Climate Impacts LINK Project, UK Department of the Environment, Transport and the Regions (Contract Reference EPG 1/1/68) for producing the gridded climatology for Europe and Dr. R. Sievanen, Finnish Forest Research Institute, for providing the permanent plot data from the Vilppula site.
References
Gscholar
Gscholar
Gscholar
Gscholar
Gscholar
Gscholar
Gscholar
CrossRef | Gscholar
Gscholar
Gscholar
Gscholar
Gscholar
Gscholar
Gscholar
Gscholar
Gscholar
Gscholar
Gscholar
Gscholar
Gscholar
Gscholar
Gscholar
Gscholar
Authors’ Info
Authors’ Affiliation
Department of Plant Cultivation, University of Bologna (Italy)
Francesco Ripullone
Department of Crop System, Forestry and Environmental Sciences, University of Basilicata (Italy)
IERM, University of Edinburgh, Scotland (United Kingdom)
Corresponding author
Paper Info
Citation
Magnani F, Nolè A, Ripullone F, Grace J (2009). Growth patterns of Pinus sylvestris across Europe: a functional analysis using the HYDRALL model. iForest 2: 162-171. - doi: 10.3832/ifor0516-002
Academic Editor
Roberto Tognetti
Paper history
Received: Aug 07, 2008
Accepted: Oct 06, 2009
First online: Oct 15, 2009
Publication Date: Oct 15, 2009
Publication Time: 0.30 months
Copyright Information
© SISEF - The Italian Society of Silviculture and Forest Ecology 2009
Open Access
This article is distributed under the terms of the Creative Commons Attribution-Non Commercial 4.0 International (https://creativecommons.org/licenses/by-nc/4.0/), which permits unrestricted use, distribution, and reproduction in any medium, provided you give appropriate credit to the original author(s) and the source, provide a link to the Creative Commons license, and indicate if changes were made.
Web Metrics
Breakdown by View Type
Article Usage
Total Article Views: 62145
(from publication date up to now)
Breakdown by View Type
HTML Page Views: 52988
Abstract Page Views: 3483
PDF Downloads: 4651
Citation/Reference Downloads: 47
XML Downloads: 976
Web Metrics
Days since publication: 5963
Overall contacts: 62145
Avg. contacts per week: 72.95
Article Citations
Article citations are based on data periodically collected from the Clarivate Web of Science web site
(last update: Mar 2025)
Total number of cites (since 2009): 5
Average cites per year: 0.29
Publication Metrics
by Dimensions ©
Articles citing this article
List of the papers citing this article based on CrossRef Cited-by.
Related Contents
iForest Similar Articles
Research Articles
Impact of climate change on radial growth of Siberian spruce and Scots pine in North-western Russia
vol. 1, pp. 13-21 (online: 28 February 2008)
Research Articles
Scots pine’s capacity to adapt to climate change in hemi-boreal forests in relation to dominating tree increment and site condition
vol. 14, pp. 473-482 (online: 18 October 2021)
Research Articles
Impact of climate change on tree-ring growth of Scots pine, common beech and pedunculate oak in northeastern Germany
vol. 9, pp. 1-11 (online: 13 October 2015)
Research Articles
Growth patterns of Scots pine (Pinus sylvestris L.) under the current regional pollution load in Lithuania
vol. 8, pp. 509-516 (online: 12 November 2014)
Research Articles
Potential impacts of regional climate change on site productivity of Larix olgensis plantations in northeast China
vol. 8, pp. 642-651 (online: 02 March 2015)
Research Articles
Influence of climate on tree health evaluated by defoliation in the ICP level I network (Romania)
vol. 10, pp. 554-560 (online: 05 May 2017)
Research Articles
Is Pinus pinea growth affected by climate change in western Anatolia?
vol. 18, pp. 93-101 (online: 28 April 2025)
Research Articles
Growing season water balance of an inner alpine Scots pine (Pinus sylvestris L.) forest
vol. 11, pp. 469-475 (online: 02 July 2018)
Research Articles
Coping with spring frost-effects on polyamine metabolism of Scots pine seedlings
vol. 10, pp. 227-236 (online: 27 January 2017)
Research Articles
The growth dynamics of East European Scots pine (Pinus sylvestris L.) populations - a Lithuanian field trial
vol. 17, pp. 59-68 (online: 06 March 2024)
iForest Database Search
Search By Author
Search By Keyword
Google Scholar Search
Citing Articles
Search By Author
Search By Keywords
PubMed Search
Search By Author
Search By Keyword

