Fuel moisture sampling and modeling in Pinus elliottii Engelm. plantations based on weather conditions in Paraná - Brazil
iForest - Biogeosciences and Forestry, Volume 2, Issue 3, Pages 99-103 (2009)
doi: https://doi.org/10.3832/ifor0489-002
Published: Jun 10, 2009 - Copyright © 2009 SISEF
Research Articles
Abstract
Fuel moisture content is essential to estimate several fire behavior variables. The objective of the present study was to estimate fuel moisture through meteorological variables. The field materials used for this purpose were the accumulated needles found on the ground of a Pinus elliottii Engelm. plantation of the Federal University of Paraná Experimental Station, located in Rio Negro county, Paraná State, southern Brazil (26º04’S lat., 49º45’W long.). To determine fuel moisture content, two sampling methods were tested: the first method consisted in collecting samples of fuel in plastic baskets and subsequently weighing them approximately every two hours, while the second method consisted in collecting, approximately every two hours, a series of different samples directly from the forest floor, and weighing them. All the samples collected on site were then oven dried for moisture determination. Comparing both methods, it was found that the best results were obtained using the samples collected directly from the forest floor and that the best fitting equation included air temperature and wind speed.
Keywords
Introduction
According to Alves et al. ([2]), Brazil currently has about 5.2 million hectares of forest plantations, consisting mainly of Pinus and Eucalyptus. Forests planted with Eucalyptus spp. represent about 65.4% of the Brazilian plantations, 31.2% of which are located in the state of Minas Gerais, while Pinus spp. plantations represent about 34.6% and the state of Paraná, with 37% of the total, is the highest-ranking in Brazil. The increasing expansion of reforestation programs, mainly located in the south of the country, has determined the need for the improvement of assessment and protection techniques. Forest fires are a constant concern and their management represents one of the main goals of forest plantation management plans.
Climate directly influences the type and quantity of vegetation and weather conditions determine the levels of humidity present in the air and, consequently, the levels of humidity in the fuel.
Moisture is present in a higher amount in live material and is more stable in comparison to the moisture content in dead material. The latter, being dryer, responds faster to weather variations, and therefore is considered to be the main culprit for the spread of fires. In fact, moisture content of deadwood can vary widely and ranges from less than 2% (rarely) to more than 300%. On the other hand, moisture content of live material is less variable. Indeed, in green leaves, branches and shrubs up to 7 cm in diameter, which usually burn in medium or high intensity fires, moisture content generally ranges from 75 to 150% of its dry weight ([3], [25]).
The probability of ignition is directly related to two basic meteorological parameters: temperature and humidity. The behavior of forest fires is closely related to fuel moisture ([7]). Therefore, its determination is basic for the estimation of parameters such as linear intensity, rate of spread and fire propagation, which are related to the behavior of fires. Fuel moisture, not only is a critical factor to obtain good results with prescribed burnings, but also is one of the most important factors in the assessment of forest fires risk in all biomes and ecoregions ([15], [28], [7]).
Fuel moisture content is also the most important parameter for determining fuel flammability and is directly influenced by climate and weather conditions, and may vary rapidly. Living and dead fuels have different mechanisms of water retention and different responses to weather changes ([10], [25]).
In the last decade the goal of many research groups throughout the world (e.g., [23], [9], [4], [6] and [17]) has been the development of methodologies and mathematical functions aimed to quantitatively predict values for the variables related to fire propagation, to achieve a better understanding of the behavior of fires.
So far in Brazil, fuel moisture estimation has been made through direct measurements in the field and in the laboratory. The method consists in weighing the fuel on site (determination of wet weight) and subsequently drying it to its constant weight, consequently determining its water content.
The development of indirect methods to provide estimates of fuel moisture through easy-to-obtain correlated variables, is a faster and more promising way ([5]). The development of such methods for the determination of fuel moisture could in fact speed up the work for the protection of forest stands.
To develop equations to quantify variables related to fire propagation, parameters such as the rate of spread, the intensity of heat emitted by the fire front and the geometric properties of the fire front (height, length and angle of inclination) are used. Fuel moisture, in this context, is of great importance as it exerts a strong influence on these variables. Satellite remote sensing has also emerged as an advanced technique to provide frequent and high-resolution measurements of forest fuel types and wildfire properties. Recently, great efforts have been made to develop algorithms to estimate fuel moisture using this technology ([11], [12], [1], [27]).
The goal of the present work was to test methods, based on meteorological variables, to determine fuel moisture by calculating the degree of correlation between meteorological elements and fuel moisture and by testing the mathematical models describing such relationships.
Materials and methods
Location
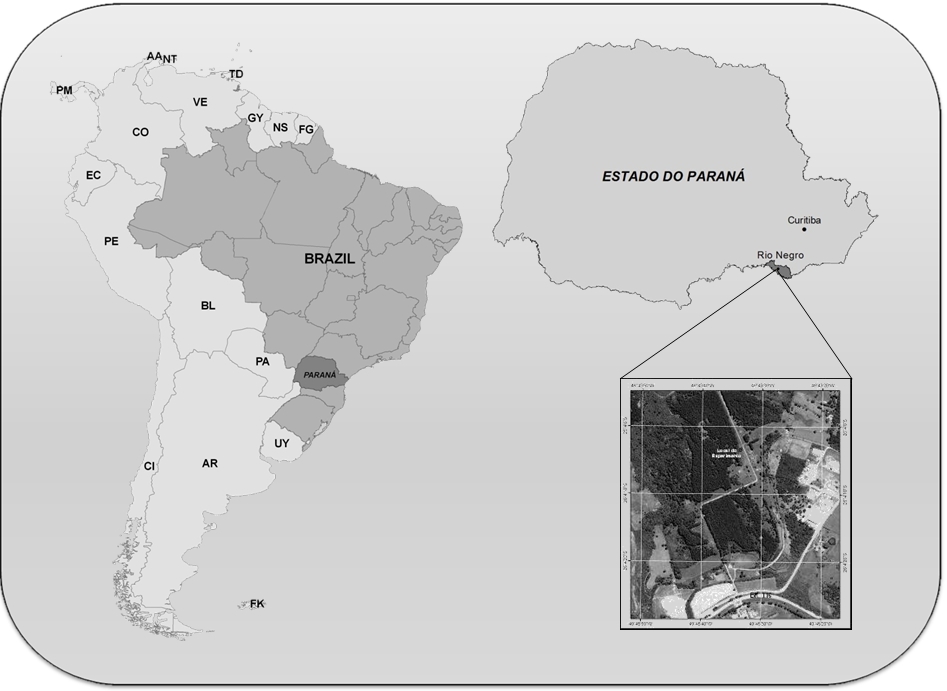
The city of Rio Negro is located in the Second Paranaense Plateau, in the southeastern state of Paraná, about 120 km from the coast, at an average elevation of 793 meters a.s.l. Samples were collected in the Experimental Station of Rio Negro, administered by the Forest Engineering Course of the Federal University of Paranà (UFPR), located near highway BR-116 (km 200), District of Tijuco Preto, approximately 100 km from Curitiba (coordinates: 26° 04’ 02.40” S, 49° 45’ 58.76” W).
The Experimental Station is an area of approximately 120 ha, created in 1962 to support teaching and research activities carried out at the National School of Forestry. Currently about 50% of the area is covered with forest plantations, 30% with secondary forests voted to permanent preservation and the remaining 20% used for annual crops and pastures (Fig. 1).
Climate
According to the Köppen climate classification, the climate of the region is Cfb, mesothermal, characterized by the absence of a dry season and by warm summers with four or more months where the average temperature is above 10°C. It is a humid climate with rainfall of the driest month exceeding 60 mm. Summer and winter seasons are well defined, with the average temperature of the hottest month being less than 22° C ([20], [18], [22]).
According to official information provided by the Agronomic Institute of Paraná (IAPAR), the region of the study area has registered in the last 20 years an average annual temperature of 17 oC, with the coldest month averaging a temperature of 12.6o C, the hottest month a temperature of 20.8 oC and 1585 mm of average annual precipitation.
Meteorological data
Brown & Davis ([8]) consider that the main climatic variables influencing fuel moisture are rainfall, relative humidity and temperature. Wind and solar radiation are important factors in the drying process because they modify both the fuel temperature and relative humidity, as well as the temperature in the first layer of air adjacent to the fuel. Meteorological data were obtained using a mini station Brand Kestrel® model 3000, with temperature accuracy of ±0.1 °C and a measurement range of -20 °C to +60 °C, according to manufacturer’s information. The values of relative humidity have an accuracy of ±3%, and may be calibrated on the field. The above equipment was installed in a beacon, at a height of 1.50 m.
Sampling and statistical analysis
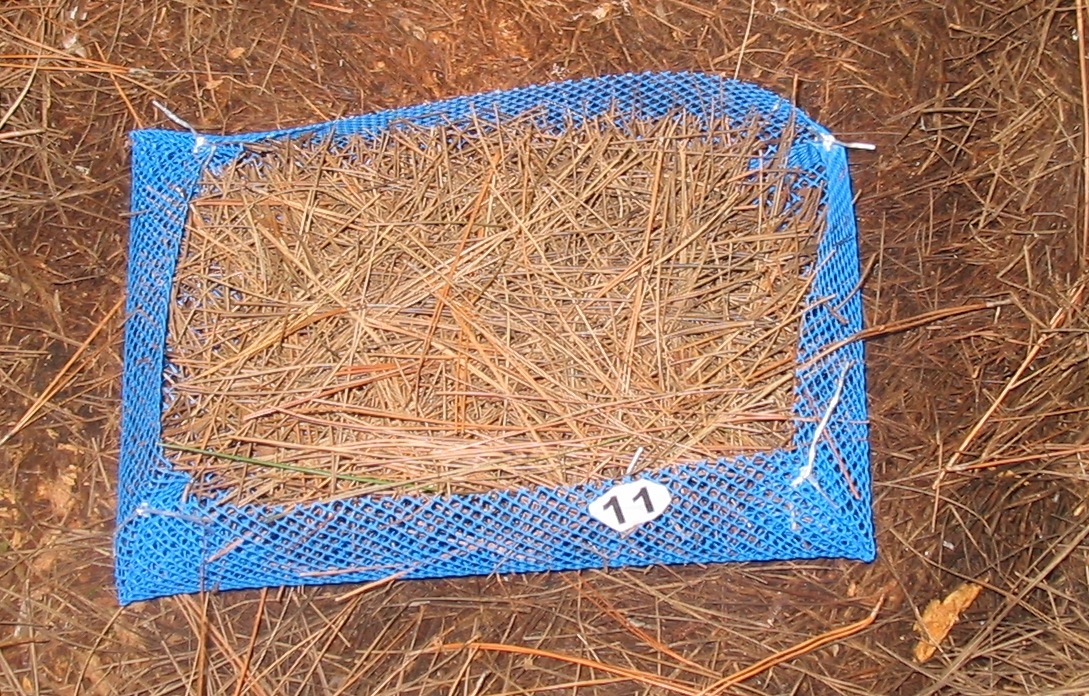
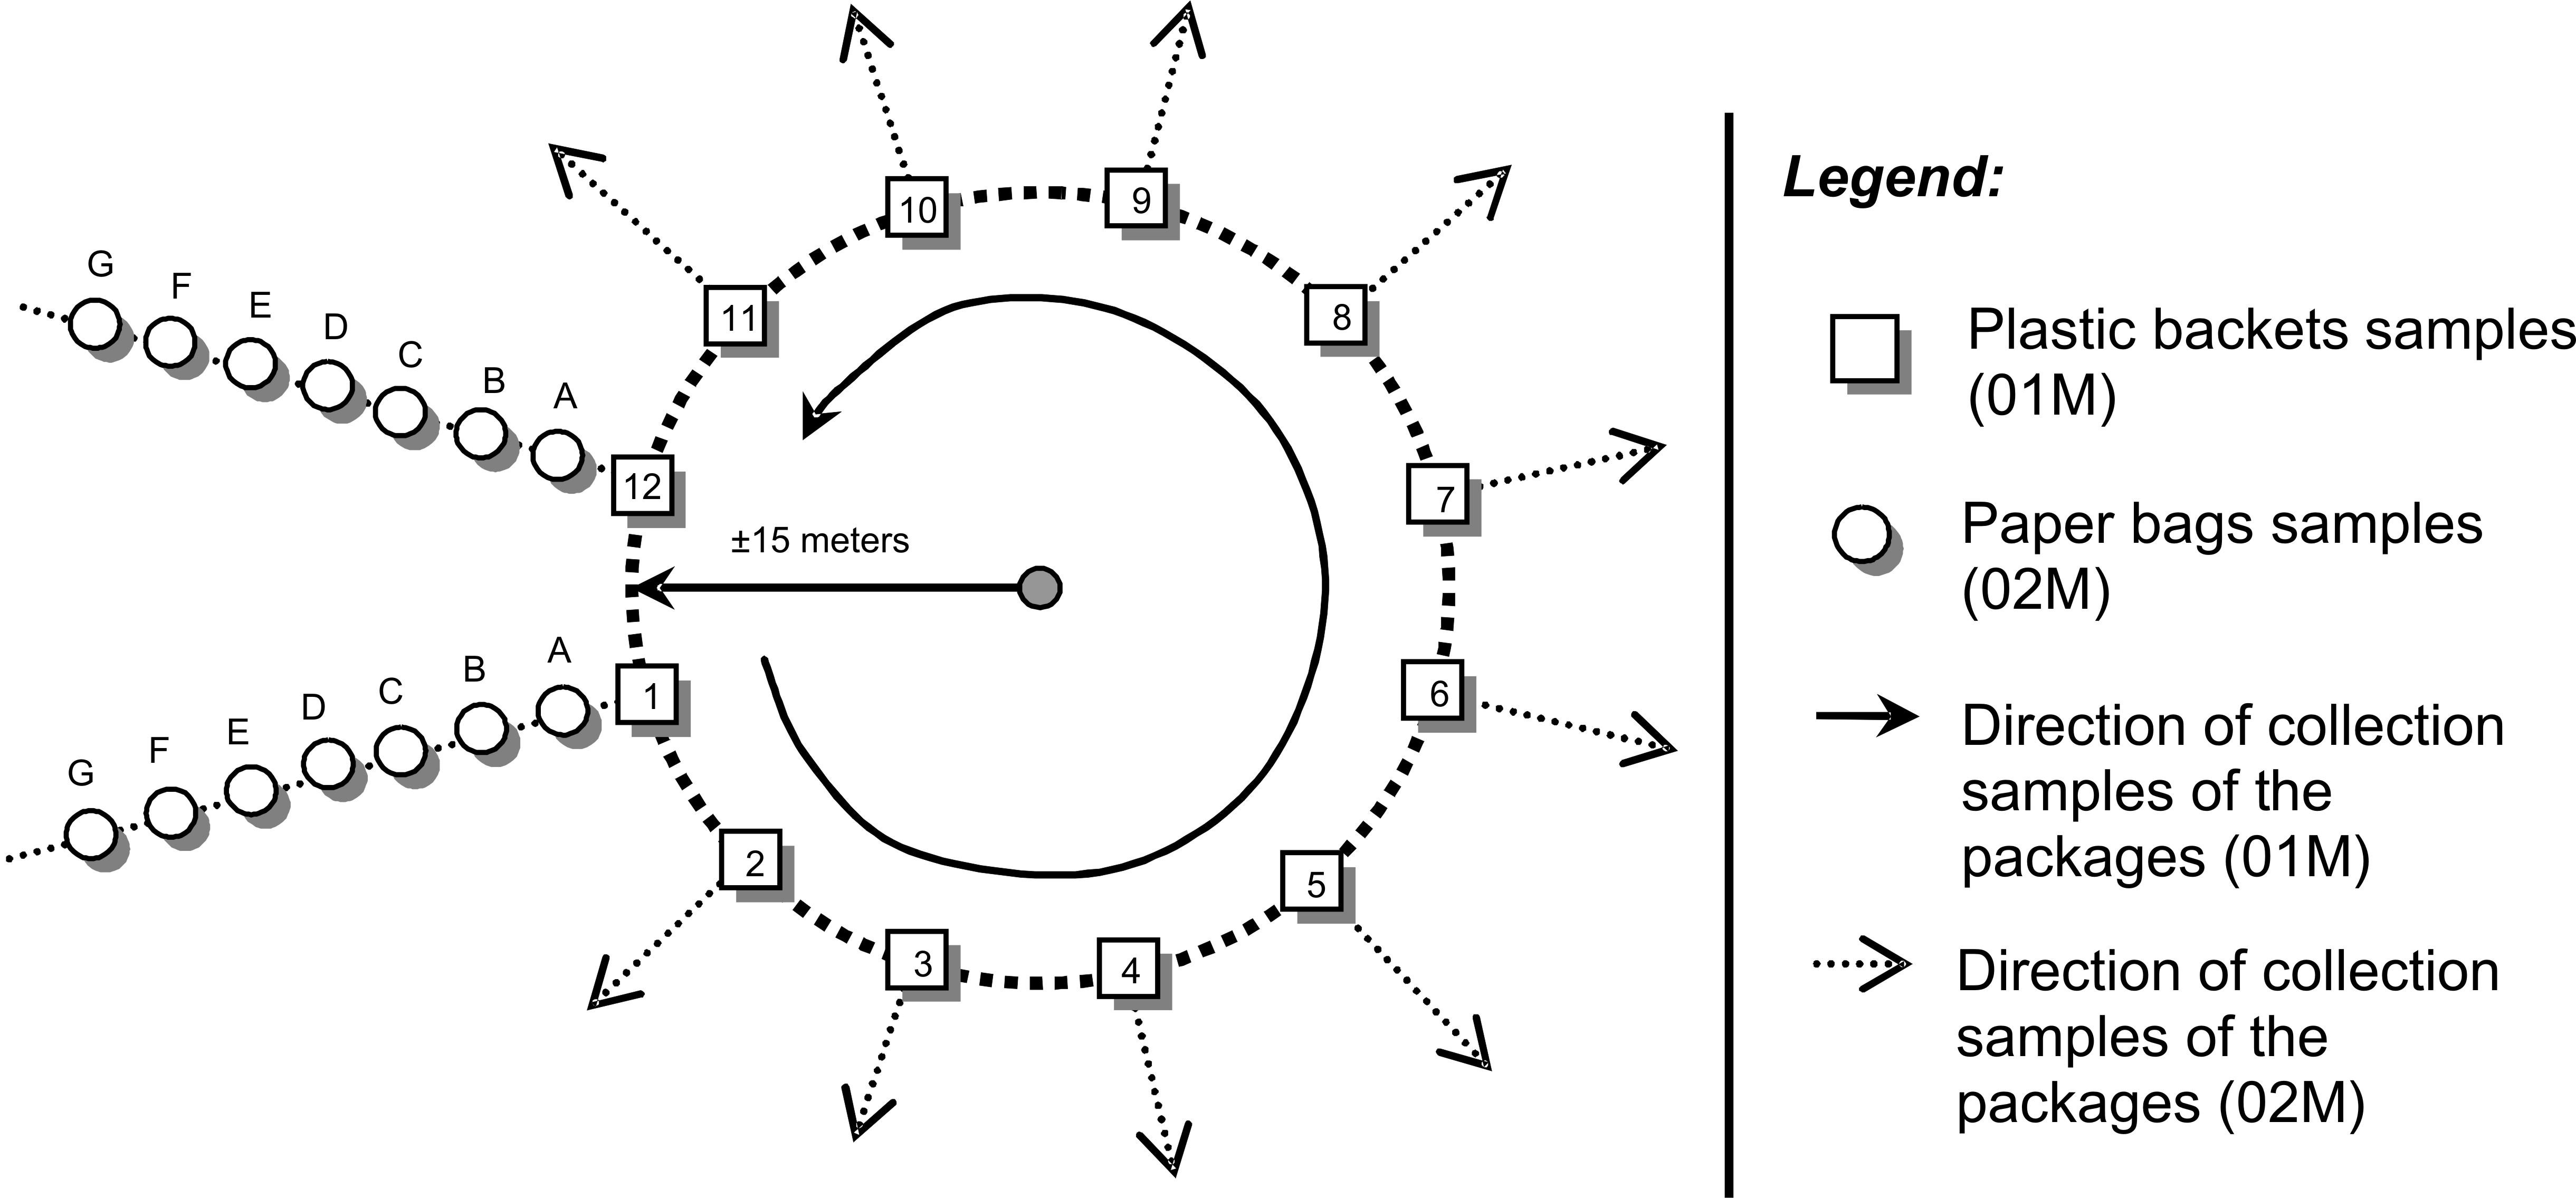
To determine fuel moisture two distinct sampling methodologies were used. In the first method (01M) samples consist solely of surface fuel, which plays a critical role in the ignition and spread of fires ([21]). Samples were collected in plastic baskets carefully avoiding any alterations in the structure of the fuel material, and left on the same place. Plastic baskets were made of screens (mesh of ±7 mm), 25x40 cm in size and about 10 cm high (Fig. 2). After putting them in baskets (Fig. 3), fuel samples were weighed on site two hours later, and weighing repeated on the same samples approximately every two hours. This series of measurements was performed from the 28/03/2007 at 15h30 to the 30/03/2007 at 08h00, resulting in 20 periods measured with 240 observations.
Fig. 2 - Comparison between variables trend during observations in the two different methodologies (A and C refer to the first method: 01M; B and D to the second: 02M).
The second method (02M) consist in collecting needle samples (surface fuel) directly from the forest floor at intervals of approximately two hours (Fig. 3). The material collected was packaged in labeled paper bags and weighed (determination of the wet weight). The samples were then transported to the Forest Fire Laboratory at UFPR and dried in an oven at 75 °C for 48 hours, to determine their dry weight. The same procedure was performed on the samples collected in baskets: each sample (01M) was packaged in labeled paper bags, and the same procedure for the determination of the dry weight was followed.
Lopes et al. ([19]), in stands of Pinus pinaster and Eucalyptus globulus used sample sizes of about 50 grams. Gonçalves et al. ([16]), with the same species, used sample sizes of 30 grams. However, due to the scarce variability of the moisture content over the analyzed periods, using small sample sizes can generate greater error because small variations in fuel moisture cannot be detected. Therefore, for both the above methods samples of 200 grams were taken.
Fuel moisture content (FMC) was determined from the difference between the wet weight (Mf, measured in the field) and the dry weight (Mo, obtained in laboratory), as follows ([13], [26] - eqn. 1):
Before adjusting the equation, a normality test was conducted on the variables. Saglam et al. ([24]), in a similar study on Pinus brutia and Pinus nigra, applied a logarithmic transformation of the fuel moisture data, while in the present study data showed a homoscedastic normal distribution, and no transformation was necessary.
To model the relationship between the meteorological variables and fuel moisture, several different approaches and equations have been tested (eqn. 2 to eqn. 10):
where FMC is the fuel moisture contents, T is the air temperature (°C), RH is the air relative humidity (%), W is the wind speed (m s-1), Ln is the natural logarithm, and b0, b1, b2 and b3 are the regression coefficients to be estimated.
Results and discussion
The starting dataset included 240 observations obtained using the first method (plastic baskets) and 84 observations using the second (samples independently collected). During the period of collection, the wind speed ranged from 0.0 to 0.6 m s-1, the relative humidity from 49 to 98%, the temperature from 19.1 to 29.7ºC and the fuel moisture content between 6.18 and 37.02% (Tab. 1).
Tab. 1 - Weather parameters and fuel moisture contents. (1): monitoring of the same sample wrapped in a plastic basket (method 01M); (2) collection of new samples of material to each interval of time (method 02M); (SD): standard deviation; (SE): standard error.
| Statitcs | Wind speed (m.s-1) |
Relativy umidity (%) |
Temperature (ºC) |
Fuel moisture contents (%) |
||||
|---|---|---|---|---|---|---|---|---|
| 01M(1) | 02M(2) | 01M(1) | 02M(2) | 01M(1) | 02M(2) | 01M(1) | 02M(2) | |
| No. of samples | 240 | 84 | 240 | 84 | 240 | 84 | 240 | 84 |
| Minimum | 0.0 | 0.0 | 49.0 | 45.0 | 19.1 | 19.7 | 6.18 | 11.8 |
| Maximum | 0.6 | 0.4 | 98.0 | 97.0 | 29.7 | 30.1 | 37.02 | 37.6 |
| Mean | 0.1 | 0.1 | 77.2 | 75.6 | 23.3 | 24.6 | 22.21 | 24.4 |
| SD | 0.14 | 0.14 | 22.21 | 18.62 | 3.48 | 3.67 | 6.41 | 5.03 |
| SE | 0.01 | 0.01 | 1.43 | 2.03 | 0.22 | 0.40 | 0.41 | 0.55 |
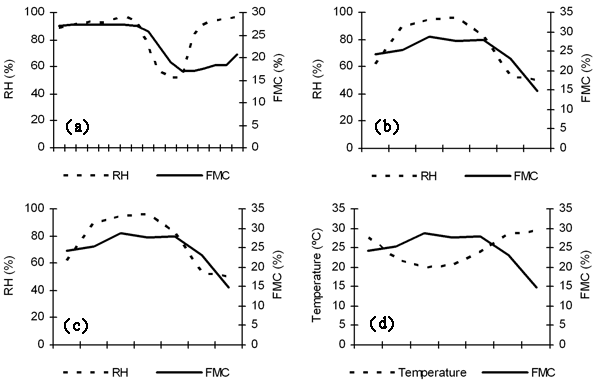
Fig. 4 displays how relative humidity (RH), air temperature and fuel moisture content of the collected samples (FMC) varied during sampling operations applying both methodologies described above. Graph A represents the first sampling method (01M) and graph B the second method (02M).
Graph B demonstrates that 02M presents a better relationship between the variables analyzed, whereas a remarkable divergence is noticeable at the end of the analysis using the method 01M (Fig. 4A). The above trend is confirmed by the correlation coefficients analysis reported in Tab. 2. On the other hand, a better correlation between weather variables and FMC was found using method 01M in respect to method 02M (Fig. 4C and Fig. 4D, respectively).
Fig. 4 - Comparison between variables trend during observations in the two different memethodologies(A and C refer to the first method: 01M; B and D to the second: 02M).
Tab. 2 - Correlation coefficients between weather conditions parameters and fuel moisture content during sampling procedures. T: temperature (°C); RH: relative humidity (%); W: wind speed (m s-1); FMC: fuel moisture contents (%).
| 01M | 02M | ||||||||
|---|---|---|---|---|---|---|---|---|---|
| Parameter | T | RH | W | FMC | Parameter | T | RH | W | FMC |
| T | 1.000 | -- | -- | -- | T | 1.000 | -- | -- | -- |
| RH | -0.965 | 1.00 | -- | -- | RH | -0.988 | 1.000 | -- | -- |
| W | 0.562 | -0.508 | 1.00 | -- | W | 0.884 | -0.924 | 1.000 | -- |
| FMC | -0.452 | 0.398 | 0.03 | 1.00 | FMC | -0.791 | 0.809 | -0.698 | 1 |
The strength of the relationships between the different variables analyzed is reported in Tab. 2. In general, a significant correlation between FMC and other weather parameters was found. The highest correlation between FMC and air temperature was obtained with the method 01M (-0.452), while the best correlation between FMC and RH was obtained using method 02M (0.809). It is interesting to note that the correlation between FMC and air temperature obtained in this experiment is similar to the one obtained by Saglam et al. ([24]), in a study conducted in Turkey (r = - 0.738).
The regression models tested for the prediction of fuel moisture content based on weather conditions parameters are reported in Tab. 3. Based on both the coefficient of determination and the standard error of the estimates obtained from the regression analysis, the adoption of the sampling method 02M produced a best fit, providing therefore better predictions of the FMC.
Tab. 3 - Regression models used for the prediction of the fuel moisture content based on weather conditions. (1): coefficient of determination; (2) standard error of the estimate (%).
| Method | Nº | Regression models | Regression coefficients | r2 (1) | Syx%(2) | |||
|---|---|---|---|---|---|---|---|---|
| b0 | b1 | b2 | b3 | |||||
| 01M | 1 | LnFMC = b0 + b1· T | 1.7250 | -0.0155 | - | - | 0.36 | 16.6 |
| 2 | LnFMC = b0 + b1·RH | 1.1365 | 0.0027 | - | - | 0.26 | 16.8 | |
| 3 | FMC = b0 + b1·T | 42.512 | -0.8146 | - | - | 0.38 | 15.5 | |
| 4 | FMC = b0 + b1·RH | 11.550 | 0.1466 | - | - | 0.28 | 16.8 | |
| 5 | FMC = b0 + b1·W | 23.989 | -5.5710 | - | - | 0.01 | 19.7 | |
| 6 | FMC = b0 + b1·T + b2·RH | 94.239 | -2.0678 | -0.2748 | - | 0.45 | 15.2 | |
| 7 | FMC = b0 + b1·T + b2·W | 46.642 | -1.0491 | 27.357 | - | 0.47 | 14.9 | |
| 8 | FMC = b0 + b1·RH + b2·W | 8.2624 | 0.1761 | 18.014 | - | 0.32 | 17.0 | |
| 9 | FMC = b0 + b1·T + b2·RH + b3·W | 108.33 | -2.5637 | -0.3245 | 31.421 | 0.56 | 14.1 | |
| 02M | 1 | LnFMC = b0 + b1·T | 1.8458 | -0.0189 | - | - | 0.56 | 15.3 |
| 2 | LnFMC = b0 + b1·RH | 1.0907 | 0.0038 | - | - | 0.58 | 15.1 | |
| 3 | FMC = b0 + b1·T | 47.943 | -0.9555 | - | - | 0.62 | 13.2 | |
| 4 | FMC = b0 + b1·RH | 9.9502 | 0.1921 | - | - | 0.64 | 12.7 | |
| 5 | FMC = b0 + b1·W | 27.166 | -40.465 | - | - | 0.38 | 16.8 | |
| 6 | FMC = b0 + b1·T + b2·RH | -1.9338 | 0.3023 | 0.2510 | - | 0.64 | 14.2 | |
| 7 | FMC = b0 + b1·T + b2·W | 1.5883 | 0.0902 | -20.046 | - | 0.86 | 8.74 | |
| 8 | FMC = b0 + b1·RH + b2·W | -5.0587 | 0.3492 | 46.928 | - | 0.72 | 12.5 | |
| 9 | FMC = b0 + b1·T + b2·RH + b3·W | -68611 | 1.5139 | 0.6868 | 59.582 | 0.75 | 13.6 | |
For both sampling methods, the best fitting was observed applying regression models including temperature and wind speed as predictors (FMC = b0 + b1·T + b2·W), with an R² of 0.47 and 0.86 and standard errors of 14.9 and 8.74% for the first and the second method, respectively (Tab. 3).
Dimitrakopoulos et al. ([14]), in a study on Mediterranean forests carried out in Greece, developed a model based on regression analysis to describe the relationship between ignition time and moisture content. The simple linear regression model provided the best fitting, with coefficients of determinations ranging between 0.70 and 0.97.
Conclusions
In this study, it was observed that method 01M, which uses the same fuel samples packaged in plastic baskets to determine moisture content at regular time intervals (through the differences in their weight), was not efficient to determine the relationship between FMC and weather condition parameters. This is probably due to the procedure, which can generate great changes in the original arrangement of the sampling materials. Moreover, the weighting process requires the continuous manipulation of the samples, contributing to a faster loss of their moisture content and reducing the response time for moisture absorption. The adoption of this method, therefore, makes predictions of FMC based on weather conditions parameters unreliable.
Based on the results obtained in this study, the second methodology (independent samples collected at pre-determined intervals of time) has to be preferred for the proposed goals, showing better results for assessing the actual fuel moisture content. Moreover, a stronger relationship was found between weather condition parameters and FMC estimated by method 02M. Therefore, the use of meteorological parameters for the prediction of FMC (which is one of the most important factors related to fire propagation) could greatly improve fire risk assessment, as well as the work of the technicians responsible for fire fighting in the area.
The present study was carried out over only one season (end of summer) with high fire severity regime. In order to improve our understanding of the behavior of FMC as a function of the meteorological variables, further studies covering the whole year are needed, with the aim of developing a reliable set of predictors and indicators useful in fire risk assessment and control.
Acknowledgements
This project was made possible, in part, through the collaboration efforts of the Foundation for Forestry Research in Parana (FUPEF) and supported by the Programme Alβan, the European Union Programme of High Level Scholarships for Latin America, scholarship n. E07D402548BR.
References
Gscholar
Gscholar
Gscholar
Gscholar
Gscholar
Gscholar
Gscholar
Gscholar
Gscholar
Gscholar
Gscholar
Gscholar
Gscholar
Gscholar
Gscholar
Gscholar
Gscholar
Gscholar
Gscholar
Gscholar
Gscholar
Gscholar
Authors’ Info
Authors’ Affiliation
M Ottaviano
M Marchetti
Università degli Studi del Molise, Contrada Fonte Lappone snc, I-86090 Pesche, IS (Italy)
RV Soares
Universidade Federal do Paraná, Av. Pref. Lothário Meissner, CEP 80210-170 Curitiba, PR (Brazil)
Corresponding author
Paper Info
Citation
Alves MVG, Batista AC, Soares RV, Ottaviano M, Marchetti M (2009). Fuel moisture sampling and modeling in Pinus elliottii Engelm. plantations based on weather conditions in Paraná - Brazil. iForest 2: 99-103. - doi: 10.3832/ifor0489-002
Academic Editor
Agostino Ferrara
Paper history
Received: Aug 07, 2008
Accepted: Jan 20, 2009
First online: Jun 10, 2009
Publication Date: Jun 10, 2009
Publication Time: 4.70 months
Copyright Information
© SISEF - The Italian Society of Silviculture and Forest Ecology 2009
Open Access
This article is distributed under the terms of the Creative Commons Attribution-Non Commercial 4.0 International (https://creativecommons.org/licenses/by-nc/4.0/), which permits unrestricted use, distribution, and reproduction in any medium, provided you give appropriate credit to the original author(s) and the source, provide a link to the Creative Commons license, and indicate if changes were made.
Web Metrics
Breakdown by View Type
Article Usage
Total Article Views: 49486
(from publication date up to now)
Breakdown by View Type
HTML Page Views: 40711
Abstract Page Views: 3612
PDF Downloads: 4147
Citation/Reference Downloads: 112
XML Downloads: 904
Web Metrics
Days since publication: 6064
Overall contacts: 49486
Avg. contacts per week: 57.12
Article Citations
Article citations are based on data periodically collected from the Clarivate Web of Science web site
(last update: Mar 2025)
Total number of cites (since 2009): 15
Average cites per year: 0.88
Publication Metrics
by Dimensions ©
Articles citing this article
List of the papers citing this article based on CrossRef Cited-by.
Related Contents
iForest Similar Articles
Short Communications
Upscaling the estimation of surface-fire rate of spread in maritime pine (Pinus pinaster Ait.) forest
vol. 7, pp. 123-125 (online: 13 January 2014)
Research Articles
Post-fire recovery of the plant community in Pinus brutia forests: active vs. indirect restoration techniques after salvage logging
vol. 11, pp. 635-642 (online: 04 October 2018)
Review Papers
Should the silviculture of Aleppo pine (Pinus halepensis Mill.) stands in northern Africa be oriented towards wood or seed and cone production? Diagnosis and current potentiality
vol. 12, pp. 297-305 (online: 27 May 2019)
Research Articles
Forest fire occurrence modeling in Southwest Turkey using MaxEnt machine learning technique
vol. 17, pp. 10-18 (online: 02 February 2024)
Research Articles
Wood production and nutritional status of Pinus taeda L. in response to fertilization and liming: a meta-analysis of the Americas
vol. 16, pp. 195-201 (online: 25 July 2023)
Research Articles
Modeling human-caused forest fire ignition for assessing forest fire danger in Austria
vol. 6, pp. 315-325 (online: 16 July 2013)
Research Articles
Contrasted growth response of hybrid larch (Larix × marschlinsii), jack pine (Pinus banksiana) and white spruce (Picea glauca) to wood ash application in northwestern Quebec, Canada
vol. 14, pp. 155-165 (online: 06 April 2021)
Research Articles
Assessing the performance of fire danger indexes in a Mediterranean area
vol. 11, pp. 563-571 (online: 01 September 2018)
Research Articles
The economic value of fire damages in Tuscan agroforestry areas
vol. 14, pp. 41-47 (online: 14 January 2021)
Research Articles
Differences of fire activity and their underlying factors among vegetation formations in Greece
vol. 6, pp. 132-140 (online: 08 April 2013)
iForest Database Search
Search By Author
Search By Keyword
Google Scholar Search
Citing Articles
Search By Author
Search By Keywords
PubMed Search
Search By Author
Search By Keyword


