Growth patterns of forest stands - the response towards pollutants and climatic impact
iForest - Biogeosciences and Forestry, Volume 2, Issue 1, Pages 4-6 (2009)
doi: https://doi.org/10.3832/ifor0472-002
Published: Jan 21, 2009 - Copyright © 2009 SISEF
Research Articles
Collection/Special Issue: Cost Action E29 Meeting 2008 - Istanbul (Turkey)
Future Monitoring and Research Needs for Forest Ecosystems
Guest Editors: Marcus Schaub (WSL, Birmensdorf, CH)
Abstract
Dendroecological analysis of tree and stand growth patterns is discussed as an appropriate tool to quantify response of a forest stand to changing environmental factors, and evidence is provided that the response of trees to current environmental influences can be traced by high resolution measurements of diameter increment.
Keywords
Dendroecology, Growth response, Autocorrelation, Sensitivity
Introduction
Up to now within the ICP Forests monitoring program a broad variety of parameters were compiled which are mainly related to the causes side of the cause-effect relationships between site factors and tree growth. Tree growth data (breast height diameter, tree height) do only exist at time steps of five years as mandatory parameters. These data can be used for calculation of growing stock and carbon stock. However, the data obtained from this calculation do not allow an exact assignment to a certain year. Parameters which reflect the changing growth conditions year by year are urgently needed. Such a parameter of tree vigour should be easily accessed within monitoring programs year by year as well as available as time series retrospective to enable an insight into the growth history of the stand. Crown condition data are seen as suitable parameters since the beginning of ICP Forests monitoring program. Such crown condition assessments are quick, easy and cheap to do. The interpretation of such data sequences which are still short, may be complicated by the occurrence of strong fructification (masting) years of beech and oak. In these cases, generally the foliage is lowered. Such effects may not be interpreted as a lowered tree vigour. Usually, if crown condition is weak it is suggesting that current tree vigour is lowered. On the other hand, if crown condition is well it is difficult to prove that tree vigour is well. Growth rates can be lowered considerably while foliage is still inconspicuous ([7]). In particular, the relations between crown condition and wooden increment of trees and stands are far away from being clarified and must still be seen as a field of future research. Physiological investigations of these relationships may be useful to improve our understanding in principle by case studies.
Knowledge about the development of an entire forest stand’s life span may be obtained by dendroecological investigations. The growth and site history of a stand may be reconstructed using tree ring time series by taking increment cores which cover the whole range between pith and bark of dominant trees and subsequent tree ring analysis. Such ring width time series of allocated woody substance contain much information on the environmental conditions and impacts which affected the growth course of trees. The formation of wood is the final result of the complete metabolic balance. It is the share of the balance between produced matter by the foliage, respiration and higher priorities of allocation to other tree organs (roots, fruits etc.) which was not consumed elsewhere. This remaining share refers directly to the state of reserve pool. Therefore, the amount of new wood formation can be understood as a suitable tree vigour indicator.
Contrary to crown condition data tree ring widths are not visually rated but measured. This fact offers the advantage that observer related estimation errors are avoided and that the tree ring data quality can be checked using regional master chronologies to test synchronism and cross correlations. Tree growth rates are affected by both pollutants and climatic stress. According to this complexity a comprehensive dendroecological analysis of tree and stand growth patterns is considered to be an appropriate tool to quantify response of a forest stand to changing environmental factors.
Methods
The following dendroecological investigative branches were applied to 86 tree ring chronologies from German Level II plots to get information on tree’s response to external factors:
- growth course (homogeneity vs. structural breaks)
- autocorrelation and sensitivity parameter in tree ring series, their relationships and temporal drifts (robustness vs. susceptibility to be damaged);
- appearance, impact strength and frequency of pointer years;
- analysis and modelling of climate-growth relationships ([5], [2], [1]);
- forecasting of future stand development based on discovered climate-effect relationships and climatic scenarios.
This contribution concentrates on the first two points.
Analysis of growth courses
Fundamental knowledge on normality of growth courses for each tree species is required as a precondition to evaluate findings from tree ring analysis appropriately. Structural breaks within growth time series may be verified by the methods of linear or non-linear r-phases splines ([9], [10]) or singular spectrum analysis (SSA - [8]).
Autocorrelation and sensitivity
Autocorrelation within time series describes the dependence of the current tree ring width at each time step t from preceding ring widths ([13], [4] - eqn. 1):
Consecutive tree ring widths are never independent on its own. The natural meaning of this mathematical parameter is that current impacts are damped but persist as after-effects. Autocorrelation can be seen as an expression of the biological inheritance of tree growth and as buffering ability of trees against external forces. This robustness prevents trees and forests from immediate suffering and dying off by singular external impacts. It is a principle of survival. In the following discussions only the most important first order autocorrelation AR(1) which describes the relation of TRW t to TRW t-1 is taken into consideration.
The sensitivity parameter S within tree ring series indicates the year-to-year fluctuations of ring widths ([14] - p. 92). It shows if equalised or more extreme environmental factors did affect tree growth. High sensitivity of ring widths must be seen as a clear indicator of stress conditions. Both, autocorrelation and sensitivity parameter may be calculated and applied to entire time series or to sub-ranges of these.
Results
The variety of results and findings from the analysis of 86 sample plots can not described here. Two examples of methods mentioned above (Fig. 1 and Fig. 2) illustrate the potential of the dendroecological analysis of tree growth time series. The method of a linear 3 phases spline was applied to the time series of relative basal area increment (rBAI) of the Level II plot Huenfeld in Hesse, Germany (Fig. 1). The years 1915 and 1976 were estimated as breakpoints within the whole development. In contrast to a simple linear trend the application of the 3 phases spline led to a decrease of the mean square error from 1.36606 to 0.60408.
Fig. 1 - German Level II plot Huenfeld, Hesse; old grown stand of Common Beech; time series of relative basal area increment (rBAI) together with the estimated linear 3-phases spline and the breakpoints of 1915 and 1976.
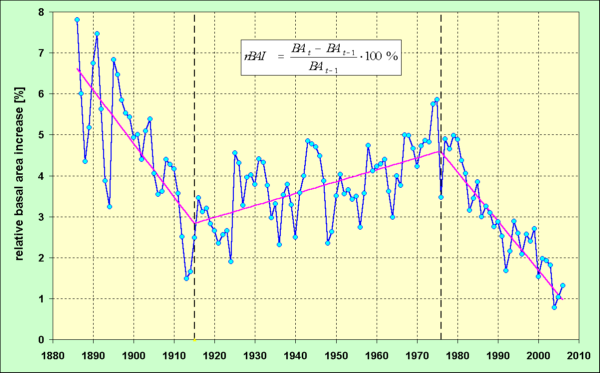
Fig. 2 - Data visualisation by ellipses (mean ± standard deviation) of both, first order autocorrelation AR(1) (abscissa) and sensitvity parameter (ordinate) of always 20 sample trees per chronology; Values were calculated within the two time spans from 1951 to 1990 and after 1990 up to the year of sampling the tree cores (2005-2007). Data: 29 chronologies of Common beech from Germany.
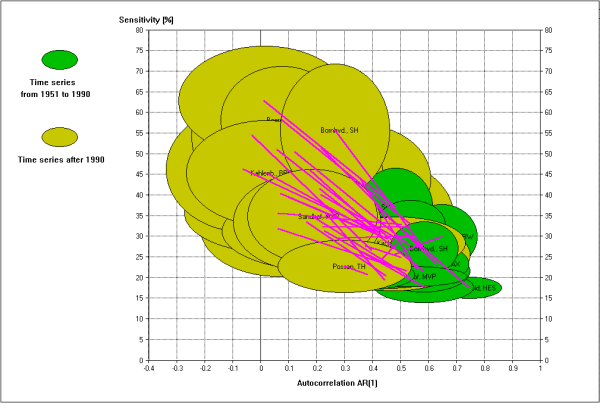
Some 29 beech (Fagus sylvatica L.) plots were investigated using running time windows to calculate AR(1) and S along the whole time series of mean radial increment. It was found that there is a long time span where AR(1) and S show only random walks. However, in the most cases from the late 1980 years up to now, AR(1) decreases and S increases dramatically. Therefore, a calculation of the means of AR(1) and S was carried out for two time intervals which range from 1950 to 1990 and from 1991 up to the point of taking increment cores (2005-2007) for all individual series of the 29 beech chronologies. In diagrams AR(1) and S may be displayed jointly as ellipses which contain their means in its centre and means ± standard deviations are shown by the ellipses edge line. Fig. 2 shows how AR(1) (seen as robustness) and S (as susceptibility to be damaged) have changed after 1990.
Discussion
Growth trend changes may only be determined before the background of existing normality concepts or models. Light demanding tree species show a degressive shape of diameter curve and a monotonic decreasing trend of the tree ring width curve which is still distinct from zero at high ages, accordingly. Shade tolerant species show a long lasting, nearly linear diameter growth trend and according to this behaviour, constant ring widths on average. Growth trend changes have to be determined, when deviations from these principal patterns occur not only temporary but last for decades. Growth releases may occur gradually, for instance as sustained accelerated growth, or abruptly following the impact of extreme external forces. In many cases a sharp negative pointer year may induce an enduring growth depression. The actual status of a forest stand (structure, level of current increment) may only be evaluated and understood appropriately if preceding growth phases are known and taken into consideration (Fig. 1). The example of the Huenfeld beech chronology shows that an evaluation of the current increment level would fail completely without the knowledge of the preceding phases of the time series.
Both, autocorrelation AR(1) and sensitivity parameter S may be used to investigate growth patterns at several hierarchical levels. The calculation of mean values of AR(1) and S for entire time series and their application to the individual trees of a chronology may give hints, if the stand is uniform or differentiated regarding the criteria robustness and sensibility to external forces. In many cases a temporal drift of AR(1) and S may be observed when these parameters are calculated within a time window running along the whole time series. The simultaneous decrease of AR(1) and increase of S after 1990 must be interpreted as an increased disposition to be damaged, especially against unfavourable climatic impacts. Similar patterns of the temporal drift of the AR(1) - S relation were also found for a number of spruce (Picea abies (L.) H. Karst.) stands within the German Level II program.
Conclusions
Tree ring analysis can provide information on trees and stand development in the past up to now and is carried out only once. The response of trees to current environmental influences may be traced by high resolution diameter increment measurements as an appropriate monitoring method. Comparable results are attained by a concerted sampling strategy to choose trees for taking increment cores and dendrometer trees, respectively.
Among other tree species in Germany beech must be evaluated as to be stronger influenced by climate change. Similar findings are reported by Piovesan et al. ([12]) for Italy. The inclusion of well developed and tested dendroecological methods into future monitoring programs will provide many advantages and new findings. Especially the elaboration and analysis of tree ring networks (chronologies well scattered with respect to space and altitude) are currently seen as successful fields of ecological research ([6], [11], [3], [12]). Ongoing depositions and increasing climatic stress require urgently the quantification of the growth response of forests as an indicator of tree and stand vigour.
Acknowledgements
Increment cores were taken from 86 German Level II plots from 2005 to 2007. I am grateful to the colleagues from all forest research stations of the German bundeslaender for logistic assistance and support of my fieldwork. I wish to thank my colleague Dr. Walter Seidling for repeated perusals of the manuscript.
References
Gscholar
Gscholar
Gscholar
Gscholar
Gscholar
Gscholar
Gscholar
Gscholar
Gscholar
Gscholar
Authors’ Info
Authors’ Affiliation
Johann Heinrich von Thünen Institute, Federal Research Institute for Rural Areas, Forestry and Fisheries, Institute for Forest Ecology and Forest Inventory, 16225 Eberswalde, Alfred-Möller-Straße 1 (Germany)
Corresponding author
Paper Info
Citation
Beck W (2009). Growth patterns of forest stands - the response towards pollutants and climatic impact. iForest 2: 4-6. - doi: 10.3832/ifor0472-002
Academic Editor
Marcus Schaub
Paper history
Received: Apr 08, 2008
Accepted: Dec 09, 2008
First online: Jan 21, 2009
Publication Date: Jan 21, 2009
Publication Time: 1.43 months
Copyright Information
© SISEF - The Italian Society of Silviculture and Forest Ecology 2009
Open Access
This article is distributed under the terms of the Creative Commons Attribution-Non Commercial 4.0 International (https://creativecommons.org/licenses/by-nc/4.0/), which permits unrestricted use, distribution, and reproduction in any medium, provided you give appropriate credit to the original author(s) and the source, provide a link to the Creative Commons license, and indicate if changes were made.

Web Metrics
Breakdown by View Type
Article Usage
Total Article Views: 53197
(from publication date up to now)
Breakdown by View Type
HTML Page Views: 42989
Abstract Page Views: 4221
PDF Downloads: 4685
Citation/Reference Downloads: 48
XML Downloads: 1254
Web Metrics
Days since publication: 6370
Overall contacts: 53197
Avg. contacts per week: 58.46
Article Citations
Article citations are based on data periodically collected from the Clarivate Web of Science web site
(last update: Mar 2025)
Total number of cites (since 2009): 18
Average cites per year: 1.06
Publication Metrics
by Dimensions ©
Articles citing this article
List of the papers citing this article based on CrossRef Cited-by.
Related Contents
iForest Similar Articles
Review Papers
Monitoring the effects of air pollution on forest condition in Europe: is crown defoliation an adequate indicator?
vol. 3, pp. 86-88 (online: 15 July 2010)
Technical Reports
Air pollution regulations in Turkey and harmonization with the EU legislation
vol. 4, pp. 181-185 (online: 11 August 2011)
Research Articles
Bioaccumulation of long-term atmospheric heavy metal pollution within the Carpathian arch: monumental trees and their leaves memoir
vol. 17, pp. 370-377 (online: 27 November 2024)
Editorials
COST Action FP0903: “Research, monitoring and modelling in the study of climate change and air pollution impacts on forest ecosystems”
vol. 4, pp. 160-161 (online: 11 August 2011)
Research Articles
Dust collection potential and air pollution tolerance indices in some young plant species in arid regions of Iran
vol. 12, pp. 558-564 (online: 17 December 2019)
Commentaries & Perspectives
Clean air policy under the UNECE Convention on long-range transboundary air pollution: how are monitoring results “translated” to policy action
vol. 2, pp. 49-50 (online: 21 January 2009)
Research Articles
Long-term monitoring of air pollution effects on selected forest ecosystems in the Bucegi-Piatra Craiului and Retezat Mountains, southern Carpathians (Romania)
vol. 4, pp. 49-60 (online: 05 April 2011)
Research Articles
Growth patterns of Scots pine (Pinus sylvestris L.) under the current regional pollution load in Lithuania
vol. 8, pp. 509-516 (online: 12 November 2014)
Research Articles
A fast screening approach for genetic tolerance to air pollution in Scots pine field tests
vol. 6, pp. 262-267 (online: 01 July 2013)
Research Articles
First results of a nation-wide systematic forest condition survey in Turkey
vol. 4, pp. 145-149 (online: 01 June 2011)
iForest Database Search
Search By Author
Search By Keyword
Google Scholar Search
Citing Articles
Search By Author
Search By Keywords


