Improving tree diameter measurements above irregularities in Central African forests: a Close-Range Photogrammetric approach
iForest - Biogeosciences and Forestry, Volume 18, Issue 6, Pages 382-390 (2025)
doi: https://doi.org/10.3832/ifor4685-018
Published: Dec 16, 2025 - Copyright © 2025 SISEF
Research Articles
Abstract
Accurate measurement of tree diameter in forests is essential for sustainable management of forest resources, ecological assessment, and scientific research. However, most trees in tropical forests have irregularities at the base of the trunk, making it challenging to measure the trunk diameter above them with a tape measure. To meet the increasing demand for data accuracy and reliability, approaches using three-dimensional (3D) point clouds offer a valuable new source of data for tree measurements. This study examines the accuracy of diameter measurements above irregularities using the Close-Range Photogrammetric approach, with diameter tape serving as the reference. A total of 212 trees measured in the north of the Republic of Congo were reconstructed in three dimensions (3D), including 128 trees in semi-deciduous forest and 84 trees in evergreen forest. Comparisons were made in terms of dependence (simple linear regression), correlation (Pearson, Kendall, and Spearman tests), agreement (Bland and Altman method), and difference (Mean Absolute Error - MAE, Root Mean Square Error - RMSE, bias - BIAS, and coefficient of variation - CV). In addition to a near perfect match, a strong association of diameter measurements and a good degree of agreement, the results indicated the presence of differences between diameter measurement approaches in semi-deciduous forest (MAE = 9.25 cm, RMSE = 16.95 cm, BIAS = 7.45 cm) and evergreen forest (MAE = 3.88 cm, RMSE = 8.47 cm, BIAS = 2.37 cm). These differences are minor in the evergreen forest. The magnitude of the differences found is mostly due to the size of the large-diameter classes. In addition, the coefficients of variation (CV) of diameter obtained from the Close-Range Photogrammetric approach were lower than those obtained from the classic conventional approach in both forests, indicating the higher accuracy of the former approach. Further studies could use larger data samples to provide more accurate estimates and verify the limits of these applications’ measurement capabilities.
Keywords
Diameter, Irregular Trunk Trees, Measuring Accuracy, Close-range Photogrammetric Approach
Introduction
Diameter is the most commonly measured tree attribute, whether for inventory, management, or forest monitoring purposes ([46]). It is a crucial indicator of forest health and functionality ([23]). However, measuring the diameter at breast height of tropical trees using conventional dendrometric tools is biased when the trunk has irregularities at its base ([12]). In this case, we recommend moving the diameter measurement point above the irregularities until the trunk has a geometrically cylindrical shape ([3], [38]). Nonetheless, in some situations, it may not be possible to raise the point of diametric measurement above the irregularities using conventional dendrometric tools, which means the forester must visually measure or determine the trunk diameter ([21], [10]). Measurements of this kind yield values that differ from the actual tree sizes ([10]).
To address the inaccessibility of diameter measurement above irregularities, many instruments using the indirect approach (no contact with the tree) have been proposed in the literature ([11], [45], [44]). These instruments can be differentiated based on cost, accuracy, precision, and ease of use ([11], [46], [37], [34]). However, indirect approaches are imprecise or time- and resource-intensive ([29], [45], [44]).
To meet the increasing demands for data accuracy and robustness, three-dimensional (3D) point clouds are a valuable new source of data for tree measurements ([33]). 3D tree data can be subdivided into two primary acquisition methods: Terrestrial Laser Scanning (TLS) and Close-Range Photogrammetry (CRP) ([28], [42]). TLS is a technology that uses light detection and ranging (LiDAR) to characterise individual stems at plot or tree scale more effectively, providing accurate estimates of stem diameter, height, volume, and biomass ([9]). However, TLS units are expensive and often difficult to handle ([28]). A quicker and cheaper alternative for obtaining similar data for use in the forest inventory is the Close-Range Photogrammetric (CPR) approach ([28], [34]). CRP allows obtaining 3D point cloud data from sequential images based on the principle of multi-view geometry ([24], [50], [26]). At present, the dominant method of 3D reconstruction is Structure from Motion (SfM) ([4], [2], [14]). Based on SfM, recent studies have demonstrated the success of CRP in reconstructing individual stems at tree or plot scale to estimate diameter, volume, above-ground biomass ([19], [4], [33], [34], [35], [32], [22]), detect trunk shape ([4]), establish taper equations ([5], [13]) and monitor tree diameter growth ([36]).
The potential of using CRP to estimate tree diameter has been widely demonstrated in temperate and boreal forests ([19], [33], [34], [39], [48], [14], [32]). These studies show that the precision (RMSE) of diameter estimates varies from 0.21 to 3.1 cm at the tree scale ([42], [48], [14]) and from 1.21 to 7.2 cm at the plot scale ([19], [33], [39], [32]). However, in tropical regions, very little information is currently available on measuring the diameter of trees above irregularities using the CRP approach ([4], [10]). Furthermore, studies using the CRP approach for diameter measurement over irregularities in the tropics have focused on a single forest type ([4], [10]). Therefore, further analysis on diameter accuracy as a function of diameter class size and within different forest types is needed to understand the usefulness of the CRP approach in forest management and biodiversity conservation.
This study aims to detect possible biases when using the Close-Range Photogrammetric approach and the classic conventional approach to measure tree diameters above irregularities. We seek to answer the following questions: (i) Do the measurements of diameter above irregularities using the Close-Range Photogrammetric approach and the classic conventional approach differ significantly? (ii) How accurate is the measurement of diameter above irregularities using the CPR approach compared with the classic conventional approach?
Material and methods
Study sites and sampling
The study was carried out at two forest sites characteristic of the primary forest types in the Congo Basin, as described by Réjou-Méchain et al. ([41]): a semi-deciduous forest (Semi-F) and an evergreen forest (Ever-F) in the north of the Republic of Congo. The Loundoungou site, located at 17° 31′ - 17° 34′ E, 02° 18′ - 02° 22′ N, belongs to Semi-F and is dominated by light-demanding deciduous tree species, notably of the genus Celtis ([17]), while the Ngombé site (15° 20′ - 16° 38′ E, 00° 27′ - 01° 48′ N, Ever-F) is characterised by species belonging to the Meliaceae and Fabaceae families ([27]). The forest sites are dominated by clay soils ([27], [16]). The climate at forest sites is humid tropical, with a dry season (December-February) and a long rainy season (March-November). On average, annual rainfall ranges from 1700 to 1900 mm, and the average yearly temperature is 25 °C. The two forest sites have gentle topography, with average altitudes of 400-460 m a.s.l.
In each forest site, fieldwork was carried out within an 800-ha experimental set-up (DynAfFor project - ⇒ https://www.dynaffor.org/) described by Forni et al. ([18]). Using DynAfFor forest inventories, we targeted 11 species of irregular-trunk trees (n=9 species for Semi-F and n=5 for Ever-F, with three species shared between the two sites) belonging to 11 genera and eight families (Tab. S1 in Supplementary material). For each species, we sampled an average of 20 individuals (range: 5 to 47 trees), totaling 307 trees (181 in Semi-F and 126 in Ever-F).
Photogrammetric measurements and processing
The image acquisition procedure consisted of removing all small plants and lianas within a 3 m radius around each tree. Four photogrammetric targets were placed at the four cardinal points around each tree at a distance of less than 1 m. The reference target was placed to the south to avoid backlighting. Targets were used to improve image alignment and point cloud scaling. The Nikon D5600™ digital SLR camera was used with a fixed zoom lens with a focal length of 16 mm. The camera (focus, ISO, and shutter speed) has been set to automatic mode. All trees were photographed with these settings. A series of photographs was taken around each tree using an image-acquisition method similar to the “one panorama at each stage” approach ([4]). At each step around the tree (1 m), photographs were taken with a substantial overlap (vertical panorama) and convergent images. The distance from the image-taking point to the tree was 3 m.
The Agisoft Metashape Professional (Agisoft LCC, St Petersburg, Russia) software was used to process the images. Each series of tree photos was loaded into the software without any additional information. The photogrammetric workflow of this software consists of six phases, namely, (1) target detection, (2) image alignment and sparse cloud generation, (3) scaling of the constructed 3D point clouds, (4) optimization of the sparse point clouds, (5) point cloud densification, and (6) mesh construction.
The photogrammetric workflow can be summarised as follows. Once the target has been detected (phase 1), the Metashape software automatically calculates lens calibration parameters using the SfM algorithm. The final product of phase 2 is a scattered point cloud of the tree trunk with camera locations. In the third phase (3), the point cloud is scaled using coded targets automatically detected on the photogrammetric test patterns from phase 1. The resulting 3D point cloud after scaling was optimised to adjust the camera’s intrinsic and extrinsic parameters in the fourth phase. Phase 4 brings back the cloud of points scattered along the trunk. Before the point clouds were densified to create the mesh, ill-fitting point clouds along the trunk were removed to reduce processing time. Then, thanks to the image network’s geometric knowledge, it was possible to produce a dense point cloud, including the calculation of a corresponding 3D point for almost every image pixel using the Multi-View Stereo (MVS) algorithm (phase 5). Finally, the mesh (phase 6) was generated, saved, and exported as a “mesh” file containing the XYZ coordinates to obtain the cross-sections in RStudio.
The method was applied using a computer equipped with an AMD Ryzen 9 5900X processor (12 cores, 3.7/4.8 GHz, 70 MB cache), an Asus Prime X570-Pro motherboard with an AMD X570 chipset, and 64 GB of DDR4 memory. From the 3D mesh, cross-sections along the trunk were generated following the workflow detailed in Bauwens et al. ([4]) using the R packages “sp”, “Raster”, and “lidR”. The workflow produces 2 cm-thick cross-sections every 20 cm along the trunk’s Z axis. The workflow was successfully implemented on 88% (n = 160) of the 181 Semi-F trees and 91% (n = 115) of the 126 Ever-F trees, and failed on the remaining trees, which were therefore discarded from the analysis.
The data was automatically saved in a structured CSV file, significantly reducing data entry time and minimizing the risk of transcription errors. The generated file included essential information, such as tree ID, species, forest type, and cross-sections at different heights, facilitating data analysis and management.
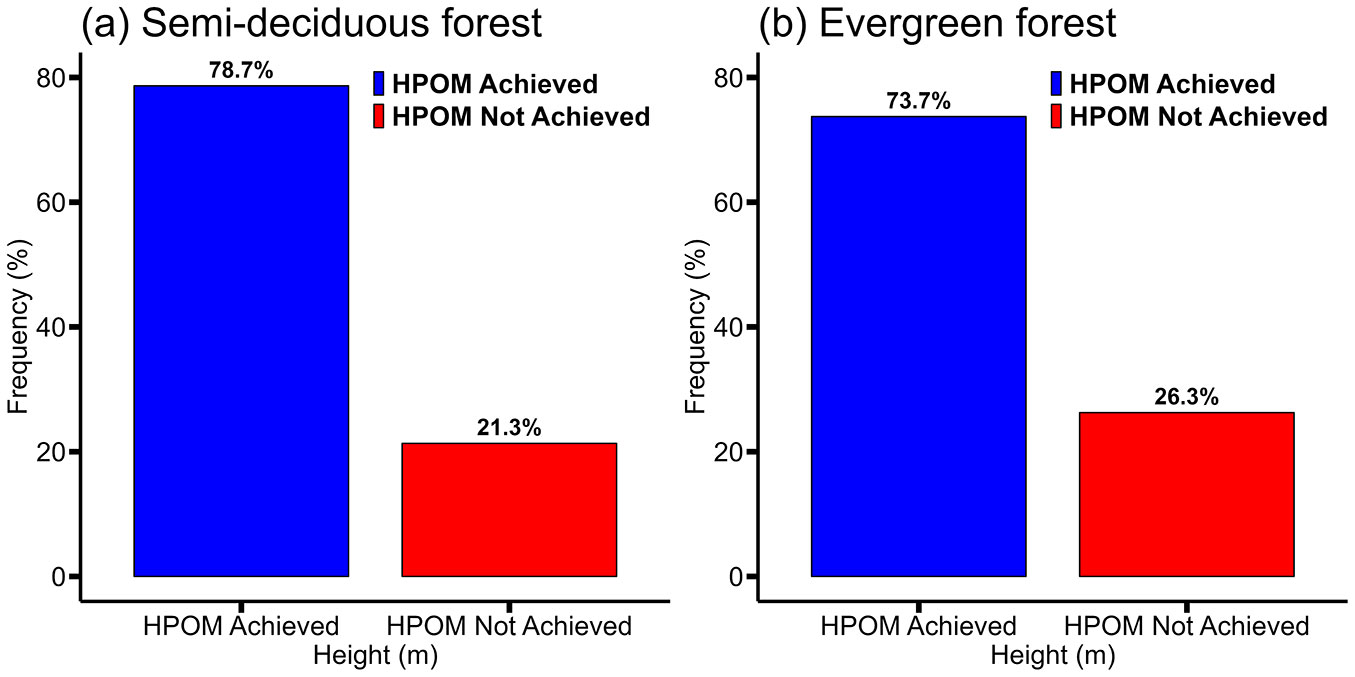
Before estimating the photogrammetric variables, a preliminary analysis was carried out on the cross-sections obtained along the trunks of the 3D-generated trees (Fig. 1), as well as on the 3D models that had reached the diameter measurement height above the irregularities (Fig. 2) in each forest site. Fig. 1shows the distribution of cross-sections obtained along the trunk in the forest sites. Examination of these frequency histograms reveals the most significant proportion of cross-sections between 1.30 and 6 m in height in the semi-deciduous forest (60.38% with an average height ± standard deviation of 4.12 ± 2.75 m) and in the evergreen forest (64.01% with an average height of 3.55 ± 2.28 m). Fig. 1also shows that cross-sections were obtained from some trees up to 16.30 m in the semi-deciduous forest and 10.30 m in the evergreen forest. In the semi-deciduous forest, 128 of the 160 trees reconstructed in 3D reached the point of measurement (POM) for diameter (HPOM). Fig. 2a shows that 78.7% of trees achieved HPOM, with an average height of 4.52 ± 2.14 m in the semi-deciduous forest. On the other hand, in the evergreen forest, 84 of the 115 trees reconstructed in 3D reached the HPOM. Fig. 2b shows that HPOM was achieved by 73.7% of trees, with an average height of 2.31 ± 1.34 m in the evergreen forest.
Fig. 1 - Distribution of cross-sections at different heights along the trunk in semi-deciduous and evergreen forests. The red line indicates the measurement point at 1.30 m above the ground.
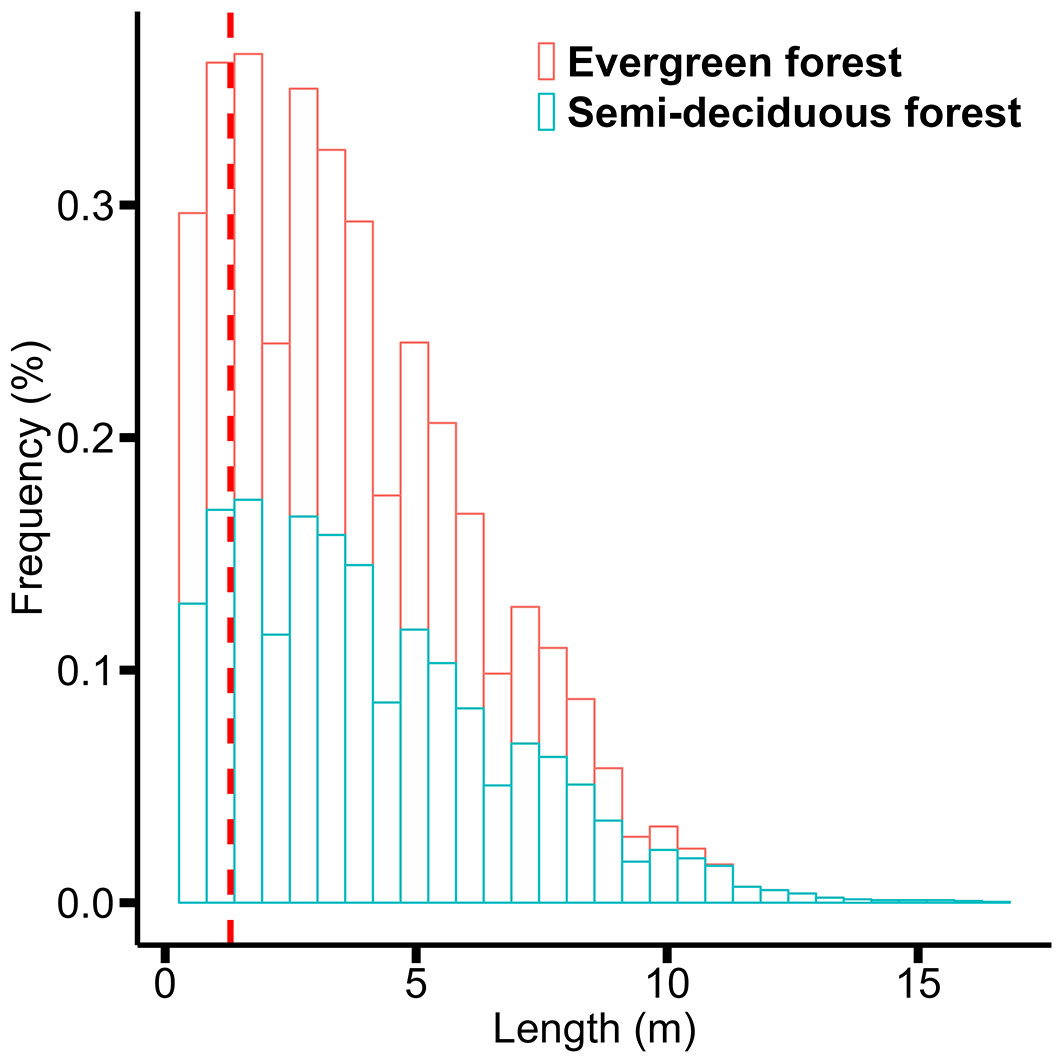
Fig. 2 - Distribution of trees whose height has achieved the diameter measurement point in (a) semi-deciduous forest and (b) evergreen forest.
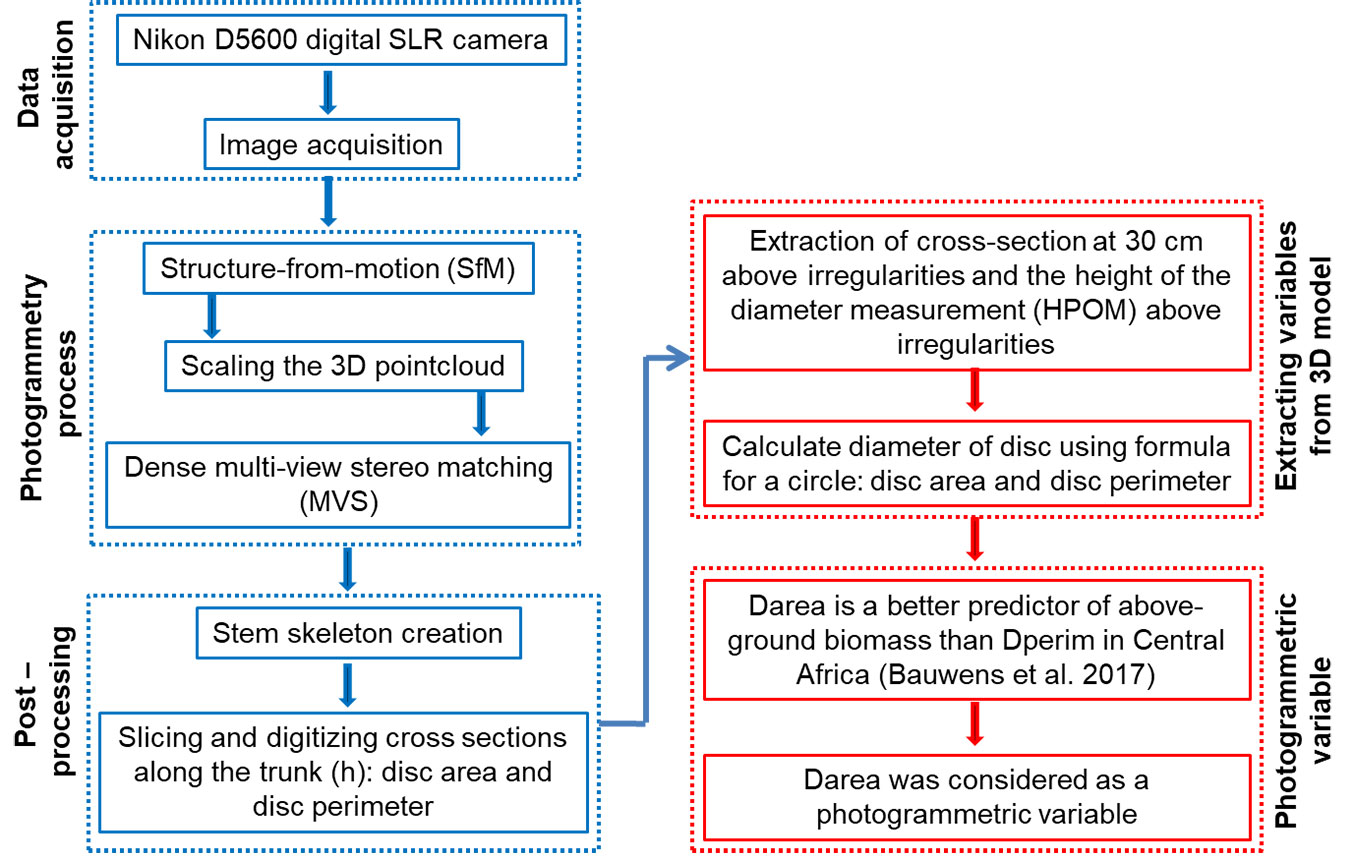
Only trees for which the 3D model reached the diameter measurement height (HPOM) were taken into account. Fig. S1 (Supplementary material) show a sample of the shape of the cross-sections obtained 30 cm above the irregularities. For each cross-section, the disc area (“Darea”) and disc perimeter (“Dperim”) were calculated. Since diameter is more frequently used than basal area to quantify tree size in forestry science, the area and perimeter of cross-sections were converted into diameter. Previous studies have already shown that Darea is a better predictor of above-ground biomass than Dperim ([4], [22]). In this study, Darea was considered equivalent to the point-of-measurement (POM) for diameter. The photogrammetric workflow is shown in Fig. 3.
Fig. 3 - Photogrammetric workflow.
Tree diameter measurements
In addition to Close-Range Photogrammetric measurements, diameter measurements were obtained at the tree level. The diameter of the trees (D, in cm) was measured with a tape at a height of 30 cm above any deformation ([38]). A single person took all the diameter measurements. This process enabled avoiding differences between individuals, even slight ones ([15]).
Data analysis
To support statistical comparisons between diameter measurement methods above irregularities, the mean and standard deviation were calculated for all data as a function of diameter class sizes. To detect differences between the diameter obtained using the Close-Range Photogrammetric approach (Darea) and the diameter obtained using the classic conventional approach (DPOM), the Wilcoxon pairwise test was performed on all data, and according to diameter class (D < 70: smaller diameter class, D > 70: larger diameter class). In addition, a complete correlation analysis was carried out on all data and as a function of diameter class sizes, using Pearson (r), Spearman (ρ), and Kendall (τ) tests ([49]), complemented by a graphical representation of association and dependence (causality) in the data and the development of simple linear regression models. These models and their key statistics were used to assess whether there were general trends in the data fit and their magnitudes. These analyses were carried out on the entire data set and by diameter class.
To examine the accuracy of diameter measurement using the Close-Range Photogrammetric approach (Darea) versus the classic conventional approach (DPOM), Mean Absolute Error (MAE), Root Mean Square Error (RMSE) and bias were estimated for all data and as a function of diameter class size (D < 70: smaller diameter class, D > 70: larger diameter class). Absolute differences between diameters and relative differences between diameters were also estimated. As a measure of error, MAE is a statistical measure used to quantify the accuracy of a measurement method by comparing predicted or estimated values with reference or absolute values (eqn. 1):
where n is the total number of observations, yi is the real (or reference) value, and hat{y}i is the estimated or measured value.
RMSE is calculated as the square root of the mean of the squared deviations between measured and reference values in a given sample (eqn. 2):
Finally, BIAS is calculated as the mean of the differences between measured and reference values (eqn. 3):
When the precision of the two sets of estimates is uncertain, these error measures can be interpreted as differences between them and present different sensitivities to the magnitude of differences found in the data; thus, the RMSE is more sensitive to a large magnitude of differences in the data, unlike the MAE ([47]). On the other hand, BIAS measures the average estimation error of new data relative to reference data ([20]) and also accounts for the direction of the estimation error. In addition, the agreement between the measurement methods compared was analyzed using the method developed by Bland and Altman. Bland-Altman plots are generally used to assess agreement between two measurements of the same variable when it is uncertain whether the measurements are free of error ([20]). This statistical method is handy for finding out whether a new measurement method will achieve acceptable accuracy compared with a reference method, provided that acceptable limits of agreement can be set in advance ([6], [20], [7]). Typically, it plots the absolute difference between two variables with respect to their mean values in a space defined by two limits of agreement (upper and lower limits of agreement) that includes an identity line (zero differences) and the line characterizing the mean of the differences (Bias). When the difference values are clustered around the Bias within two standard deviations of their mean (i.e., the limits of agreement), measurement agreement between the methods being compared is generally achieved. Although this approach assumes that the differences are normally distributed, the fact that they are not is less severe than in other statistical contexts. Given that the method estimates a fixed bias, it may be necessary to test for heteroscedasticity, which can be done using several techniques ([20]), to verify the presence of a proportional bias ([30], [31]). The statistical measures taken in this study to check the agreement between the measurement methods consisted of (i) checking the normality of the data in absolute differences, (ii) checking the homoscedasticity of the data, and (iii) developing Bland-Altman graphs. As recommended in previous studies ([31]), it is helpful to check for a correlation between the differences and the mean values of a given pair of data sets before performing a Bland-Altman analysis. This statistical step used the same correlation measures as mentioned above for all compared data sets. Data homoscedasticity can be checked using Breusch-Pagan tests ([8]). Statistical analyses of method agreement using the Bland-Altman method were carried out at the sample level. The coefficients of variation of the diameters obtained from the two diameter measurement approaches were also compared. Finally, the one-sample Student’s t-test was performed to detect differences between coefficients of variation (CV%).
Departure from normal distribution of data and homogeneity of variances were tested using the Shapiro-Wilk, d’Agostino-Pearson, and Bartlett tests, respectively, before carrying out the analyses (see Tab. S2 in Supplementary materials).
Results
Comparison of tree diameter measurements above irregularities
The average diameters measured in each forest type and the associated measurement approaches are presented in Tab. 1. In general, the results show that the diameter obtained from the classic conventional approach is superior to that obtained from the Close-Range Photogrammetric (CPR) approach in both forest types and as a function of diameter class size (Tab. 1). In addition, the results of the Wilcoxon pairwise test showed no significant difference (Fig. S2) between measurements of tree diameter above irregularities made using the classic conventional approach and the Close-Range Photogrammetric approach in semi-deciduous forest (W = 7978, p-value = 0.1482) and evergreen forest (W = 4135.5, p-value = 0.8079). Similar trends were observed in small-diameter class sizes in semi-deciduous forest (W = 650.5, p-value = 0.176) and evergreen forest (W = 1480, p-value = 0.8949), but also in large-diameter class sizes in evergreen forest (W = 711.5, p-value = 0.478). The absence of differences in tree diameters indicates that diameter-measurement methods have little influence on measurements over irregularities. However, significant differences were observed in large-diameter class size in the semi-deciduous forest (W = 4461.5, p-value < 0.05). The significant differences observed in the size of the large-diameter class in the semi-deciduous forest strongly indicate that diameter measurements change statistically as a function of the measurement approach in the forest type from which the sample was drawn.
Tab. 1 - Means ± standard deviation of the diameter of irregular trunk trees in semi-deciduous and evergreen forests. Different letters indicate significant (p<0.05) differences after Wilcoxon pairwise test.
| Site | Diameter type |
All data | D < 70 cm | D > 70 cm |
|---|---|---|---|---|
| Semi-deciduous forest | DPOM | 94.74 ± 38.38 a | 53.64 ± 11.34 a | 110.33 ± 33.11 a |
| Darea | 87.28 ± 33.74 a | 50.56 ± 11.11 a | 101.21 ± 28.55 b | |
| Evergreen forest | DPOM | 76.12 ± 36.69 a | 51.14 ± 14.45 a | 113.58 ± 26.48 a |
| Darea | 73.74 ± 32.67 a | 51.10 ± 13.97 a | 107.71 ± 20.99 a |
The relationship between diameter measurements and correlation coefficients for each forest type is shown in Fig. 4 and Tab. S3 (Supplementary material). In addition, Tab. S4 shows the parameters fitted using simple linear regression. As shown in Fig. 4a, the Darea and DPOM measurements are more dispersed around the reference line (red line), indicating greater differences between the two diameter measurement methods in the upper diameter range, generally above 70 cm. Correlation coefficients above 0.70 indicate the two methods are most closely associated for the data set (Fig. 4a) and for diameter class size (Tab. S3). The coefficients of determination (R2 - Tab. S4) confirm the high degree of dispersion of the diameter values compared in the semi-deciduous forest.
Fig. 4 - Linear relationship between diameter above irregularities (DPOM) and equivalent diameter derived from the Close-Range Photogrammetric approach (Darea) in semi-deciduous and evergreen forest. Pearson’s correlation coefficient (r), Kendall’s correlation coefficient (ρ), Spearman’s correlation coefficient (τ), and p-value are shown.
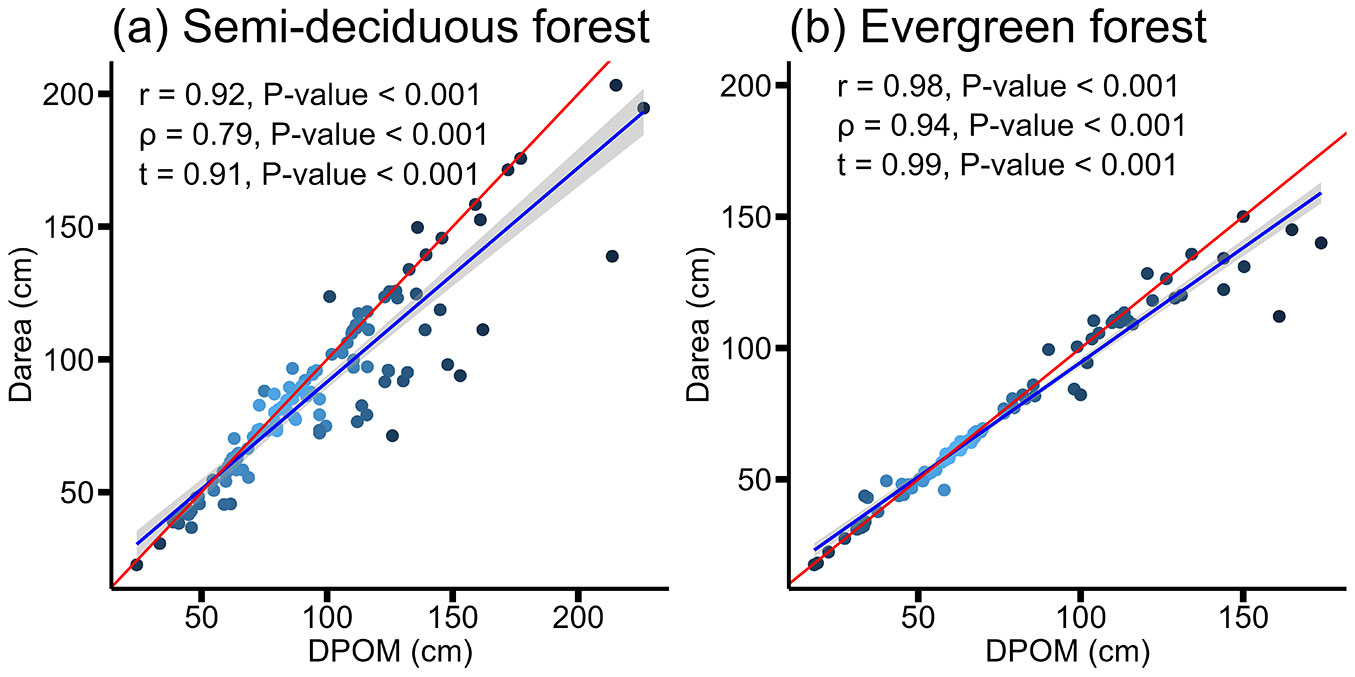
In contrast, the results in Fig. 4b show smaller differences between the two measurement methods around the reference line (red line). The correlation results show a similar trend (Tab. S3 in Supplementary material), placing the values of both methods in the closest association in the evergreen forest. Similar trends can be observed for the regression statistics presented in Tab. S4, where the response in Darea as a linear function of DPOM gave the highest coefficients of determination (R2 - Tab. S4), and a slope close to 1 and an intercept close to 0.
The relationship between diameter measurements proved less sensitive to small-diameter class sizes and to evergreen forests, with closer correlation coefficients. In addition, the correlation between the diameter measurements was relatively linear, indicating a proportional change in Darea as the reference data (DPOM) varied. This applied to forest types and is confirmed by comparing the Pearson’s (r) and Spearman’s (ρ) correlation coefficients, which were close in value (Tab. S3 in Supplementary material). Given that the diameter measurement data did not follow the normal distribution, Spearman’s correlation coefficient (ρ) might be more robust in characterizing the association between the data being compared. The regression trends shown in Fig. 4indicate that Darea underestimates DPOM in semi-deciduous and evergreen forests. Simple linear regression with a slope of exactly 1 indicates a general deterministic trend in which the increase in the response variable perfectly corresponds to the increase in the independent variable. The slopes of the Darea-DPOM comparisons were < 1.
At first glance, these results indicate good agreement between diameter measurement methods (Fig. 4), particularly in the evergreen forest (Fig. 4b).
Accuracy of tree diameter estimates above irregularities
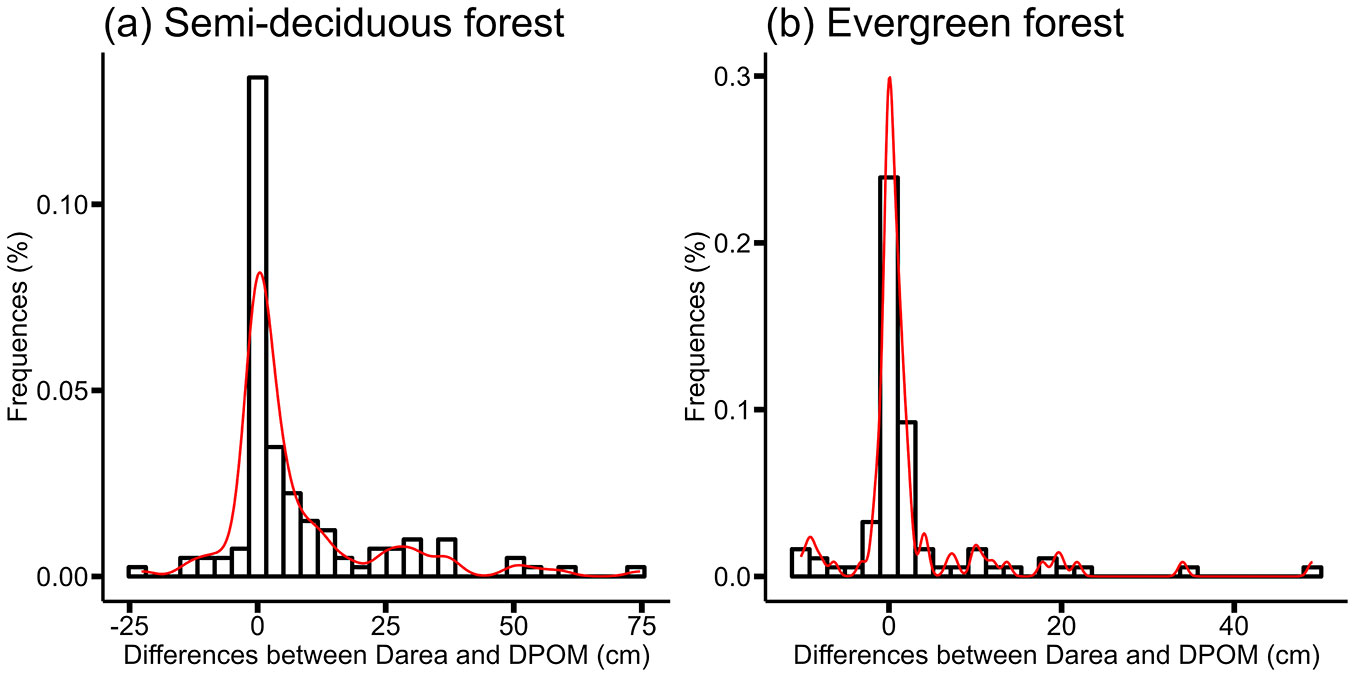
The main results of agreement between diameter measurement methods are presented in Fig. 5, Fig. 6, and Tab. 2. Supporting data and additional results are included in Tab. S4 (Supplementary material) and Fig. S3-S6. Fig. 5shows the Bland-Altman plots comparing the diameter measurement methods by forest type. Correlation analysis between differences and mean measurement values yielded low correlation coefficients in semi-deciduous forest (r = 0.30, p-value < 0.001) and evergreen forest (r = 0.49, p-value < 0.001), respectively, although both were statistically significant. In the Darea-DPOM comparison, a general trend of overestimation was observed, characterized on average by a bias of 7.45 cm in the semi-deciduous forest (Fig. 5a) and 2.37 cm in the evergreen forest (Fig. 5b). In other words, compared with the reference measurements (DPOM), the Darea measurement underestimated the semi-deciduous forest by an average of 7.45 cm and the evergreen forest by 2.37 cm (Tab. 2). Only for this comparison treatment and only for absolute differences, the normality test was validated by the Shapiro-Wilk test (Fig. 6, Tab. S2 in Supplementary material) and heteroscedasticity was observed in diameter measurements (Fig. S5) in the semi-deciduous forest (BP = 17.764, df = 1, p-value < 0.001) and evergreen forest (BP = 12.128, df = 1, p-value < 0.001), respectively.
Fig. 5 - Bland-Altman plot of Darea and DPOM concordance. Absolute differences between Darea and DPOM, taking as reference DPOM in semi-deciduous forest and evergreen forest. The dotted black lines indicate the lower and upper limits of agreement, calculated from two standard deviations. The dotted red line indicates the bias of the comparison, constructed as the mean of the absolute differences. The solid red line is the identity line.
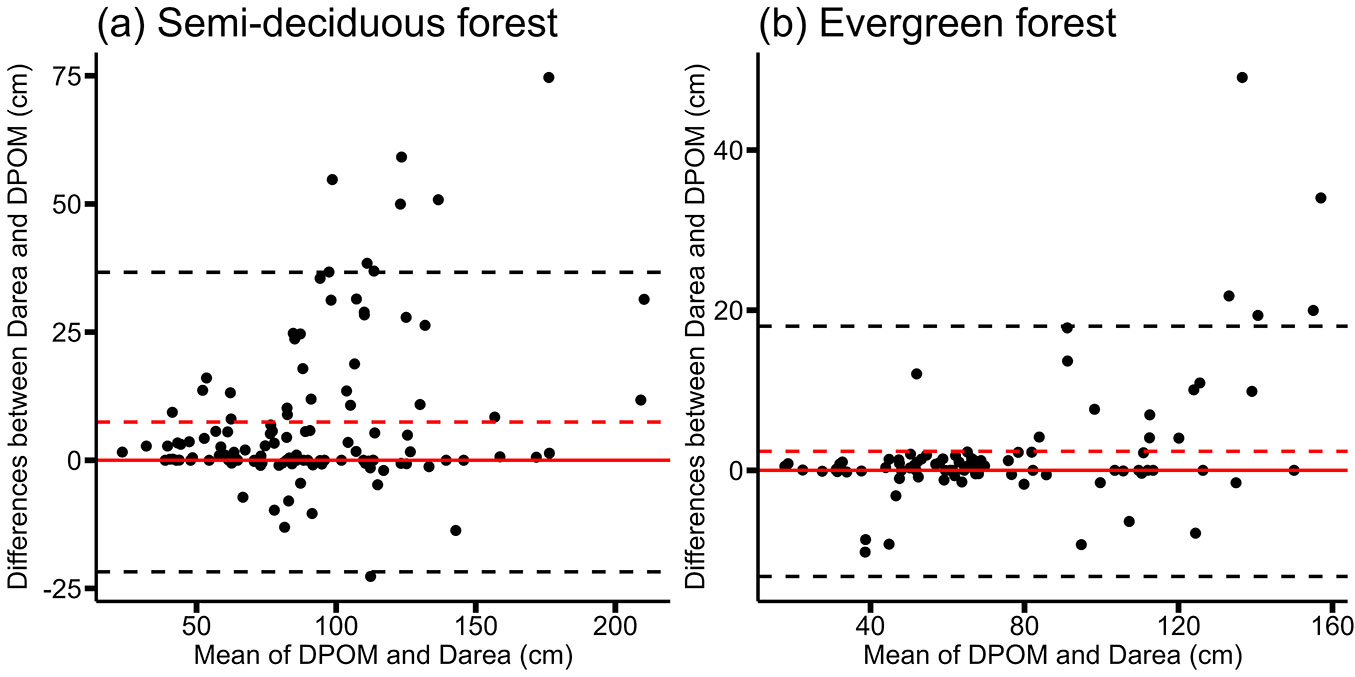
Fig. 6 - Distribution diagram of differences between Darea and DPOM measurements in semi-deciduous forest and evergreen forest. The red line shows a non-parametric kernel density estimate of the data distribution.
Tab. 2 - Differences between diameter measurement methods using error measurements.
| Site | Diameter type |
All data (cm) | D < 70 cm (cm) | D > 70 cm (cm) | ||||||
|---|---|---|---|---|---|---|---|---|---|---|
| MAE | RMSE | Bias | MAE | RMSE | Bias | MAE | RMSE | Bias | ||
| Semi-deciduous forest | DareavsDPOM | 9.25 | 16.95 | 7.45 | 3.11 | 5.27 | 3.08 | 11.57 | 19.64 | 9.11 |
| Evergreen forest | DareavsDPOM | 3.88 | 8.47 | 2.37 | 1.45 | 2.92 | 0.05 | 7.52 | 12.91 | 5.86 |
As with the complete data set, Fig. S3 (Supplementary material) depicts the Bland-Altman plots of the diameter measurement methods compared against diameter size classes in the two forest types. In the Darea-DPOM comparison, similar trends were observed in diameter class sizes, with DPOM overestimating Darea. Compared with the reference measurements (DPOM), the underestimation of the Darea measurement is low in the small-diameter class size in both semi-deciduous and evergreen forests (Tab. 2).
Tab. 2presents the main results on differences between the diameter measurement methods and the commonly used error measurements. When comparing the Darea with the DPOM for the data sample considered in the study, these error measures yield values of 9.25 cm (MAE) and 16.95 cm (RMSE) in the semi-deciduous forest, and 3.88 cm (MAE) and 8.47 cm (RMSE) in the evergreen forest. In terms of diameter class sizes, the most significant differences were measured by MAE and RMSE for large-diameter class sizes in semi-deciduous and evergreen forests (Tab. 2). However, these errors appeared to be smaller in the evergreen forest. Fig. S6 (Supplementary material) shows the distribution of relative errors (in percent) for the diameter measurement methods compared. These were of the order of ± 42% in the semi-deciduous forest (Fig. S6a) and ± 30% in the evergreen forest (Fig. S6b). These relative errors were also low in the evergreen forest. Overall, the percentage error tended to increase with increasing diameter, particularly in the evergreen forest. The results on coefficients of variation (CV) for the differences found between diameter measurement methods are presented in Tab. 3. Overall, our results show that the coefficients of variation for Darea are significantly lower than those for DOPM in both forest types and as a function of diameter class size (Tab. 3). Furthermore, the results of the one-sample Student’s t-test showed no significant difference between measurements of tree diameter above irregularities made using the classic conventional approach and the CRP approach in semi-deciduous forests (t = 42.795, df = 1, p-value = 0.014) and evergreen forests (t = 23.718, df = 1, p-value = 0.026). Similar trends were observed for small-diameter classes in semi-deciduous forest (t = 51.333, df = 1, p-value = 0.012) and evergreen forest (t = 60.435, df = 1, p-value = 0.010), but also for large-diameter classes in semi-deciduous forest (t = 32.344, df = 1, p-value = 0.019). These results indicate the accuracy of diameter measurement with the Darea. However, no significant differences were observed in the size of the large-diameter classes in the evergreen forest (t = 11.204, df = 1, p-value = 0.05). The absence of a significant difference in the coefficient of variation for large-diameter class size in the evergreen forest indicates the accuracy of the measurement approaches used.
Tab. 3 - Coefficient of variation (%) of the diameter of irregular trunk trees in semi-deciduous and evergreen forests. Different letters indicate significant (p<0.05) differences among values after Wilcoxon pairwise test.
| Site | Diameter type |
Coefficient of variation (%) | ||
|---|---|---|---|---|
| All data | D < 70 cm | D > 70 cm | ||
| Semi-deciduous forest | DPOM | 40.51 a | 21.98 a | 30.01 a |
| Darea | 38.66 b | 21.14 b | 28.21 b | |
| Evergreen forest | DPOM | 48.20 a | 28.26 a | 23.31 a |
| Darea | 44.30 b | 27.34 b | 19.49 a | |
Discussion
Factors affecting the difference in diameter measurements above irregularities
Overall, the results show no difference in diameter measurements of trees above irregularities between the classic conventional approach and the Close-Range Photogrammetric approach, except for the size of the large-diameter class in the semi-deciduous forest. These results are comparable to those of Celes et al. ([10]) in South America, who also found no significant difference in diameter between the Close-Range Photogrammetric and conventional approaches. However, significant differences in class size at large diameters in semi-deciduous forests indicate that forest type influences measurement accuracy across the methods used. These differences could be explained by several factors that affect the nature of the differences between measured diameters, including tree size, species-specific characteristics, and individual spacing ([29], [37]). Tree size, divided into two diameter classes, was the main factor studied in this analysis. In addition, the inaccessibility of the point of measurement of diameter could be a factor influencing the nature of diameter differences measured above irregularities. For example, in a semi-deciduous forest, some trees with highly irregular trunks require diameter measurements taken at heights over 6 m, making it difficult to use a tape measure. In this case, it is challenging to stretch the tape around the tree’s transverse perimeter and position it perpendicular to the trunk. These results underscore the importance of accounting for the environmental and morphological constraints specific to each forest type when selecting approaches to measure the diameters of irregular-trunk trees.
The results presented in Fig. 4show a reasonable correspondence between the conventional and Close-Range Photogrammetric approaches for diameter measurement across both forest types and diameter classes. However, the photogrammetric approach tended to underestimate measurements relative to the conventional approach by approximately 7.45 cm in semi-deciduous forest and 2.37 cm in evergreen forest. This difference is mainly attributable to the non-cylindrical shape of the trunk at the point of measurement (Fig. S1 in Supplementary material). Indeed, the tape measure, by hugging the convex envelope of the cross-section, overestimates diameter measurement, particularly in semi-deciduous forests. Conversely, the disc surface derived from the photogrammetric point cloud provides a more faithful estimate of the trunk’s geometric reality, which could explain the relative underestimation observed using this approach. Despite these differences, diameters measured above irregularities show a strong linear relationship (R2 > 0.80) between the two diameter measurement approaches (Tab. S4). However, the intensity of this relationship varies according to forest type: in semi-deciduous forest, the coefficient of determination R2 reaches 0.84, while it is 0.96 in evergreen forest. These variations could be explained by the heterogeneity of tree dimensions within each forest type.
Large-diameter trees affect the accuracy of diameter measurement above irregularities
The results of this study confirm the high accuracy of the Close-Range Photogrammetric approach for measuring the diameters of irregular-trunk trees. However, a bias of 7.45 cm in the semi-deciduous forest and 2.37 cm in the evergreen forest was observed. Analysis of the biases as a function of diameter classes reveals that these deviations are smaller for small diameters, a finding consistent with the observations of Bauwens et al. ([4]) in Central Africa and Celes et al. ([10]) in Amazonia, who reported better accuracy of photogrammetric measurements on small-diameter trees with trunk irregularities.
Measurement accuracy (RMSE) was higher in the evergreen forest than in the semi-deciduous forest (Tab. 2). The results show that the RMSE reached 8.47 cm in the evergreen forest and 16.95 cm in the semi-deciduous forest. These values are higher than those reported by Terryn et al. ([43]), who reported an RMSE of 4.8 cm for diameter measurements above irregularities in Australian tropical forests from TLS across all diameter classes combined. These discrepancies could be explained by differences in forest structure and stand density, which influence the detection of trunk contours and the accuracy of 3D reconstructions. Based on diameter classes, our results indicate that accuracy (RMSE) is higher for small diameters than for large diameters in each forest type (Tab. S2 in Supplementary material), a pattern similar to that reported by Bauwens et al. ([4]) in Central Africa. These results indicate that irregularities on trunks make large trees challenging to model accurately.
In small diameter classes, the Mean Absolute Error (MAE) was less than 2 cm in the evergreen forest. However, relative diameter differences reached 42% in semi-deciduous forest and 30% in evergreen forest, comparable to the results of Celes et al. ([10]), who observed similar variations in Amazonian forests due to the morphological complexity of irregular trunks. Analysis of measurement differences using the Bland-Altman graphical method ([6], [20]) revealed perfect agreement between the two measurement methods at the threshold of 7.45 cm and 2.37 cm in semi-deciduous and evergreen forests, respectively. These results are in line with the work of Borz et al. ([7]) in Eastern Europe, who also demonstrated good agreement between these measurement methods. It should be noted that the linear regression and agreement assessment techniques are neither superimposable nor redundant; rather, they are complementary and serve different purposes ([25]). While correlation between two measurement methods indicates an association, agreement requires the regression line to be as close as possible to the equivalence (1:1) line (Fig. 5).
Many taper models for irregular stem trees rely exclusively on the diameter above to predict the diameter at 1.30 m from the ground in the tropics ([5], [13]). Overall, the results show that the coefficients of variation obtained from the Close-Range Photogrammetric approach are lower than those from the classic conventional approach, indicating that the former approach can provide reasonable results with less bias in taper models predicting diameter at 1.30 m above ground. In addition, the Close-Range Photogrammetric approach has the advantage of automatically recording measurements in an online database, saving technicians time in data entry and avoiding transcription errors ([1]).
Research limitations
The Close-Range Photogrammetric approach has been applied in forest research sites in the tropics. These forest sites have closed canopies and dense understories, creating challenging conditions for detecting point clouds in images acquired during photogrammetric processing. In addition to dense understory and closed canopies, point cloud detection on acquired images is also affected by conditions such as fog/haze and low sunlight angles. These different environmental conditions limit the height of the model reconstituted in three dimensions (3D), as shown in Fig. 2. To solve the problem of limiting the height of the 3D model, it is advisable to photograph the trees very early in the morning or late in the day and take the images at two different heights (view height and 4 m high at using a milestone) in central Africa ([4]) or at three different heights (2 m, 3 m and 5 m) in Europe ([35]). Future studies should consider these tips to improve the photogrammetric process for irregular-trunk trees in tropical forests.
Conclusions
This study demonstrates that the Close-Range Photogrammetric approach is an accurate and suitable method for measuring the diameters of irregular-trunk trees in tropical forests. The results show a strong correlation between measurements obtained using this approach and those obtained with the conventional approach, with relatively minor differences, particularly in evergreen forests. The Close-Range Photogrammetric approach thus offers an effective alternative to overcome the limitations of classic dendrometric tools, particularly when the diameter measurement point is difficult to access.
Because of its accuracy and its ability to reduce errors associated with conventional measurements, this method could be incorporated into forest inventories and allometric models to improve estimates of biomass and volume for irregular trees. However, further studies are needed to explore the limitations of this approach across different environmental conditions and to refine its use in operational contexts of forest management and the conservation of tropical ecosystems.
List of abbreviations
MAE: Mean Absolute Error, RMSE: Root Mean Square Error, TLS: Terrestrial Laser Scanning, CRP: Close-Range Photogrammetry, SfM: Structure from Motion, Semi-F: semi-deciduous forests, Ever-F: evergreen forests, MVS: Multi-View Stereo, POM: Point of Measurement.
Acknowledgements
The two authors designed the project and the methodology, and organised the field data collection mission; MMNB collected the field data, reconstructed the trees in 3D in the laboratory, and carried out the statistical analyses; MMNB and JJL drafted the manuscript. JJL supervised the entire project. The two authors contributed critically to the drafting and gave their final approval for publication.
MMNB was supported by a grant from the International Science Foundation (grant no. I-1-D-6295-1), the Conservation Action Research Network (2020), the “Eugen Ionescu” PhD grant from the Agence Universitaire de la Francophonie of the Romanian government, and the IRD South - South mobility grant. This study was also supported by the DynAfFor project.
References
Gscholar
CrossRef | Gscholar
CrossRef | Gscholar
Gscholar
Gscholar
Gscholar
Gscholar
Authors’ Info
Authors’ Affiliation
Jean Joël Loumeto 0000-0002-0883-1568
Laboratory for Biodiversity, Ecosystem and Environment Management (LBGE), Faculty of Science and Technology, Marien Ngouabi University, B.P. 69, Brazzaville (Republic of Congo)
Corresponding author
Paper Info
Citation
Nguila Bakala MM, Loumeto JJ (2025). Improving tree diameter measurements above irregularities in Central African forests: a Close-Range Photogrammetric approach. iForest 18: 382-390. - doi: 10.3832/ifor4685-018
Academic Editor
Andrea Cutini
Paper history
Received: Jul 08, 2024
Accepted: Jun 06, 2025
First online: Dec 16, 2025
Publication Date: Dec 31, 2025
Publication Time: 6.43 months
Copyright Information
© SISEF - The Italian Society of Silviculture and Forest Ecology 2025
Open Access
This article is distributed under the terms of the Creative Commons Attribution-Non Commercial 4.0 International (https://creativecommons.org/licenses/by-nc/4.0/), which permits unrestricted use, distribution, and reproduction in any medium, provided you give appropriate credit to the original author(s) and the source, provide a link to the Creative Commons license, and indicate if changes were made.

Web Metrics
Breakdown by View Type
Article Usage
Total Article Views: 2323
(from publication date up to now)
Breakdown by View Type
HTML Page Views: 1060
Abstract Page Views: 695
PDF Downloads: 509
Citation/Reference Downloads: 0
XML Downloads: 59
Web Metrics
Days since publication: 148
Overall contacts: 2323
Avg. contacts per week: 109.87
Article Citations
Article citations are based on data periodically collected from the Clarivate Web of Science web site
(last update: Mar 2025)
(No citations were found up to date. Please come back later)
Publication Metrics
by Dimensions ©
Articles citing this article
List of the papers citing this article based on CrossRef Cited-by.
Related Contents
iForest Similar Articles
Research Articles
Accuracy assessment of different photogrammetric software for processing data from low-cost UAV platforms in forest conditions
vol. 12, pp. 435-441 (online: 01 September 2019)
Research Articles
Comparison of parametric and nonparametric methods for modeling height-diameter relationships
vol. 10, pp. 1-8 (online: 19 October 2016)
Research Articles
A rapid method for estimating the median diameter of the stem profile of Norway spruce (Picea abies Karst) trees
vol. 10, pp. 328-333 (online: 11 February 2017)
Research Articles
On the geometry and allometry of big-buttressed trees - a challenge for forest monitoring: new insights from 3D-modeling with terrestrial laser scanning
vol. 8, pp. 574-581 (online: 02 March 2015)
Research Articles
Is it needed to integrate mixture degree in Stand Density Management Diagram (SDMD)?
vol. 16, pp. 274-281 (online: 28 October 2023)
Research Articles
Modelling diameter distribution of Tetraclinis articulata in Tunisia using normal and Weibull distributions with parameters depending on stand variables
vol. 9, pp. 702-709 (online: 17 May 2016)
Research Articles
Diameter growth prediction for individual Pinus occidentalis Sw. trees
vol. 6, pp. 209-216 (online: 27 May 2013)
Research Articles
The effect of the calculation method, plot size, and stand density on the accuracy of top height estimation in Norway spruce stands
vol. 10, pp. 498-505 (online: 12 April 2017)
Research Articles
Determination of differences in temperature regimes on healthy and bark-beetle colonised spruce trees using a handheld thermal camera
vol. 14, pp. 203-211 (online: 02 May 2021)
Research Articles
Alternative methods of scaling Eucalyptus urophylla trees in forest stands: compatibility and accuracy of volume equations
vol. 11, pp. 275-283 (online: 29 March 2018)
iForest Database Search
Search By Author
Search By Keyword
Google Scholar Search
Citing Articles
Search By Author
Search By Keywords
PubMed Search
Search By Author
Search By Keyword


