Changes in forest diversity over a chronosequence of fluvial islands
iForest - Biogeosciences and Forestry, Volume 12, Issue 3, Pages 306-316 (2019)
doi: https://doi.org/10.3832/ifor2737-012
Published: Jun 06, 2019 - Copyright © 2019 SISEF
Research Articles
Abstract
The high environmental heterogeneity of large fluvial systems is reflected by the co-existence of contrasting plant communities and landforms. The main objective of this study was to assess the forest diversity changes in islands of the Middle Paraná River (Argentina) in order to discuss an integrative question: how synchronized are the major changes in the features of islands and forests? Persistence age, elevation and flood regime of 11 main channel islands were determined. Variables related to the vascular plant community and the tree stand structure of forests were also measured in 400 m2 plots. Islands were classified as young or old (YIs or OIs), according to their persistence age, which ranged from two to 108 years. Both island classes differed in their elevation but not in the proportion of low water phase. Only three out of nine tree species were dominant: Tessaria integrifolia and Croton urucurana (restricted to YIs and OIs, respectively), and Salix humboldtiana (distributed in both island classes). Alpha diversity was positively correlated with the age of the YIs and reach the highest value in the oldest island forest. Beta diversity was mainly due to processes of species replacement which differentiate floodplain forests. Gamma diversity reached 101 species, being the perennial herbs a clear majority. The stand structure and the complete floristic composition were significantly different between YIs and OIs, with three and seven indicator species of each island class, respectively. Considering integrative models of succession, our findings suggest that the biogeomorphic phase, recognised by the fluvial biogeomorphic model, prevailed in the whole range of island persistence ages. Therefore, it seems that the increase in forest diversity in a large river is restricted to spatial refugia defined by major hydrogeomorphic shifts.
Keywords
Middle Paraná River, Fluvial Biogeomorphic Succession, Vegetation Dynamics, Environmental Heterogeneity, Sand Bars, Hydrogeomorphic Dynamics
Introduction
An emergent property that identifies the large fluvial systems of the planet is the high environmental heterogeneity which is a consequence of the interaction of geomorphological, hydrological and biological organization levels ([49], [53]), besides the increasing influence of anthropogenic factors ([47]). This heterogeneity determines that their floodplains present a mosaic where landforms contrast in age and formation processes, and where plant communities of very variable diversity currently co-exist in similar hydro-sedimentological regimes ([25], [38], [26], [21]). Therefore, the study of vegetation dynamics or plant successions needs to be addressed in the context of other temporal phenomena, e.g., landforms development ([16]).
An integrative conceptual model known as fluvial biogeomorphic succession has recently been proposed for fluvial and coastal systems ([10]). It comprises four succession stages - geomorphic, pioneer, biogeomorphic and ecological - through which the purely physical, abiotic control over vegetation dynamics tends to decrease, while purely biotic control tends to increase ([10]). Although this scheme has mainly been applied in low discharge rivers, its predictions fit with the observations made in forests of large rivers ([22], [54]).
The Paraná River forms the fourth largest hydrographic basin, in terms of its drainage area, only preceded in South America by the Amazon basin ([26]). The floodplain forests of the Middle Reach of the river are of particular interest as they participate in the consolidation of different types of bars and are helpful for mapping landforms ([42]). They provide elements of roughness that affect flood waves ([38]) as well as the habitat for many wildlife biotas ([4]). All these functions are closely related to the floristic diversity of these forests, which is highly variable in spatio-temporal terms ([29]). However, there is little knowledge about their dynamics in relation to the fluvial context, not only in islands of the Middle Paraná River main channel but also in the whole floodplain. Only two studies have proposed schemes of successional pathways for the forests of the Middle Paraná River ([33], [27]), in which the role of hydrogeomorphic dynamics in geomorphologic and hydro-sedimentologic terms has been barely considered, or even discussed so far, as the authors suggest.
In accordance with the above-mentioned context, the specific objectives of the present study were: (1) to determine the persistence age, current elevation and flood regime of the oldest bar of main channel islands; (2) to measure the forest diversity sensu lato (in terms of composition, abundance and tree stand structure) of the vascular plant community (woody and herbaceous species) placed in the abovementioned landforms. These objectives attempt to answer the following questions: (i) what is the relationship between the island persistence ages and the forest alpha diversity? (ii) is there any temporal trend in the shifts of composition or stand structure? (iii - as an integrative question) how synchronized are the major changes in the features of islands and forests?
Methods
Study area
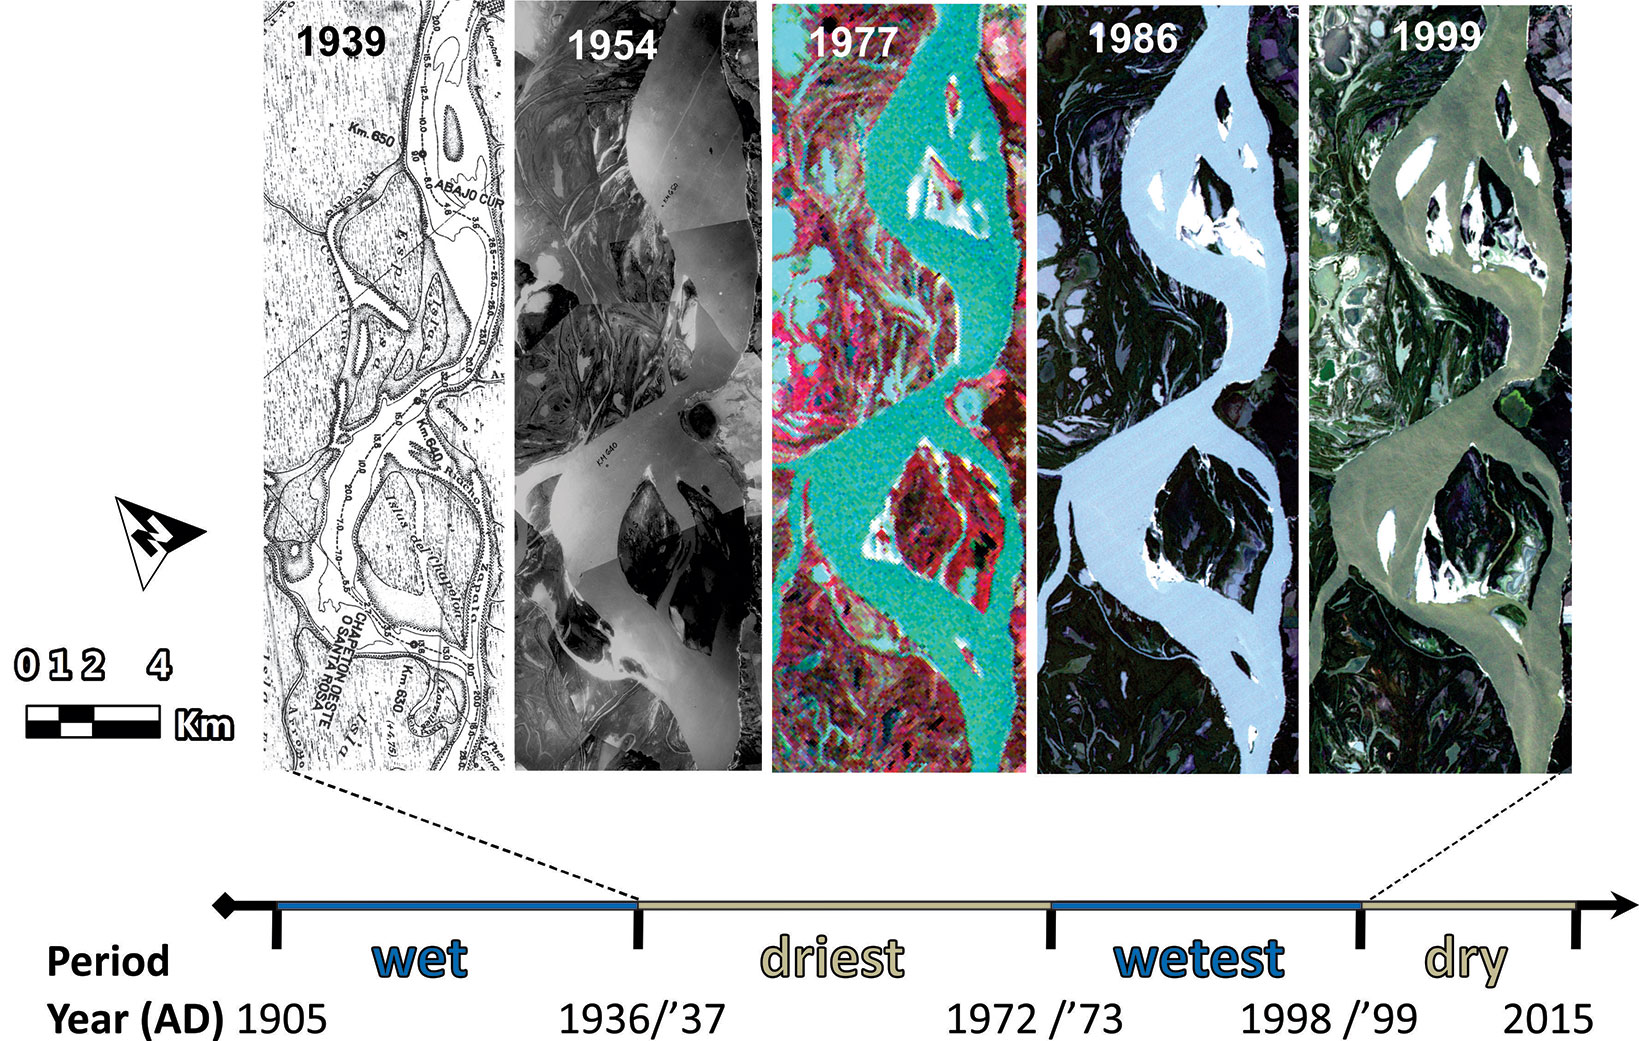
The study area is delimited in a reach of the main channel of the Middle Paraná River floodplain (Fig. 1), which presents an anabranching channel pattern ([26]). This floodplain extends approximately from the city of Corrientes (27° 28′ S) to Rosario (32° 57′ S), Argentina (Fig. 1b); it has an area of about 18.000 km2, an average width of 30 km, and a total length of the main channel of about 700 km ([42]). The climate is humid subtropical; average monthly temperatures range from 12 °C in July to 25 °C in January, and rainfall accumulates 1027 mm a year, with a minimum of 29 mm in July and a maximum of 156 mm in March (data from the 1934-2014 series, at the Paraná station of INTA - Instituto Nacional de Tecnología Agropecuaria). The current modelling of the floodplain is due to an asymmetrical distribution of solid and water discharges from the Bermejo River and the Upper Paraná River, respectively, NW and NE of the basin ([1]). The average annual discharge of water in the Middle Paraná River, at the beginning of the reach, is 17,000 m3 s-1. However, there were major discharge variations over the last century (Fig. 2), which determined: two “wet periods”, 1904-36 and 1973-98, of high hydrological activity (i.e., a high frequency of floods greater than 30,000 m3 s-1), and another two “dry periods” 1937-72 and 1999-2015, of low hydrological activity ([42]).
Fig. 1 - Study area. (a) Paraná River Basin in South America. (b) Middle Paraná River floodplain (area in red) and its main tributaries. (c) The studied islands, located within a reach of two enlargements, inside the geomorphic unit of “islands and bars of the main channel” (red dash lines), in the context of the Middle Paraná River floodplain.
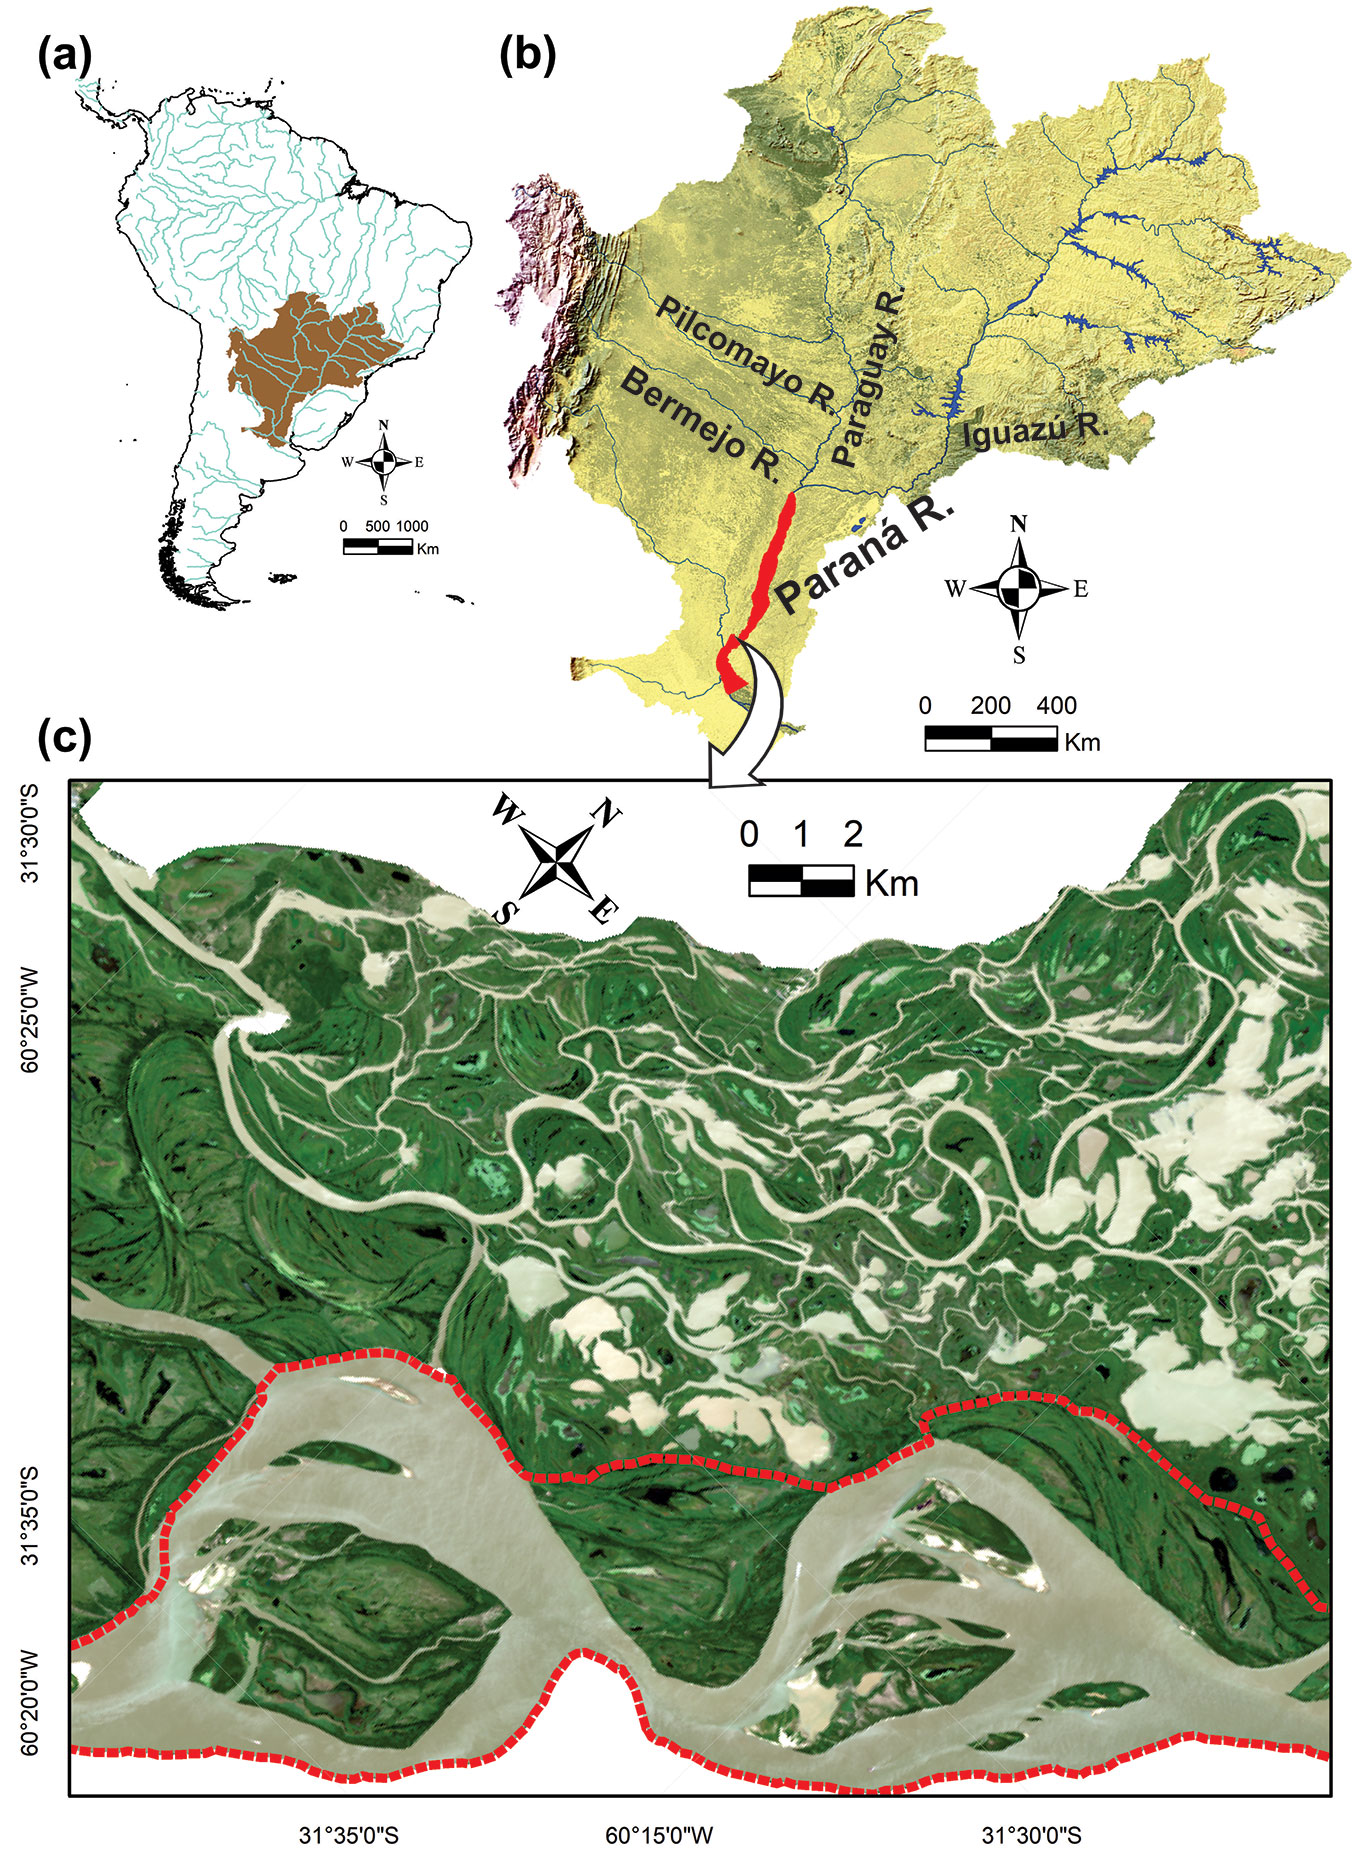
Fig. 2 - Periods of contrasting discharge regimes of the Paraná River, from 1905 to the sampling year of this study. Geomorphologic changes of the studied islands across a temporal window are showed (sources from left to right: navigation chart, aerial photo mosaic, Landsat 2 MSS, Landsat 4 TM and Landsat 5 TM; for more details, see Tab. S1 in Supplementary material).
The group of 11 studied islands belongs to the geomorphic unit of “islands and bars of the main channel”, which has a high turnover (60% of its islands is less than 70 years old since its formation) and a large elevation variability that includes the highest sites in the whole Middle Paraná River floodplain ([42]). This group of islands is representative of the total number of islands in the main channel of the Middle Paraná, due to their great contrasts in terms of their age and because they were formed from central bars or from emerging bars linked to the migration of the thalweg ([42]). In addition, it is noteworthy to report that the main channel islands of the Middle reach have a relative low anthropogenic disturbance in contrast to the islands of the Upper reach and the Delta, which has been influenced by dams, deforestation, tree plantations and/or urbanization ([7], [23]). Thus, the islands of the present study have high research value, as they could serve as a “natural laboratory”, both to study processes where human influence is not addressed (e.g., the present study) and for comparisons with other rivers of the Paraná basin with greater intensity of anthropic disturbances.
Persistence age of the islands
Through a multi-temporal analysis, the oldest bar of each island (i.e., the oldest current landform in an island) was delimited (Fig. 3). Then, the age of islands was estimated (in years) as the time between the sampling year (2015) and the year in which the oldest bar was colonised by plants. The persistence of each oldest bar, from its colonisation to the sampling, was verified ([47]). The six complementary sources of information used were: historical cartography (1847-1972) and aerial photographs (1954-1984) surveyed mainly by State agencies from Argentina; Landsat MSS, TM, and OLI satellite imagery (1972-2015); and the DigitalGlobe© (2002-2015) and Landsat/Copernicus (1984-2015) imagery mosaics in Google Earth Pro™ and Google Earth Engine™ (see Tab. S1 in Supplementary materials for further details). Within the oldest bar area of each island, a set of potential sampling units were georeferenced (considering the current presence of forests, the accessibility to sample them and the maximum distance from signals of human influence). Then, only one of those units was randomly sampled in the field.
Fig. 3 - Island ages and location of the sampling units within the oldest bar area (Image source: Landsat OLI; date: 2014-01-15; water level at Paraná city gauge station: 2.43 m). The island persistence ages are displayed both at the side of each oldest bar and in a timeline, which includes the sampling year.
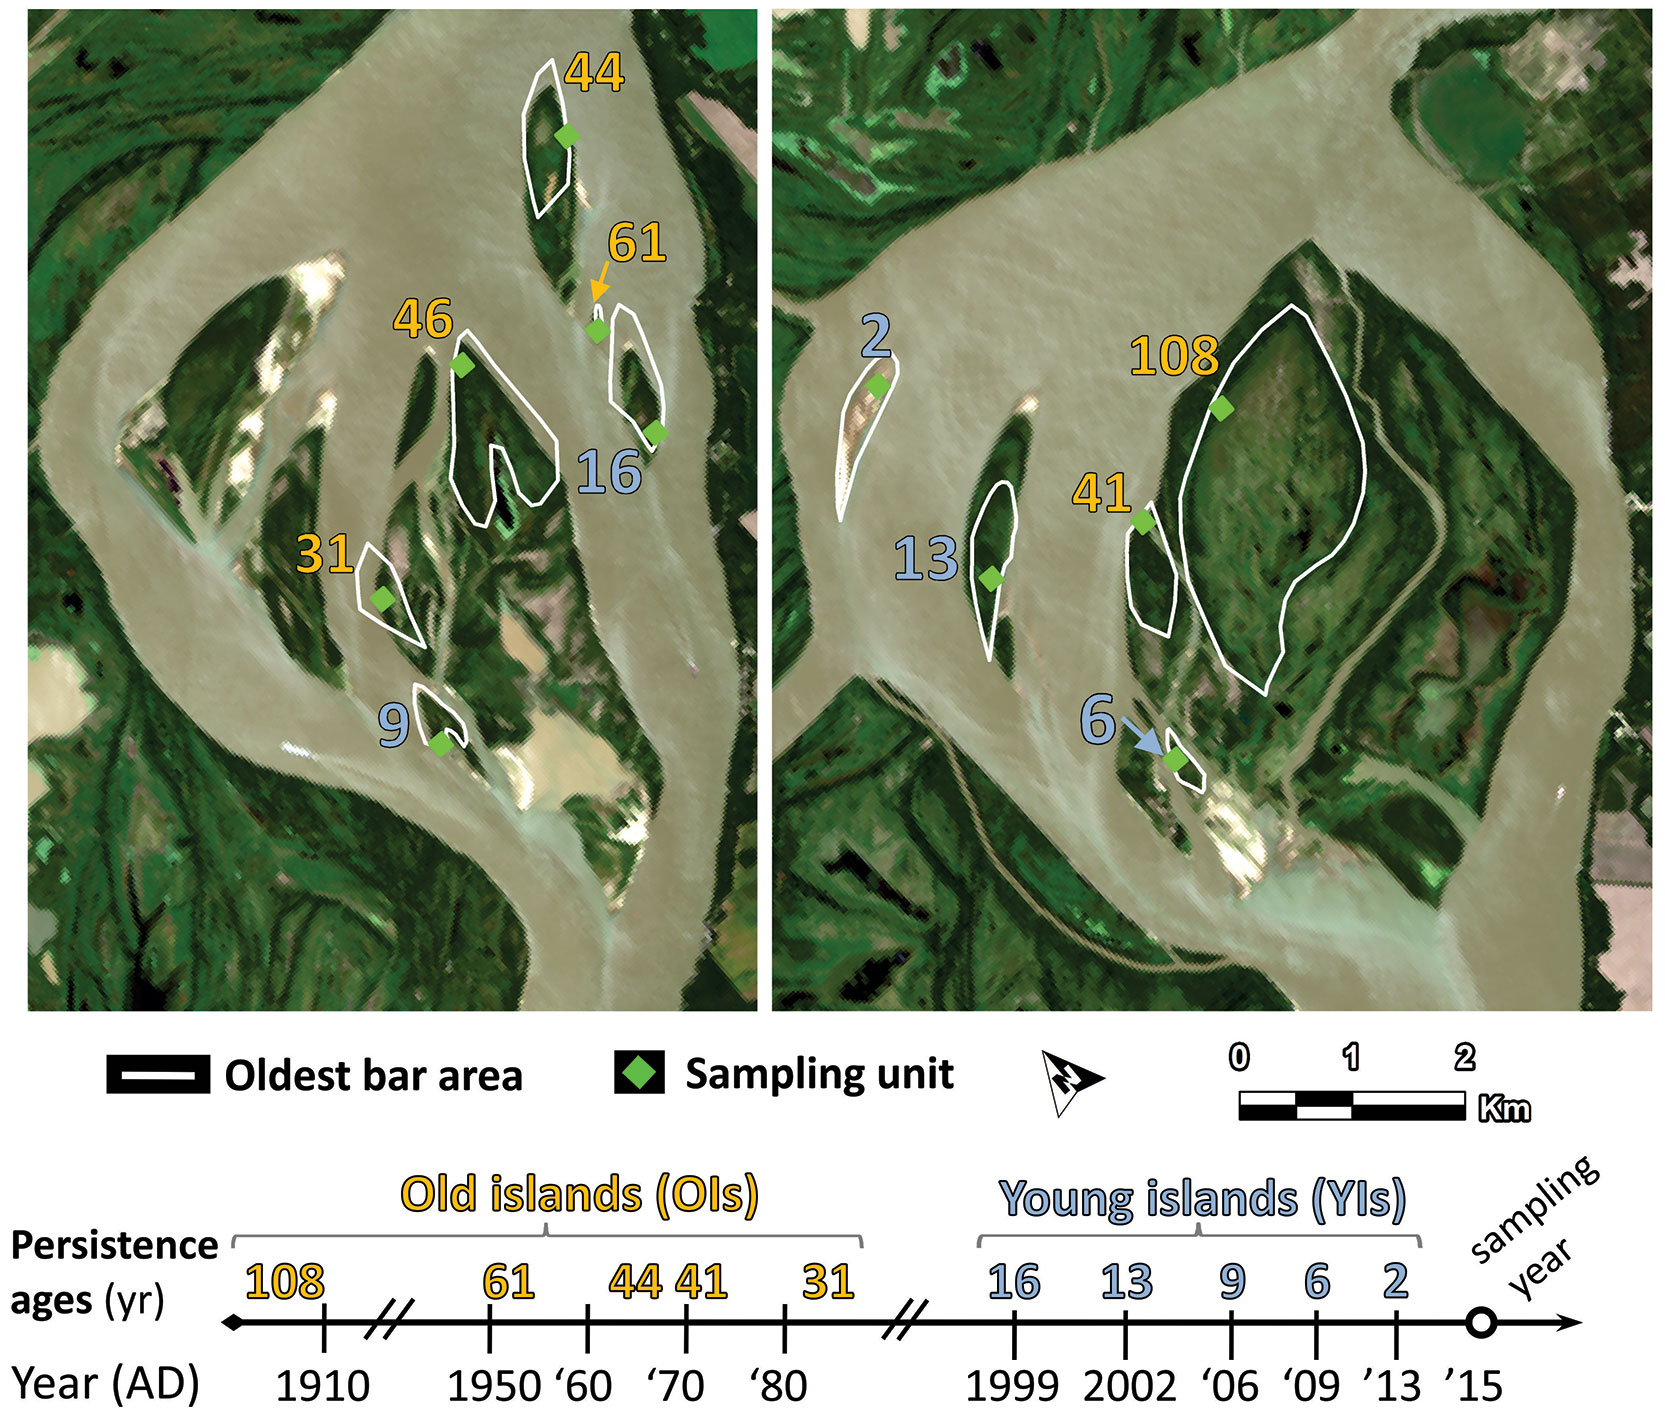
After its determination, persistence age has been treated as a continuous (chronological) explanatory variable, and classified into two discrete classes (according to the period in which the islands were formed): (i) old islands (OIs), formed before 1998, i.e., subject to the influence of at least one wet period, with high frequency of large discharges, and at least one extraordinary flood; (ii) young islands (YIs), formed during the dry period of 1999-2015 and consequently free from the influence of the OIs (in terms of both effective discharge and duration of floods).
Elevation and flood regime
The current elevation of each oldest bar was characterized by measuring ten points by means of geometric levelling, using the level of the water surface as a reference. The value of such reference was calculated as the sum of the hydrometric height of the river, on the day of sampling (measured at the gauge station of Paraná city), and the increase in the hydraulic slope. In turn, this increase was obtained from the route product (i.e., the distance from the sampling unit to the gauge station), and a 4.6 cm km-1 hydraulic slope ([51]). The series of daily water levels from 1907 to 2015 (>39.000 records) were obtained from the CIM database (Centro de Informaciones Meteorológicas at FICH-UNL).
The flood regime throughout the history of each oldest bar was analysed with an ad-hoc proxy: the “historic overflow level”. It was obtained as the average between the minimum elevation (measured in the field) and a constant of two meters (above the zero measured at Paraná city gauge). This constant is the approximate elevation in which a bar is colonised by vegetation for the first time. The mentioned proxy was used because the sedimentation rate is not fully known yet. Thus, the precise reconstruction of the flood regime is not possible since vertical accretion tends to increase over time. The relationship between hydrometric levels and elevation was analysed with the Pulso software ([35]).
Forest sampling
Each oldest bar area was sampled with a single unit (Fig. 3), employing an equivalent sampling effort, seeking the homogeneity of the forest community and avoiding forests with signs of human-driven disturbances (e.g., high density of cattle manure or fire scars on trees). The methods corresponded to those classically used in vegetation studies ([34]). The sampling unit was a plot with an area of 20 × 20 m, where the following variables were measured: cover-abundance (C-A) by species of all vascular plants; coverage and maximum height of each forest strata; diameter at breast height (1.3 m above the ground, DBH) by species from the occurring trees, which also resulted in an absolute density per tree species. In high-density forests (>5,000 trees ha-1), DBH and density were measured in subplots within the sampling unit (minimum of 5 m2 - [13]). The frequency of all species was calculated based on the presence of each species in four subplots (10 × 10 m) inside the plot, with the purpose of not overestimate the presence of rare species in the whole plot.
Data analysis of forests
The botanical determination was based on several botanical sources (additional information are reported in Appendix 1 - Supplementary material). Systematics and nomenclature followed the criteria of the South America Southern Cone Flora list ([56]); the same list was used to assign life-forms to the species, except for obligated aquatic herbs based on the list developed by Neiff ([37]).
The floristic analyses were approached through the alpha, beta and gamma diversities ([15]) and multivariate techniques ([31]). Alpha diversity (based on the cover-abundance of each species) was calculated in effective numbers of species, or Hill numbers (considering three q-orders: q=0, q=1, and q=2, which indicate an increasing sensitivity to the relative importance of each species), and diversity profiles were made for the forest of each site ([18], [15]). Beta diversity was considered as the variation between forests that may be due to two phenomena: species replacement and dissimilarity by nesting ([2]). The Sørensen dissimilarity index modified by Baselga ([2]) was used between pairs of forests (corresponding to pairs of islands in the chronological series of their ages), and between multiple forests (according to the OI and YI island classes). Gamma diversity was considered broadly as the species richness recorded in the forests of the main channel islands of the Middle Paraná River. Likewise, nonparametric richness estimators based on incidence were used to construct species accumulation curves ([15]).
Through an MRPP (Multi-Response Permutation Procedures), the differences between the island classes were evaluated considering three sets of forest attributes (tree stand structure, plant diversity, and total floristic composition). The distance matrices were constructed using the Bray-Curtis index (recommended for quantitative data - [31]) and subjected to 4,999 permutations. The MRPP was complemented with a Species Indicator Analysis (SIA), which is used to contrast the performance of individual species through two or more groups of sampling units ([50]). The SIA calculates an indicator value (IV) for each species based on their cover-abundance and frequency. The statistical significance of the IV was assessed using a Montecarlo test with 4,999 permutations.
The statistical hypothesis tests were carried out by nonparametric methods: an exact Wilcoxon-Mann-Whitney test for the difference between medians in relation to the island classes, and Spearman’s tests to prove the correlation between quantitative variables. All the hypothesis tests considered a level of significance α=0.05. Statistical analyses were performed in R language ([44]), using R Studio, with the packages: “coin” ([19]), iNEXT ([20]), “vegan” ([39]) and “betapart” ([3]); further details are available in Appendix 2 (Supplementary material). The GUI software Pc-Ord ([32]) was used in the MRPP and the SIA.
To interpret the changes in diversity along the chronology of islands as successional changes, the chronosequence approach, already used in floodplains ([24], [9]) was considered as accurate mainly due to two reasons. First, in temporal terms, this study was restricted to sites with a maximum of 100 years, which is considered an adequate temporal window ([52]). Secondly, in spatial terms, the sites correspond to only one type of landform (a sand bar), which belongs to a single geomorphic unit, thus the geomorphic complexity is simplified as much as possible ([42]).
Results
Persistence age of fluvial islands in the river context
Due to the persistence of plants on the oldest bar, the 11 islands were assigned ages of formation that cover a continuous timeline from two to 108 years (Fig. 3). These 11 islands, in turn, could be grouped into two discrete classes: five young islands (YI) and six old islands (OI - Fig. 3).
The YIs were between two and 16 years old and were formed from central bars or accretion bars downstream of pre-existing islands. Over the last decade, they have experienced a dissimilar growth (from zero to double their original size) in different directions. Currently, these islands were composed of 3 landforms on average and 5 in total, mostly bars that were assembled to the oldest bar at different times and directions (by lateral, downstream or upstream accretion) and exceptionally separated by backswamps.
On the other hand, the OIs covered ages ranging from 31 to 108 years old and arose from central bars or accretion bars near the flanks of pre-existing islands. The growth of each OI has had high variability but it has been much less accentuated than in the YI over the last decade. In addition to age, the biggest difference between OIs and YIs is their current composition of landforms, e.g., levees, crevasse splay, and paleo-channels. The OIs gather 6 landforms on average and a total of 15 landforms (almost all of the landforms mapped for the entire geomorphic unit of the main channel of the Middle Paraná River).
The OIs surpassed the YIs significantly in the median of their elevation (Z = 8.68; P = 2.2 · 10-6). The elevations showed a significant linear correlation with the persistence age of islands (rs = 0.73, P = 4.4 · 10-19 - Fig. 4a).
Fig. 4 - Islands elevation and water level fluctuations. (a) Box plots of the island elevation over the chronologic series of islands (left) and by island classes (right). (b). Water level variations of the Paraná River and the historic overflow level (see Methods) of the Old (left) and the Young Islands (right). The y-axis is relative to the hydrometer of the Paraná city gauge station.
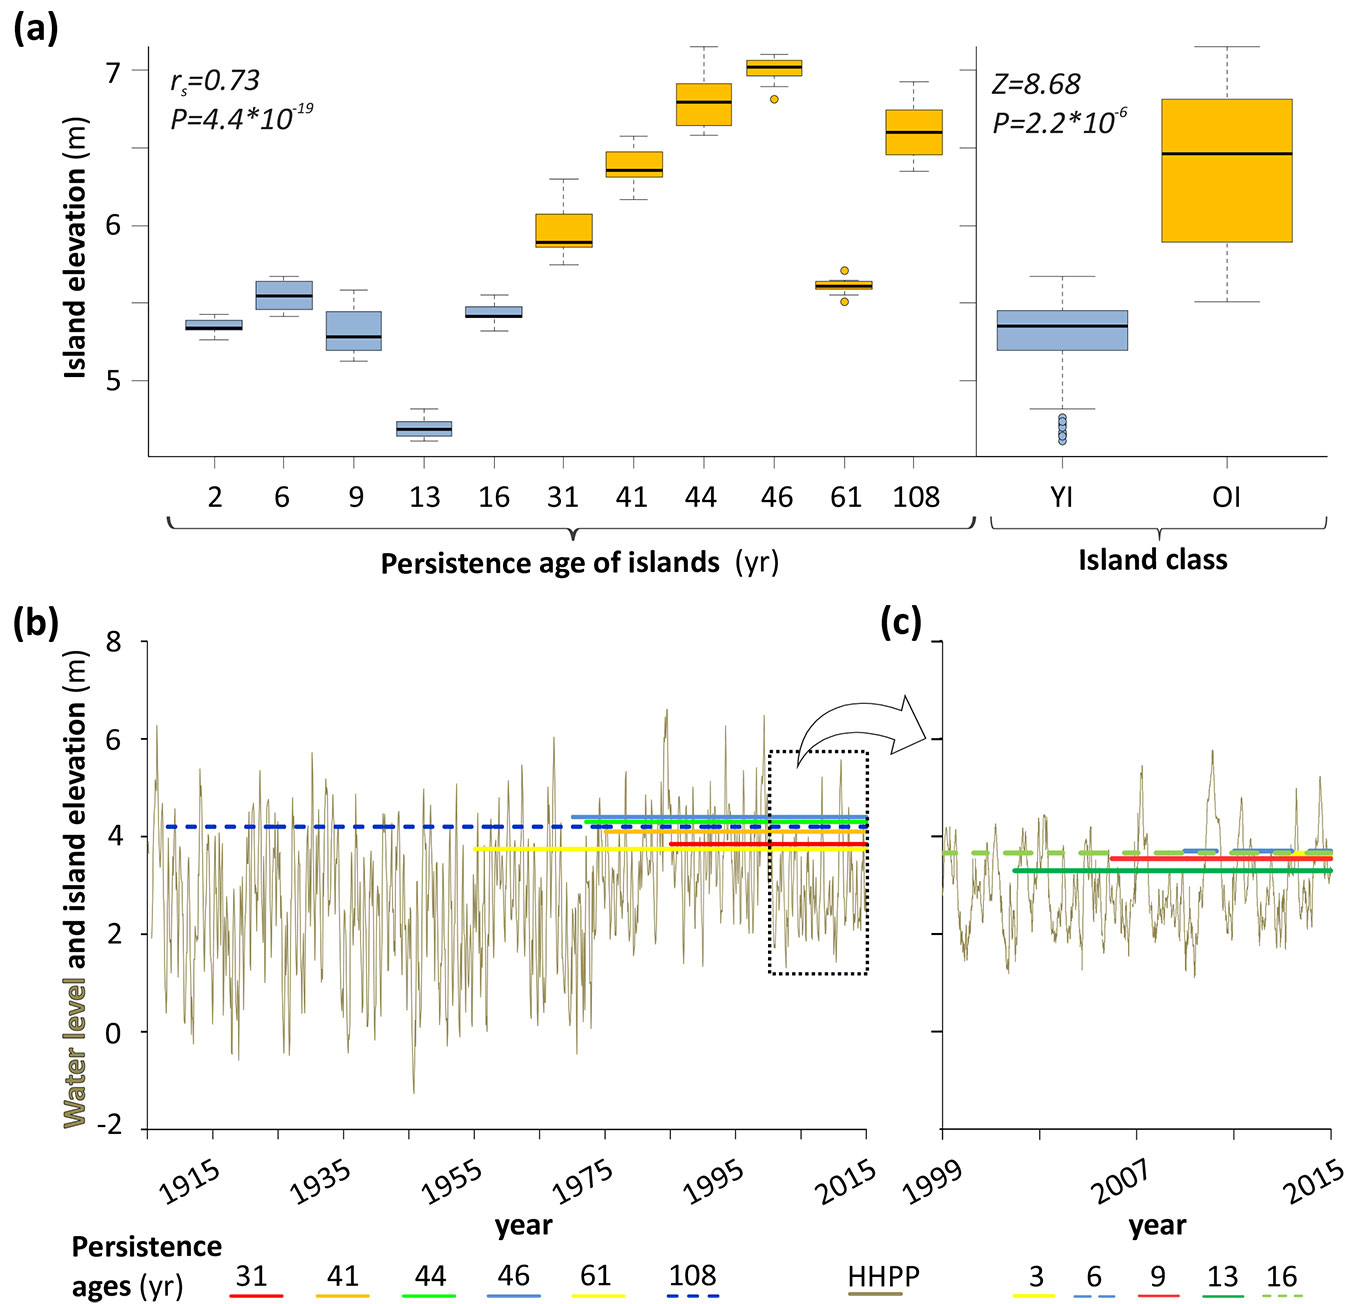
Fig. 4b shows a limnigram for the last 108 years with the historic overflow levels of each one of the 11 sites. In the OIs, those levels range from 3.8 to 4.4 m above the zero of the Paraná gauge station (Fig. 4b). At such elevation and ages, all the islands have been exposed to the extraordinary floods of the last wet period of 1973-1998, with durations of up to 15 months above 4 m (bankfull stage). Although in the YIs the levels of overflow were somewhat lower (3.3 to 3.7 m), they have all appeared during the dry period from 1999 to the sampling year (Fig. 4b), for which they have only been modelled by ordinary floods.
The overflow levels of each site allowed obtaining some attributes that characterize in general terms the influence of flood and low water phases on each class of islands. The low water phase influenced the vast majority of island history with 72% in the YIs and 81% in the OIs. In contrast, the average duration of flood phase was more elevated in YIs than in OIs (85 vs. 76 days, respectively). However, the OI floods were of much greater intensity (higher flood peaks), with maximums exceeding the YIs up to 1 meter in terms of the water level.
Diversity of the oldest bar forests in relation to the island features
Gamma-diversity, life-forms, and frequencies
In the 11 forests studied, 101 species of vascular plants were recorded, being the majority concentrated in four orders and six families (a full checklist is given in Tab. S3 - Supplementary material). Perennial herbs (38% of the species pool) were the best-represented way of plant life-forms, whereas the trees, climbers, annual herbs, and aquatic herbs reached less than 25% of the total biotic spectrum. In the chronological series, there was a slight tendency to decrease in the proportion of aquatic herbs and to increase in annuals herbs. Grouped according to persistence age ranges (YI and OI), these differences were even more pronounced in annual and aquatic herbs (an 8% and 12% gap in YIs and OIs, respectively), whereas the proportion of climbers and trees remained almost constant (a 1% gap in both cases), and showed no linear trends in the chronological series (Fig. S1 in Supplementary material).
Regarding frequencies, only one species, Salix humboldtiana “Humboldt Willow”, exceeded 80% while 71 species were rare since they did not reach 20%. The vast majority of these species were restricted to YIs (29 out of 30 in total, e.g., the aquatic grass Louisiella elephantipes), or to OIs (27 out of 34 in total, e.g., the annual herb Ageratum conyzoides). Furthermore, the two classes of islands were characterized by the exclusivity of a dominant tree species: Tessaria integrifolia “River Alder” in YIs and Croton urucurana “Dragon’s Blood” in OIs. On the other hand, the remaining 37 species were not only common (often more than 20%) but they also became dominant in almost half of the cases, e.g., the perennial herbs Teucrium vesicarium and Steinchisma laxa, including the willows themselves.
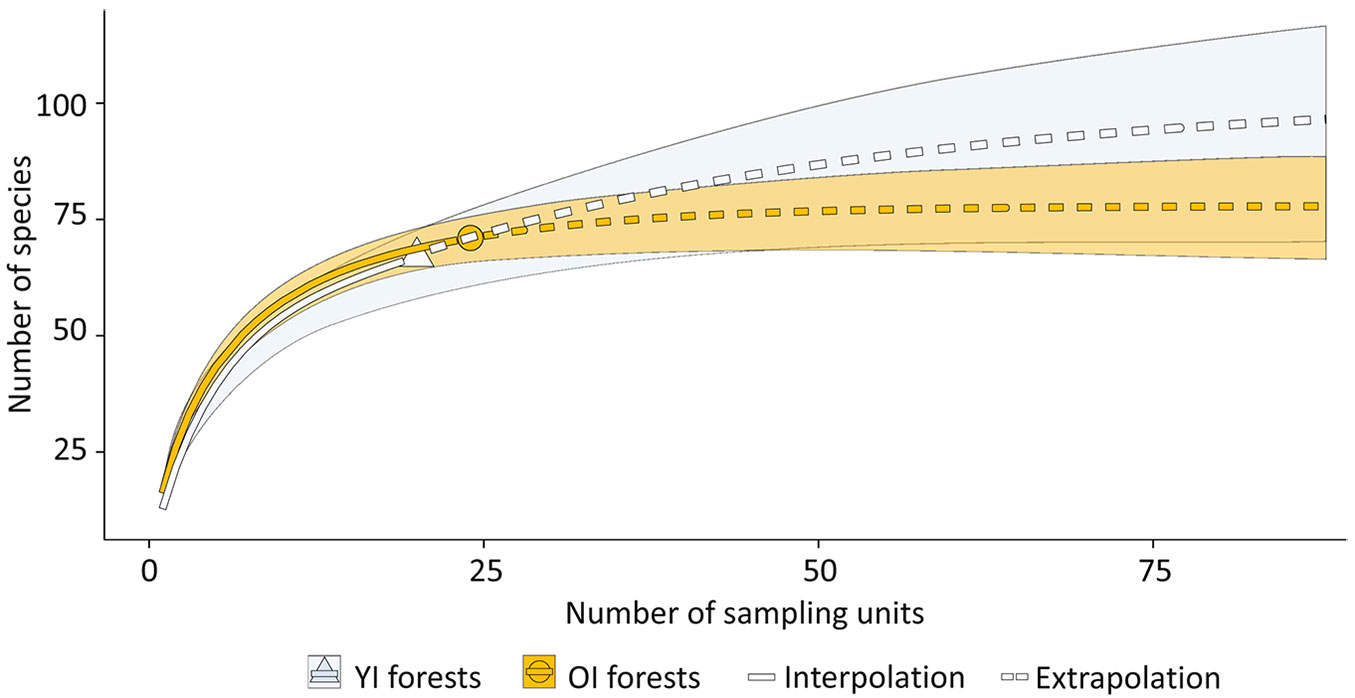
The species richness extrapolation curves in YIs and OIs showed two different behaviours (Fig. 5). The YIs curve seems to stabilize very far from its observed value, whereas the OIs observed value was very close to the stabilization of the curve.
Fig. 5 - Species richness (alpha diversity, q=0) extrapolation curves for the Old (OI) and the Young Islands (YI). The shadow area represents a 95% confidence interval based on 999 permutations for each curve.
Alpha and beta diversity
Alpha diversity presented differences in relation to the extreme ages of the islands (Fig. 6a). As a whole, the forest of the oldest island is the most diverse since it is the only profile that is not intercepted by another in any q-order. On the contrary, the forest of the youngest island is the most unequal or with minimum equitability sensu lato, given the shape of its profile. In the remaining diversity profiles, the shape is similar between those of the OIs and differs between those of the YIs, which could indicate greater and lesser stability, respectively.
Fig. 6 - Alpha diversity of forests. (a) Alpha diversity profiles of Young (left) and Old Island forests (right); the value of the q-order indicates an increasing sensitivity to the relative importance of each species. (b) Alpha diversity over the chronologic series of Young and Old Island forests; cases with a strong linear correlation (rs > 0.7) are highlighted.
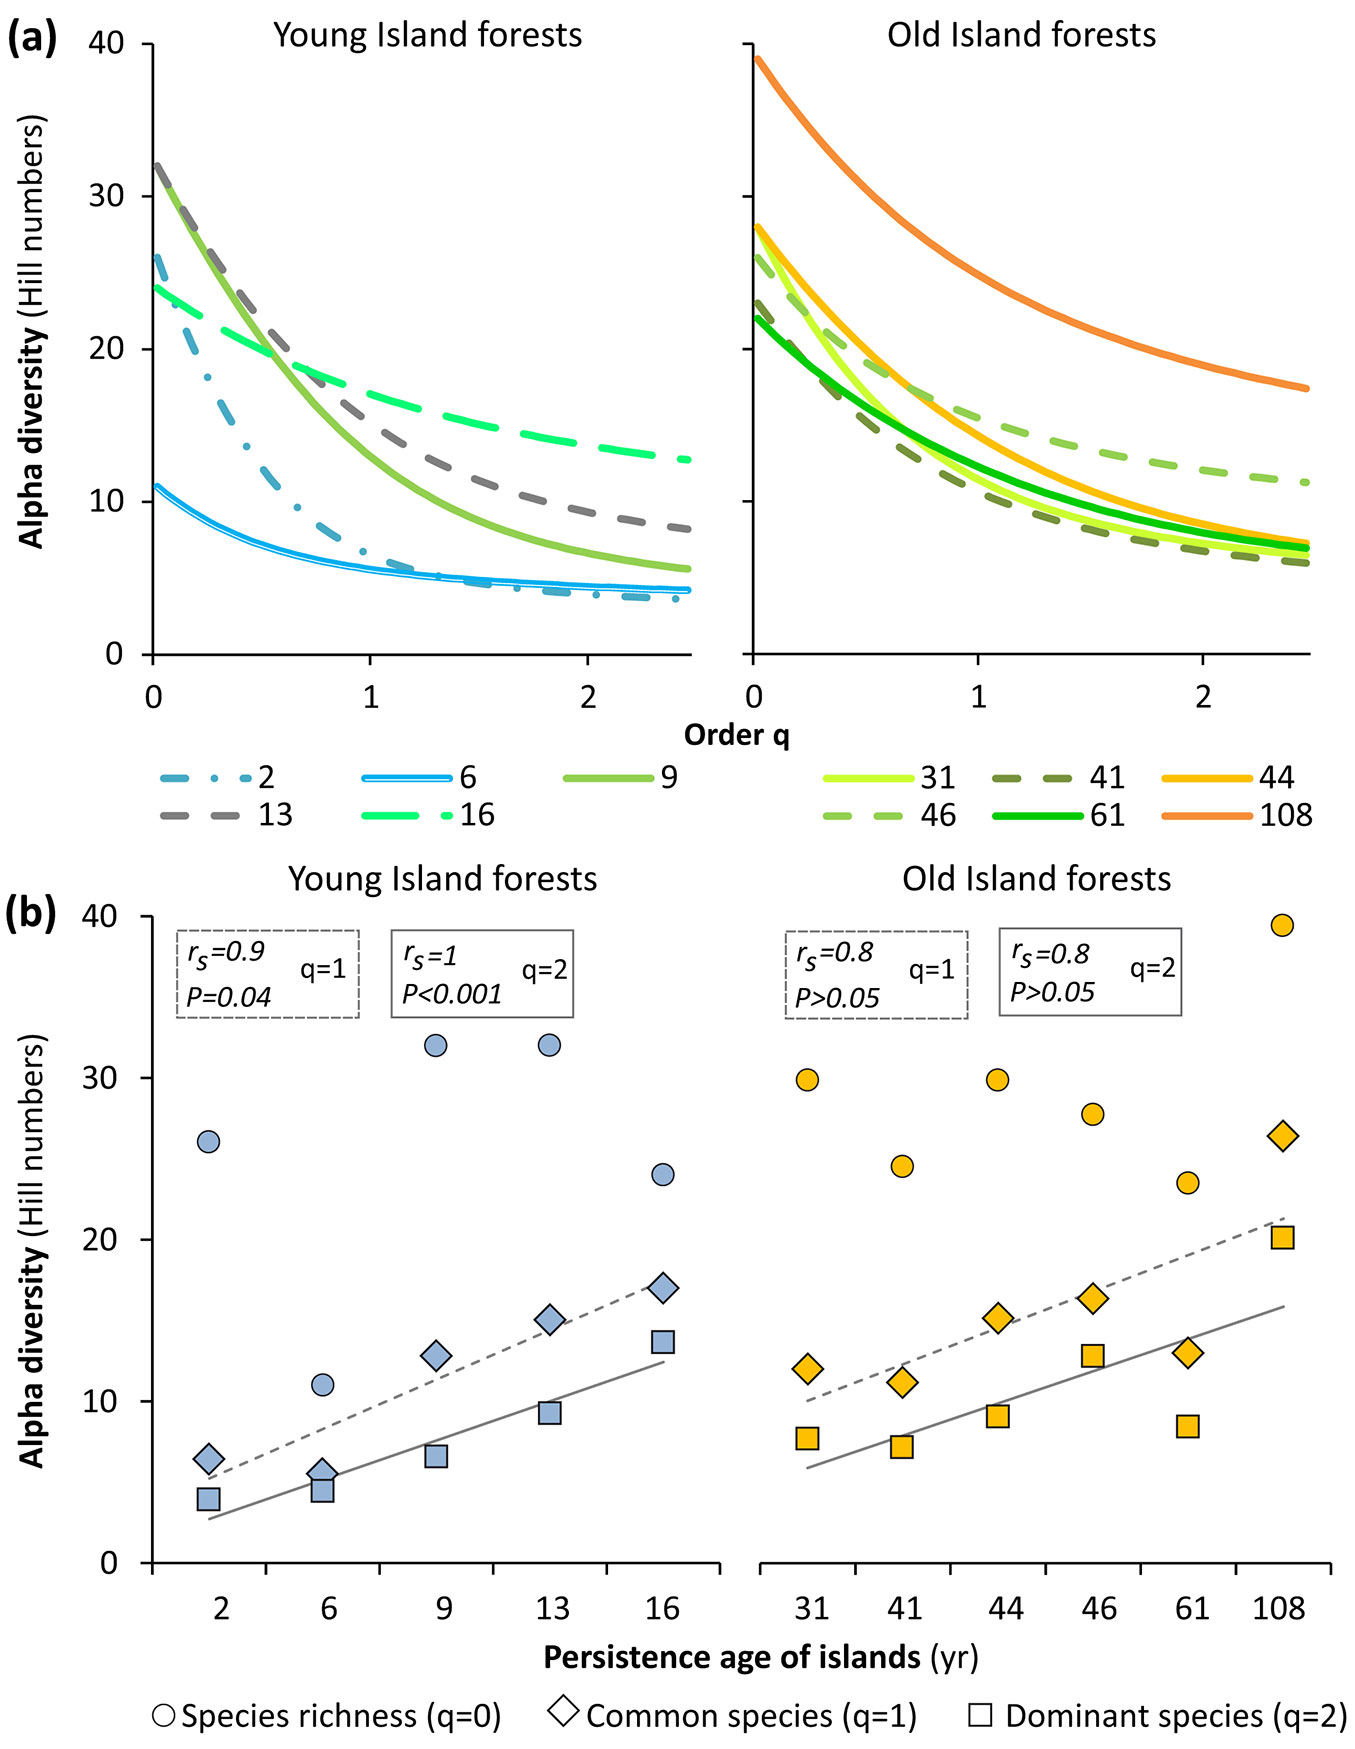
Regarding temporal trends, the correlations between the chronological series of the islands and the alpha diversity were extremely weak for the three q-orders (rs ≤ 0.4). However, the YIs ages did show a positive, strong and significant correlation, both with the common species number (q = 1, rs = 0.9, P = 0.04) and the dominant species number (q = 2, rs = 1, P < 0.01). The OIs ages also revealed a positive and strong correlation with the same two q-orders of diversity (q = 1 and q = 2), but only at the sample level (rs = 0.8, P > 0.05, in both cases - Fig. 6b).
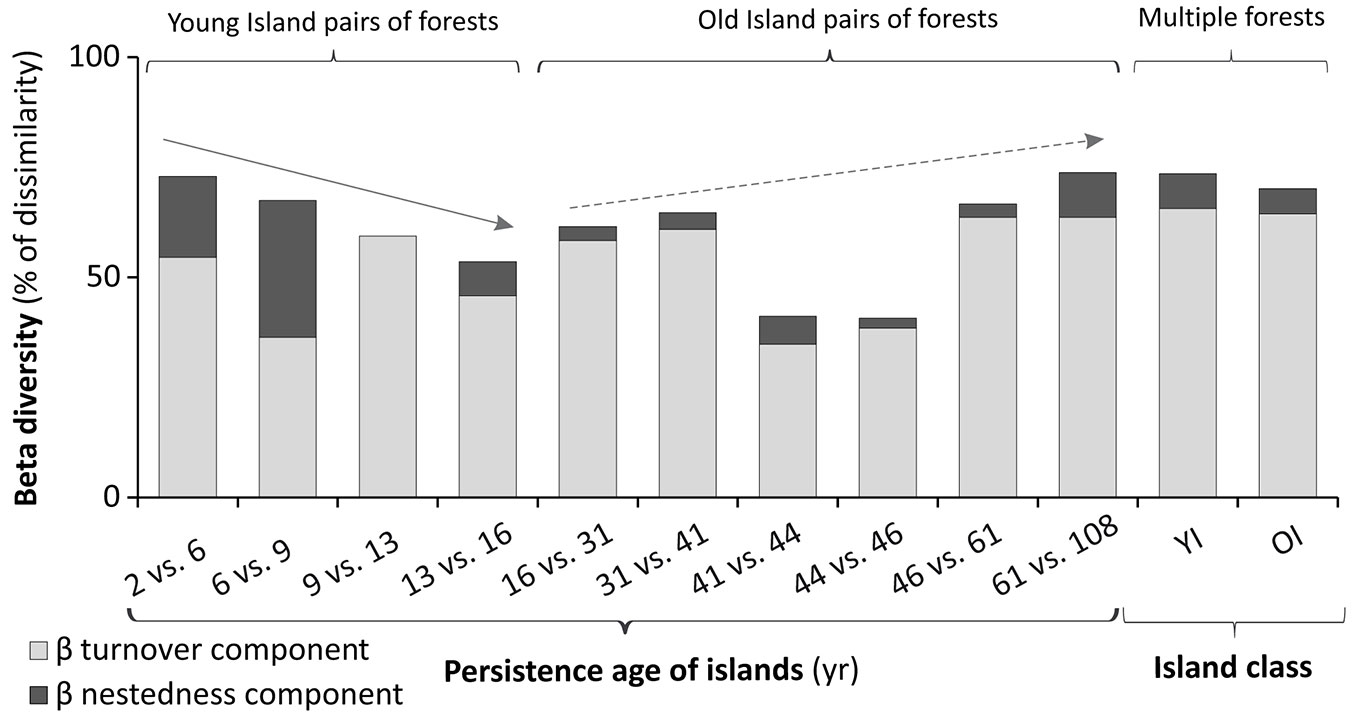
The beta diversity analysis between pairs of forests (island) showed two relatively clear patterns. The dissimilarity tends to decrease steadily in the YIs and to increase from the passage of young to old islands (16 vs. 31 years old) to the oldest which were surveyed (Fig. 7). The scarce beta diversity value between forests of old islands with close ages (41 vs. 44 and 44 vs. 46 years old) attenuates the latter tendency towards an increase in dissimilarity. The beta diversity analysis among multiple forests (Fig. 7) showed the greatest changes in the five YI forests, in relation to the six OI forests. In general, the species replacement component predominated in both analyses, which indicated greater importance of changes in species composition over changes in richness (dissimilarity component by nesting) in determining beta diversity.
Fig. 7 - Beta diversity of forests. On the left side: beta diversity between pairs of forests over the chronologic series of islands; arrows highlight trends (see text). On the right side: beta diversity in multiple forests, corresponding to Young and Old Island classes (YI and OI).
Forest and tree stand structure
Forests generally have three well-defined strata with high variability in the maximum heights and coverages of each stratum, both in the series of islands and in the YI and OI classes (Tab. 1). The dominant/codominant species was constant only for the YI canopy (willows and/or alders). Meanwhile, there were dominant/codominant and constant species in the OI canopy (willows), the OI understory (Dragon’s Blood), and the OI herbaceous layer (S. laxa and T. vesicarium). Only three out of nine tree species had large and common populations: C. urucurana, T. integrifolia, and S. humboldtiana, with densities greater than 75 trees ha-1 and more than 30% of frequency.
Tab. 1 - Forest structure variables (minima and maxima values) in Young and Old Islands forests. (*): species marked with an asterisk were only dominant in two forests (while the remaining species were dominant in at least four forests).
| Forest strata | Young Islands (2-16 yrs) | Old Islands (31-108 yrs) | ||||
|---|---|---|---|---|---|---|
| Height (m) | Cover (%) | Dominant species |
Height (m) | Cover (%) | Dominant species |
|
| Canopy | 4-10 | 10-90 | Salix humboldtiana, Tessaria integrifolia | 5-16 | 5-70 | Salix humboldtiana |
| Understory | 2-3 | 0-40 | Ludwigia elegans* | 4 | 5-60 | Croton urucurana |
| Herbaceous | 0-1 | 0-90 | - | 0.5-2 | 5-90 | Steinchisma laxa*, Teucrium vesicarium* |
The YI average diameter (DBH) and the maximum height of willows and alders seemed to increase steadily in the chronological series (Tab. 2). In contrast, none of the OI 4 structural variables (density, C-A, maximum height, and mean DBH) of S. humboldtiana and C. urucurana showed a clear tendency (Tab. 2).
Tab. 2 - Structure of the main tree populations in Young and Old island forests. Each range values is shown in chronological order; cases where the minima and maxima of a variable match the extreme age of an island, are indicated with an arrow.
| Tree populations | Variables | Young Island (2-16 yrs) |
Old Island (31-108 yrs) |
|---|---|---|---|
| Salix humboldtiana “Humboldt willow” |
Density (trees ha-1) | 24000 → 600 | 1600 - 200 |
| Mean DBH (cm) | 2.3 → 18 | 15.7 - 37 | |
| Maximum height (m) | 4 → 10 | 5 - 16 | |
| Cover-Abundance (%) | 40-15 | 5 - 60 | |
| Tessaria integrifolia “River alder” |
Density (trees ha-1) | 60000 → 500 | - |
| Mean DBH (cm) | 2.6 - 11.4 | - | |
| Maximum height (m) | 4 → 10 | - | |
| Cover-Abundance (%) | 40 - 15 | - | |
| Croton urucurana “Dragon′s blood” |
Density (trees ha-1) | - | 300 - 800 |
| Mean DBH (cm) | - | 7.5 - 14.2 | |
| Maximum height (m) | - | 4 - 6 | |
| Cover-Abundance (%) | - | 10 - 73 |
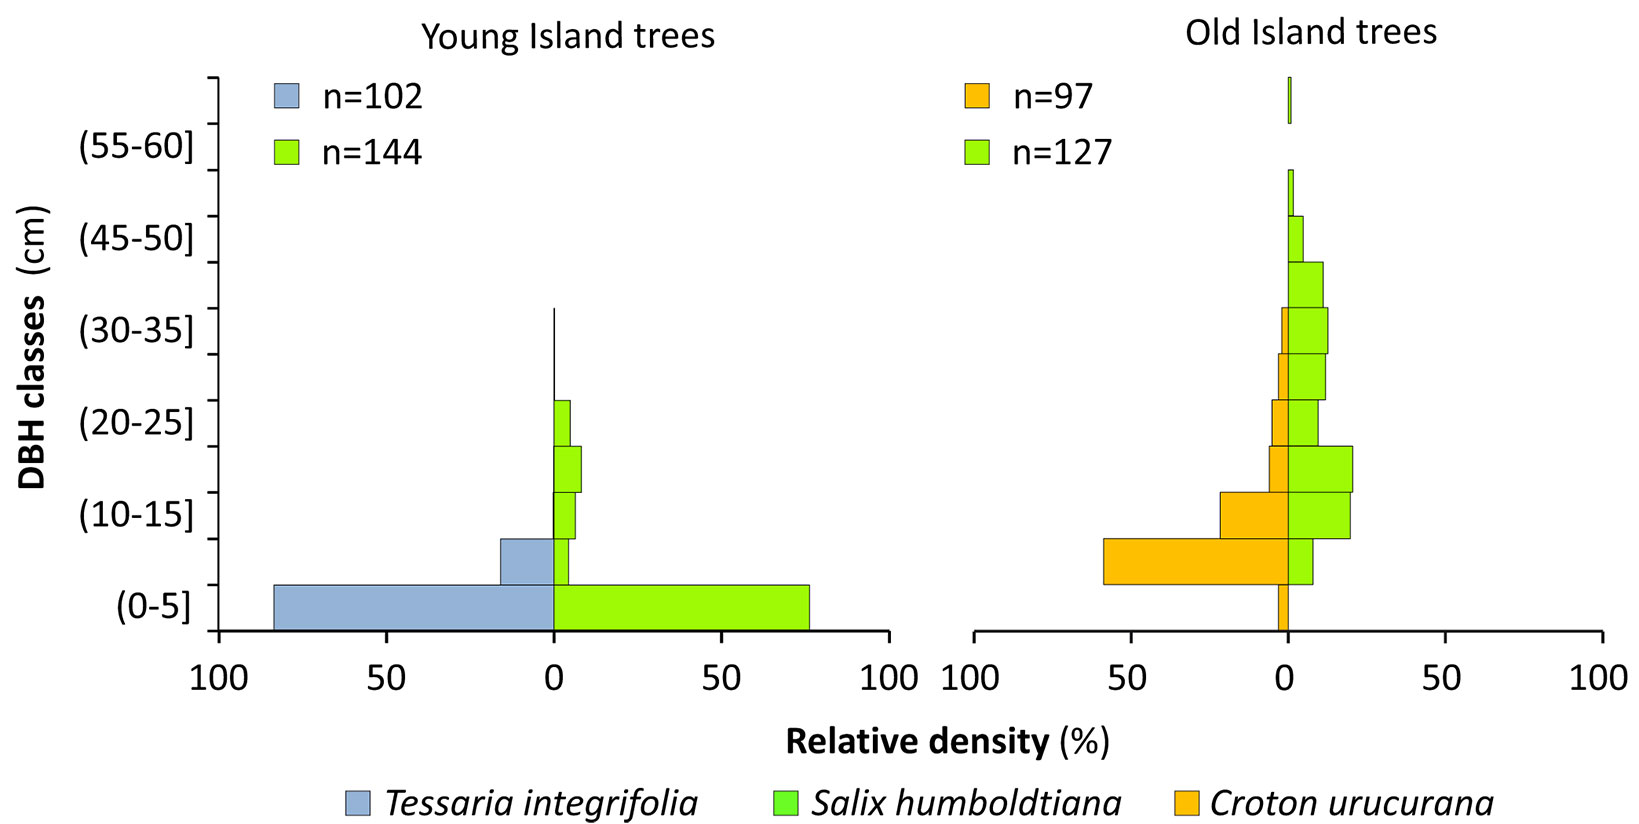
Regarding the age structure, which was estimated from the distribution of DBH (470 measured trees), both T. integrifolia in YI and C. urucurana in OI, concentrated most of their individuals in DBH of up to 5 or 10 cm, respectively; consequently, their populations were likely to be quite young (Fig. 8). On the other hand, the populations of S. humboldtiana differed according to the type of island: it presented a skewed distribution to YI young populations, while the OI distribution of DBH approaches a normal distribution (Fig. 8).
Fig. 8 - Diameter classes of the three dominant arboreal populations. The diameter at breast height (DBH) is ordered according to the relative density of each population.
Forest multiple attributes and indicator species
The variables presented above were analysed jointly using multivariate techniques.
The results of the Multi-Response Permutation Procedures (MRPP) showed that the differences in the YI and OI tree structure (DBH, density, and height) were significant (A = 0.14, P = 0.01). Likewise, the C-A of the 101 species also varied significantly from these two island classes (A = 0.09, P < 0.01). On the other hand, the MRPP that evaluated the variation in alpha diversity and proportion of life-forms did not show significant differences between both island classes, showing a very low intra-group homogeneity (A = 0.02, P = 0.17).
The Species Indicator Analysis (SIA) provided the maximum and significant indicator value (IV = 1, P = 0.003) for T. integrifolia and C.urucurana, the two tree species restricted, respectively, to YIs and OIs. Likewise, another 12 species (mostly herbaceous) had a relatively high IV (from 0.6 to 0.7) and also a P < 0.10, which is noteworthy, given the fact that the number of sampling units may have masked their real importance. Of these 12 species, only 2 were exclusive to YIs (Eragrostis hypnoides and Hymenachne aplexicaule), while 5 were restricted to OIs (Cantinoa mutabilis, Nectandra angustifolia, Setaria parviflora, Cyclospermum leptophyllum and Sphagneticola brachycarpa); the remaining 5 were present in all the islands (T. vesicarium, Mikania cordifolia, Cyperus eragrostis, Phyla nodiflora var. reptans and Commelina diffusa). The complete species list of the SIA is given in Tabl. S3 and Tab. S4 (Supplementary material).
As a complement of the abovementioned results, Fig. S2 and Fig. S3 in Supplementary material report field photos and summarize remarkable features of the oldest bar forests.
Discussion
Linking forest diversity to island dynamics
In floodplains, hydrogeomorphic dynamics have been considered as the main driver of changes in forest diversity over time ([10], [21]). These dynamics are related to, at least, two variables: persistence age and elevation of the landform, both extremely useful to evaluate how the disturbance regime (e.g., waterlogging) can distort the autogenic successional pathways of vegetation ([24], [43]).
The significant differences in the current elevation between the island classes are explained by the contrasting effective discharge during the wet and dry periods in which the islands were formed. In turn, these periods are strongly linked to hydraulics and the horizontal and vertical accretion of the sand bars occurred in this particular stretch of the Middle Paraná River ([42]). In spite of these elevation differences, the proportion of the low water phase was predominant among all the islands. Consequently, the impact of such phase on forest diversity was similar, since it limits the recruitment of seedlings but favours the radial growth of trees, and the development of herbs and climbers ([8], [41], [54], [29]).
On the other hand, it is in the high water phase, or flood stage, where sedimentation events are concentrated, enabling vertical accretion. Therefore, this phase is relevant, since sedimentation rates have been negatively correlated with the age of floodplain forests, based on the decreasing tendency in the density of trees over the entire successional sequence, favouring accretion ([54]). In this sense, a winter flood of the Paraná River contributed up to 60 cm thick of fine sediments (silt and clay) in young alder forests, while up to 5 cm were recorded in mature willow forests; paradoxically, these forests clearly differed in their diversity but not so much in their former elevation (Marchetti et al., unpublished). In a large summer flood (> 30,000 m3 s-1), the sedimentation has reached a layer greater than 1 meter ([45]), which shows the rapid changes happened in the main channel islands.
Our results show that forests increased their alpha diversity over time, as it has been reported in other large river floodplains ([6], [55], [54]). More specifically, the change in floristic composition along the chronological series of islands, ranging from forests with Tessaria integrifolia and 29 other species, restricted to young islands (YIs), to forests with Croton urucurana and other 33 species limited to Old Islands (OIs), had not been recorded in the literature ([27], [38]). This noteworthy floristic change between the two island classes was also supported and reflected by the behaviour of beta diversity along the island chronology. In this sense, a similar “reflection” between the floristic and geomorphological patterns has been reported in the Tagliamento River in Italy ([25]).
In YI forests, the composition of vascular plants is unstable since a large proportion of aquatic life-forms appeared as tourist species ([17]), with a tendency to decrease over time along with beta diversity. On the other hand, YI tree species are not only constant but also their homogeneity in diameter classes indicates that the age of forests can be associated with the age of islands formed in dry periods. This association was in fact supported by dendrochronological approaches that validated what was observed by cartographic sources for islands which are less than 20 years old ([33], [5]). In this sense, Tessaria integrifolia has been assigned a maximum age of 20 years old ([36]), which is consistent with our results as this tree species was restricted to islands up to 16 years old.
Contrary to YIs, the floristic composition in the OI forests is more stable and the dominant tree species in the forest canopy presents greater heterogeneity in diametric classes. This heterogeneity could indicate a discrepancy, or delay, between the age of formation of such islands and the age of the dominant species of the forest canopy (Salix humboldtiana). In this sense, S. humboldtiana has been referred as the arboreal species with the greatest niche amplitude, occurring in very contrasting forests with very different hydrogeomorphic drivers ([28], [38], [29]). Although a maximum age of 16 to 20 years old has been determined for S. humboldtiana in the Central Amazon River floodplain ([55], [11]), we recorded forests of Salix humboldtiana in older sites, which has persisted after extraordinary floods. This fact, suggests that S. humboldtiana could survive more than 20 years in the floodplain of the Middle Paraná River. Similar patterns of delay between ages of islands and floodplain forests have been found in other large rivers. For islands of the upper reaches of the Amazon River (namely, Peru), Jokinen et al. ([22]) detected a delay between the age of the island oldest site and the successional stage of forests. The authors claimed that the isolation of the erosive processes, given by the distance of the island to the active channel, determined forests of greater complexity (which does not necessarily mean a greater age of the area colonised by such forests on the island). These sectors, involving a low influence of hydrogeomorphic disturbances, act as spatial refugia which seems to be a common feature of very contrasting river systems. For example, the greater diversity of tree species in the Tokachi River (Japan) was associated with stable sites in hydrogeomorphic terms ([46]); the inactive channels of the Sacramento River (USA) are a refuge for their pioneer species during periods of high stress ([48]). Thus, both our results and the available literature suggest that the hydrogeomorphic dynamics would tend to mix, progressively, the attributes of mature and young forests in sites directly connected to the main routes of water and sediments.
Succession in island forests of the Middle Paraná River
So far, there are only two studies that have addressed the primary succession sensu lato in sand bars of the main channel of the Middle Paraná River ([33], [27]). In his study, Morello ([33]) reported that the first woody plant colonising the bar is a tall bush, Baccharis salicifolia, preceding willow and alder forests, and that all subsequent successional pathways converge in the “white forest”, an association of 4 tree species. For their part, Lewis & Franceschi ([27]) pointed out that although the vegetation units which transform the bars into islands are made of pure alders or mixed with willows, the pathways do not necessarily converge in a single community, the most consistent proposal being the one that culminates in the Forestum insularis, a forest in some way similar to the “white forest”. Both studies are to some extent related to the “classical” approach of succession, in which the analysis is restricted almost exclusively to changes in plant diversity, implying that there is little certainty about the influence of hydrogeomorphic dynamics on the consequent successional pathways. Thus, the aspects relating to age and elevation of the landforms remain unanswered, all of which is basic knowledge to understand the role of vegetation-landform feedback in succession.
Considering this feedback, the fluvial biogeomorphic succession approach ([10]) identifies, through four different phases, the relative importance of physical and biotic compartments in such plant diversity changes. From this approach and considering the studies mentioned above and the relevant literature, our results show features of two successional phases: (i) the “pioneer phase” (defined by a predominance of abiotic filters and an incipient biotic influence); and (ii) the “biogeomorphic phase” (characterized by a shared control of the physical and biotic filters and a maximum feedback between both).
In the first place, a minimal stabilization of the sand bars made it a suitable habitat for the woody species colonisation, and could be facilitated by strictly aquatic species. The set of aquatic species found as companions in the recent islands of our study (tourist species in the forests) is consistent with marshy and submerged hydrophytes reported as the first plant colonizers of the bars ([33], [12]). On the other hand, Lewis & Franceschi ([27]) describe them as rare and despicable pioneer species. Contrasting both contributions with our results, this biogeomorphic structure (i.e., bars and hydrophytes) could be interpreted as an ephemeral “pioneer phase”, which contributes, only under conditions of low fluctuation of the water level (disturbances of low intensity, duration, and recurrence), to the recruitment of the ecosystem engineers of the following phase: willows and alders. In this sense, the germination of willows would be the key process that marks the transition from the pioneer phase to biogeomorphic phase. It is worth adding that there is no agreement in the literature on whether the flooded soil constraints this process of germination ([38]) or not ([40]).
All the floodplain forests discussed in this study would be part of a “biogeomorphic phase”, considering the 3 dominant tree species could be associated with early successional stages, e.g., in terms of biological traits such as the low density of wood ([55]). Also, these 3 species are tolerant to a great intensity of hydrogeomorphic disturbances. On the one hand, it can be observed that in the Young Islands, willows and alders are the engineer species acting as a trap of fine sediments and associated nutrients, favouring the recruitment of a large variety of vegetation life-forms ([27]). In the Old Islands, the codominant of the willow, i.e., Croton urucurana, is a diagnostic species of an Association sensu stricto labelled as disturbance-recovering ([12]). Furthermore, C. urucurana was dominant in a forest located on a 44-year-old island, in which a large crevasse splay was detected (Fig. S3 in Supplementary material). Such landform is an indicator of a great disturbance since the granulometry of the original levee, and, presumably, its floristic composition is modified in its genesis.
In our study, and contrary to previous contributions ([33], [27]), a plurispecific forest on levees was not detected. This biogeomorphic structure (i.e., levee and plurispecific forest) could be seen as an “ecological phase” within the fluvial biogeomorphic succession, where biotic interactions (e.g., competition and mutualism) are the main driver of vegetation features because of a spatial disconnection from the hydrogeomorphic processes of disturbance ([10]). Precisely, we understand that the distance of the oldest bar areas to the anabranches of the main channel (in ten islands such distance was less than 50 m), represented a strong limitation in the recruitment of late successional species (e.g., with traits such as high density of wood - [55]). Conversely, the spatial disconnection of the disturbance has been related to the location of forests with the maximum richness of tree species in large floodplains ([22], [38], [54]). In the Middle Paraná River floodplain more specifically, such forests have been surveyed in geomorphic units with a very low disturbance rates such as point bars of the San Javier River, internal levees of the large main channel islands or old point bar of the Colastiné River ([13], [14], [38], [29], [30]). Therefore, it seems that the increase in floodplain forest diversity in a large river is linked to spatial refugia defined by the fluvial hydrogeomorphic dynamics.
Conclusions
In this study, we provide some valuable insights for future research on the temporal trends of forests and islands in a large river. Some attributes of forest diversity (floristic composition and stand structure) showed significant changes synchronized to the change from the young to the old island classes. Hence, these classes could be seen as major successional shifts in both vegetation and landforms, involved mostly in a biogeomorphic phase. This fact highlights the need to combine the potentialities of different disciplines in the study of fluvial systems, given the fact that changes occur simultaneously in hydrogeomorphic and ecological levels. In addition, it would be very useful to validate the cartographic approximations on the island ages with methods that provide greater resolution on the age of the floodplain forests, e.g., by means of dendrochronological approaches. Accordingly, the relevance of models (such as the fluvial biogeomorphic succession), and approaches (such as the dendrochronology), lies in their potential contribution to ecological models that complement the hydro-geomorphological ones, in the task of unravelling the entire dynamics of large river floodplains.
List of abbreviations
(C-A): cover-abundance; (DBH): diameter at breast height (1.3 m above the ground); (OI): Old Islands; (YI): Young Islands; (IV): Indicator Value in the Species Indicator Analysis; (MRPP): Multi-response Permutation Procedures; (P): p-value in statistical hypothesis tests; (q): a key parameter (“order”) in an effective number of species (“Hill numbers”); (rs): Spearman’s correlation coefficient of the Spearman correlation test; (SIA): Species Indicator Analysis; (Z): standardized statistic of the exact Wilcoxon-Mann-Whitney test.
Acknowledgements
We thank Carlos G. Ramonell for his advice, particularly at the beginning of this study. Also, we thank Mauro Galiano (FICH-UNL, Santa Fe, Argentina) for his helpful assistance in the elevation survey. We are very grateful with the three anonymous reviewers, whose comments enhanced the quality of our original work. This study was carried out through funds provided by project PICT 2014-3139 from the ANPCyT (Agencia Nacional de Promoción Científica y Tecnológica). FB has a doctoral scholarship from the CONICET (Consejo Nacional de Investigaciones Científicas y Técnicas).
References
Gscholar
Gscholar
Online | Gscholar
Gscholar
Gscholar
Gscholar
Gscholar
Gscholar
Gscholar
Gscholar
Gscholar
Gscholar
Gscholar
Gscholar
Gscholar
Gscholar
Gscholar
Gscholar
Gscholar
Gscholar
CrossRef | Gscholar
Authors’ Info
Authors’ Affiliation
Zuleica Yael Marchetti 0000-0002-9241-9217
Centro Científico Tecnológico CONICET Santa Fe, Predio CONICET “Dr. Alberto Cassano”, Colectora Ruta Nacional 168 - Km. 0, Paraje El Pozo, 3000 Santa Fe (Argentina)
Zuleica Yael Marchetti 0000-0002-9241-9217
María Soledad Pereira
Facultad de Ingeniería y Ciencias Hídricas, Universidad Nacional del Litoral (FICH-UNL), Ciudad Universitaria UNL, Ruta Nacional 168 - Km 472.4, Santa Fe (Argentina), CC 217, 3000 Santa Fe (Argentina)
Corresponding author
Paper Info
Citation
Brumnich F, Marchetti ZY, Pereira MS (2019). Changes in forest diversity over a chronosequence of fluvial islands. iForest 12: 306-316. - doi: 10.3832/ifor2737-012
Academic Editor
Matteo Garbarino
Paper history
Received: Jan 24, 2018
Accepted: Apr 02, 2019
First online: Jun 06, 2019
Publication Date: Jun 30, 2019
Publication Time: 2.17 months
Copyright Information
© SISEF - The Italian Society of Silviculture and Forest Ecology 2019
Open Access
This article is distributed under the terms of the Creative Commons Attribution-Non Commercial 4.0 International (https://creativecommons.org/licenses/by-nc/4.0/), which permits unrestricted use, distribution, and reproduction in any medium, provided you give appropriate credit to the original author(s) and the source, provide a link to the Creative Commons license, and indicate if changes were made.

Web Metrics
Breakdown by View Type
Article Usage
Total Article Views: 43650
(from publication date up to now)
Breakdown by View Type
HTML Page Views: 36415
Abstract Page Views: 3304
PDF Downloads: 3137
Citation/Reference Downloads: 3
XML Downloads: 791
Web Metrics
Days since publication: 2581
Overall contacts: 43650
Avg. contacts per week: 118.38
Article Citations
Article citations are based on data periodically collected from the Clarivate Web of Science web site
(last update: Mar 2025)
Total number of cites (since 2019): 3
Average cites per year: 0.43
Publication Metrics
by Dimensions ©
Articles citing this article
List of the papers citing this article based on CrossRef Cited-by.
Related Contents
iForest Similar Articles
Research Articles
Historical fire ecology and its effect on vegetation dynamics of the Lagunas de Montebello National Park, Chiapas, México
vol. 14, pp. 548-559 (online: 01 December 2021)
Research Articles
Mapping the vegetation and spatial dynamics of Sinharaja tropical rain forest incorporating NASA’s GEDI spaceborne LiDAR data and multispectral satellite images
vol. 18, pp. 45-53 (online: 01 April 2025)
Research Articles
Post-fire effects and short-term regeneration dynamics following high-severity crown fires in a Mediterranean forest
vol. 5, pp. 93-100 (online: 30 May 2012)
Research Articles
Differences in early dynamics and effects of slope aspect between naturally regenerated and planted Pinus sylvestris woodland on inland dunes in Poland
vol. 9, pp. 875-882 (online: 17 June 2016)
Research Articles
Strong relationships between soil and vegetation in reference ecosystems of a riparian Atlantic rainforest in the upper Doce River watershed, southeastern Brazil
vol. 16, pp. 226-233 (online: 17 August 2023)
Research Articles
Consistency among forest structure and biodiversity potential index (IBP): an assessment of stand structural complexity for floodplain poplar woodlands
vol. 18, pp. 335-343 (online: 04 November 2025)
Research Articles
Stand structure and deadwood amount influences saproxylic fungal biodiversity in Mediterranean mountain unmanaged forests
vol. 9, pp. 115-124 (online: 08 September 2015)
Research Articles
Stand dynamics and natural regeneration in silver fir (Abies alba Mill.) plantations after traditional rotation age
vol. 7, pp. 313-323 (online: 08 April 2014)
Research Articles
Post-fire recovery of Abies cephalonica forest communities: the case of Mt Parnitha National Park, Attica, Greece
vol. 11, pp. 757-764 (online: 15 November 2018)
Research Articles
Impact of the four-eyed fir bark beetle (Polygraphus proximus Blandf.) on coarse woody debris stock and carbon budget of fir forests in Central Siberia
vol. 19, pp. 209-218 (online: 08 June 2026)
iForest Database Search
Search By Author
Search By Keyword
Google Scholar Search
Citing Articles
Search By Author
Search By Keywords
PubMed Search
Search By Author
Search By Keyword


