Exploring patterns, drivers and structure of plant community composition in alien Robinia pseudoacacia secondary woodlands
iForest - Biogeosciences and Forestry, Volume 11, Issue 5, Pages 586-593 (2018)
doi: https://doi.org/10.3832/ifor2687-011
Published: Sep 25, 2018 - Copyright © 2018 SISEF
Research Articles
Abstract
Invasive alien tree species can strongly impact biodiversity and future projections predict their spread over natural, semi-natural and human habitats. However, little is known about plant communities that form during the first stages of invasion. We investigated the composition of plant communities in alien Robinia pseudoacacia L. secondary forests growing on grasslands and cultivated areas abandoned during the last 35-40 years in north-eastern Italy to understand whether these formations could cause floristic homogenization of plant communities composition. On the basis of a cluster analysis, plant communities were assigned to seven syntaxonomic categories and split into four groups characterized by the occurrence of 20 species indicative of (a) nitrogen-rich, (b) true forest and (c) open habitat conditions. RDA analysis enabled main stand and environmental variables filtering these communities to be identified and β-diversity components were partitioned through the SDR (Similarity - richness Difference - species Replacement) simplex approach. Plant composition patterns were significantly associated to variability in elevation, stand vertical structure, shrub cover, mean tree diameter and height, and basal area. Shrub cover discriminates between plant communities associated with open or shaded conditions. The partition of β-diversity components revealed that replacement is the prominent process structuring plant communities in these secondary forests. Our study showed that secondary Robinia forests growing on abandoned lands may host compositionally heterogeneous plant communities, thus contributing to regional biodiversity.
Keywords
Black Locust, Alien Tree Species, Biological Invasion, Species Replacement, Plant Composition
Introduction
Among alien plants, trees are extremely important due to their spread and consequences on biodiversity and ecosystem services ([35]). The most updated global checklist indicates that Europe has currently 73 invasive alien tree species ([34]). Many of these are able to form extensive forests, impacting native plant communities.
In many parts of Europe, forests are expanding on abandoned lands ([36]). Indeed, farmland abandonment is an important process that is foreseen to continue up to 2030 at a rate of 3-4% of total land ([16]). Alien trees can invade many open habitats, such as fallow areas and urban wastelands, and can thus be favoured by land abandonment. This invasion, also enhanced by climate change ([17], [6]), can trigger the development of secondary forests with plant communities dominated by alien species ([18]).
The nitrogen-fixing tree Robinia pseudoacacia L. (black locust) is one of the most invasive alien species in Europe ([19]) and it has been commonly planted due to its economic importance ([38]). This species replaces native trees and can invade abandoned lands and forests in urban, riparian and rural environments ([37], [39]). Other invasive alien tree species, such as Acer negundo and Ailathus altissima, could be viewed as even more threatening due to their future expansion ([7]). While invasion by these species should receive more attention, it is most likely that in the near future Robinia will expand in many parts of Europe ([6]); however, outside Central Europe, current information on patterns and drivers of compositional variability of plant communities in secondary stands developed on abandoned areas is extremely scanty ([48]).
The effects of this invasion on native plant communities are still debated, as contrasting results in terms of changes to diversity and composition were found in different studies ([10], [48]). However, it is believed that secondary Robinia forests can constitute characteristic plant communities ([47]). Furthermore, these forests seem to favour the invasion by other alien plant species ([14]). Indeed, Robinia stands can invade a variety of different soils ([49]) causing a reduction in species richness and homogenization of vascular plant diversity ([3], [37], [45]). However, while invasive alien species may act as “drivers” of change, in many cases they are “passengers” of change driven by more fundamental environmental factors ([23]). The compositional variability in invaded sites could thus be driven by changes in environmental and habitat characteristics rather than by the presence of the alien species per se.
In this perspective, in addition to the classical analysis of community species composition and its phytosociological classification, evaluation of the components of β-diversity can help to elucidate the mechanisms and processes structuring the communities ([42]). These components reflect different phenomena and are important for our understanding of fundamental biogeographic, ecological and conservation issues ([2]). Dissimilarity among species communities, i.e., the level of variation in community composition ([50]), can originate from two processes: species replacement (also called turnover) indicating the substitution of species among sites, and richness differences related to species gains and losses ([2], [29]). Both these components can have an important explanatory role as they can be related to ecosystem processes ([21]). Furthermore, understanding the contribution of these components to the community structure ([28]) may have important implication for biodiversity conservation ([2], [15]). Nevertheless, the analysis of these two components (i.e., species replacement and richness difference) has received little attention ([15]), despite the fact that it could potentially improve our knowledge on the consequences of alien species invasion.
We investigated patterns and drivers (both natural and anthropogenic) of compositional variability of plant communities in Robinia stands on abandoned land in north-eastern Italy. The study aims to understand the variation in species composition with the following specific objectives: (i) to identify discontinuities in species composition through the phytosociological classification of secondary Robinia stands; (ii) investigate the drivers (i.e., land cover, site and stand structure features) shaping plant community composition in secondary Robinia forests; and (iii) assess the underlying ecological mechanisms determining the variation in plant community composition by evaluating the relative contribution of the components of β-diversity to community assembly.
Materials and methods
Study area
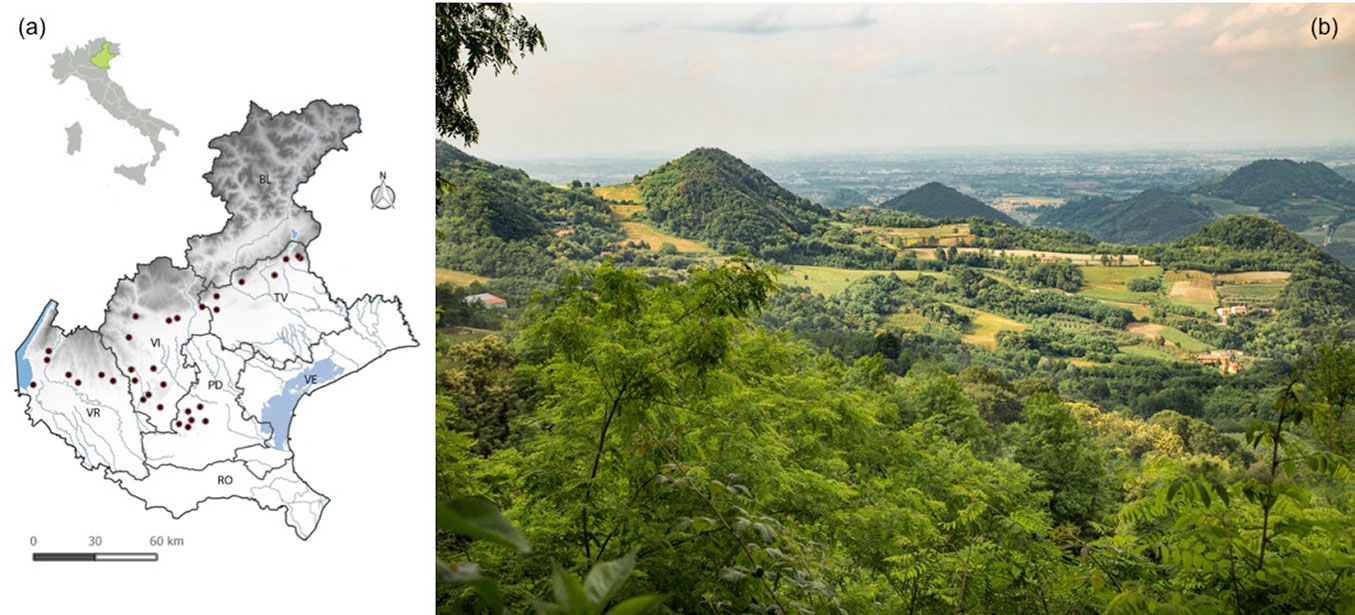
The study was conducted in the Veneto region, north-eastern Italy (approximately 2700 Km2, 45° 74′ N, 11° 52′ E - Fig. 1). We focused specifically on the rural-urban fringes of the floodplain, the Euganean and Berici hills, and hilly areas of the pre-Alps. Over this area, the climate is rather homogeneous, with hot summers and harsh winters, but precipitation increases moving northward and with increasing elevation ([1]).
Fig. 1 - Distribution of the sampled secondary Robinia stands (a) and a typical landscape (Euganean hills) where secondary Robinia stands are widely distributed (b). Codes refer to the provinces of Veneto region.
Robinia was first introduced in Veneto and Italy in 1662 at the Botanical Garden of Padova (Wein 1930, as reported in [10]). According to Robinia distribution models, most of the area considered in this study is highly suitable for this species ([6], [38]). Furthermore, it was mapped as an area with relatively high levels of invasion by neophytes ([9]). Indeed, forests of Robinia are common on hilly areas and the pre-Alps, and cover about 18.561.41 ha corresponding to 4.7% of the total regional forest cover ([12]). It is also the most frequent forest type in certain areas of the region, such as the Montello and the Euganean hills.
Data collection
To identify secondary Robinia stands, we overlapped the forest type map of the Veneto region ([12]) with a series of historical aerial photographs. The aerial photographs were used to detect forest colonization of open areas. To identify areas reforested by Robinia we compared aerial images from 1978-1983 with the most recent ones of 2006-2007. Maximum stand age is therefore dependent on the years used to assess the presence of open areas.
Robinia dominance in the selected areas was confirmed through field visits. We randomly located 32 sampling stands in these areas, evenly distributed across the altitudinal range (Fig. 1). Within each stand, we established a 10 × 10 m plot, randomly located in the core area at a distance of at least 5 m from the border to avoid edge effects. Elevation ranged from 24 to 693 m a.s.l. (244 m a.s.l. as mean value) representing a relatively high variability and with distance from the sea ranging from approximately 40 to 150 km. Land cover in the 500-m surrounding area was dominated by woodlands (46%) followed by farmland (28% - see Supplementary material). Annual mean precipitation ranges from approximately 800 to 1600-1800 mm and annual mean temperatures from 9 to 15 °C.
For each plot, we recorded data on forest structure, as well as on plant communities. Each tree (DBH ≥ 5 cm) was identified at the species level, and its DBH and height were recorded. Plant species were identified in the understory shrub (DBH < 5 cm and height > 1 m) and herbaceous (height < 1 m) layers and their cover was recorded according to the Braun-Blanquet approach. Cover values were assigned to these vegetation layers based on visual estimation. In each plot, an increment core was collected from the most representative tree of the colonisation process. Total canopy density was recorded through four repeated measures taken with a spherical densiometer at the four cardinal coordinates. We measured solar radiation and canopy shading was calculated as the ratio between the average solar radiation of four random points within the plot and the solar radiation randomly measured outside the forest under the same sky conditions.
To detect drivers of community composition we selected and calculated potential predictors (Tab. 1). Land cover before the invasion was retrieved by analysis of the historical aerial images (between 1978 and 1983). Previous land cover on plot location was observed and described using major categories because of the airborne image quality (i.e., black and white). For instance, it was not possible to distinguish meadows from pastures, so previous land cover was classified as grassland, cultivated (i.e., cropland) or urban/artificial land. Furthermore, land cover around the plots was analysed through the use of Quantum GIS (QGIS - [31]). Three buffers of 250, 500, and 1000 m-radii were created around each plot to calculate the current and past land covers. Current land covers were extracted from the Corine Land Cover map drawn up from 2007 orthophotos available in the Quadro Conoscitivo of Veneto region (⇒ http://idt.regione.veneto.it/). Instead, 1988-1989 georeferenced images available on the Geoportale Nazionale (⇒ http://www.pcn.minambiente.it/GN/accesso-ai-servizi/servizi-di-visualizzazione-wms) were used as historical reference and cover classes were identified through a manual classification process. A coarse classification based on five cover class groups was used: (i) urban; (ii) cultivated; (iii) grassland; (iv) woodland; and (v) “other”. A specific analysis process of land cover predictors was conducted through PCA. After observing correlations among cover class groups between year and buffer size, we selected the first and second component scores referring to 500 m-radii current land covers as landscape variables to be considered in the successive analysis. The first PCA axis (pcUC) represents a gradient of increasing urban and arable lands and reduction in grasslands and woodlands, while the second PCA axis (pcUG) represents a gradient of increasing urban and grasslands and a decrease in arable lands and woodlands.
Tab. 1 - Explanatory variables used to investigate plant composition.
| Group | Variable | Description |
|---|---|---|
| Land cover |
pcUC | First principal component score for landscape variables |
| pcUG | Second principal component score for landscape variables | |
| snat.orig | Grassland before invasion: no [0], yes [1] | |
| Site | Slope (slope) | Slope inclination of the plot surface (°) |
| Aspect (southness) | Main aspect considering plot slope morphology | |
| Elevation (Elev) | Elevation (m a.s.l.) in the plot centre | |
| Stand structure | Vertical stratification (ml) | Vertical structure formed by one [1] or two [0] tree layers |
| Treatment type (treatment) | Where the stand showed signs of tree cuts: no signs [0] and sporadic cuts [1]. | |
| Age of stand (core_age) | Age (years) derived from the analysis of increment core of a representative tree (i.e., the largest tree or the largest among those established during colonisation) | |
| Tree layer cover (tree_cover) | Percentage cover (%) of the tree layer (DBH ≥ 5 cm) | |
| Shrub layer cover (shrub_cover) | Percentage cover (%) of the shrub layer (DBH < 5 cm and height > 1 m layer) | |
| Herb layer cover (herb_cover) | Percentage cover (%) of the herbaceous layer (height < 1 m) | |
| Solar radiation (so.rad) | Solar radiation within the stand (W m-2) | |
| Cover density (cop.dens) | Percentage cover (%) | |
| Mean diameter (meanDIAM) | Mean diameter of all trees (cm) | |
| Mean height (meanH) | Mean height of all trees (m) | |
| Basal area (bas.area) | Total basal area per hectare (m2 ha-1) |
Site variables included slope, aspect (i.e., southness can indicate site dryness, to provide comparable non-circular data - [8]) and elevation. Instead, stand structure features included measures derived from direct observation in the field as total cover and cover for each vegetation layer, vertical structure (single or two tree layers), sign of cutting (single trees or total coppicing), as well as from data analysis for mean diameter, mean height, basal area, stand age and solar radiation.
Data analysis
Values of plant cover recorded according to the Braun-Blanquet scale were converted to ordinal scale by applying the method of Van Der Maarel ([46]). The dataset was preliminarily subjected to agglomerative hierarchical clustering analyses by average linkage clustering ([27]). This procedure allowed to identify four groups of stands.
The dataset was then arranged according to clustering classification and by assigning species to different syntaxonomic groups. Species characteristic of syntaxa scarcely represented were assigned as companion species. After excluding this latter group, we performed a non-metric multidimensional scaling (NMDS), based on Bray-Curtis dissimilarity, using the “vegan” package ([26]) in R software ver. 3.2.1 ([32]). This approach was used to represent and explore the pattern of variation of the main phytosociological classes for the different stands. We assigned characteristic plant species to 7 main syntaxonomic groups (see Supplementary material): (i) Rhamno-Prunetea (R-P); (ii) Querco-Fagetea (Q-F, including some Quercetea ilicis species); (iii) Festuco-Brometea (F-B, including Trifolio-Geranietea species); (iv) Artemisietea vulgaris (Av); (v) Molinio-Arrhenatheretea (M-A); (vi) Stellarietea mediae (Sm); and (vii) Galio-Urticetea (G-U).
We also performed an Indicator Species Analysis (ISA - [13]) in R statistical programme to reveal the species that are associated to each of the four groups. This analysis was done applying the “multipatt” function with the “r.g” association function of the “indicspecies” package ([11]).
To understand whether land cover, site and stand structure features influenced the variability of understory plant composition in Robinia stands, we ran a redundancy analysis (RDA) in the R statistical programme using “vegan” package ([26]). Before performing the analysis we transformed original species abundance data by using the Hellinger’s distance to allow the use of RDA for testing the relationships between composition and explanatory variables ([22]). We also conducted a permutation test to assess the significance level.
Where appropriate, a Tukey’s HSD test was then conducted to compare the four groups defined by the cluster analysis in terms of environmental and management variables.
The SDR (Similarity - richness Difference- species Replacement) simplex approach was used to partition the pairwise gamma diversity into three components. We applied this approach using both presence/ absence and abundance (i.e., cover) data, as different outcomes (in terms of community organization) can be obtained using either data ([28]). The SDRSimplex program was used with presence/absence data to calculate Jaccard similarity (Sj), replacement (Rrel, i.e., the gain and loss of species) and richness difference (Drel, i.e., the number of species that either site has in addition to the other site - [29]). Whereas the SDR-abunSimplex program was implemented to calculate Ružička similarity (Sruz), abundance replacement (aRrel, i.e., species abundances in one site replaced by abundances of different species in the other site), and abundance difference (aDrel, i.e., the amount by which the total cover in either site exceeds the total cover of the other - [28]). In addition, β-diversity can be computed as the sum of species or abundance difference and replacement. Detailed explanation of the calculation and meaning of β-diversity and their components can be found in Podani & Schmera ([29]) and Podani et al. ([28]). The scores for the different diversity components were represented using the Ternary Plot option in the NonHier routine for the Syn-tax 2000 programme ([27]). Each pair of sites is graphically represented within an equilateral triangle where angles represent similarity, replacement, and species or abundance difference.
Results
Among the studied stands, secondary Robinia forests invaded 19 (59%) grasslands, 12 (38%) cultivated areas and one (3%) urban/ artificial site. Nine stands are included in Natura 2000 sites. Main stand structure values (Tab. 2) showed a wide variability in terms of basal area and volume. This variability was also confirmed when Robinia alone was considered. Furthermore, Robinia had mean diameter and height values higher than those calculated without distinguishing between tree species in the stand. In addition to Robinia, the most frequent species were elder (Sambucus nigra L.) and manna ash (Fraxinus ornus L.), occurring in 31% of the stands. Field elm (Ulmus minor L.) and nettle tree (Celtis australis L.) were also found in 16% of plots. The abundance of these species was always low.
Tab. 2 - Stand structure features calculated considering all tree species and only Robinia.
| Species | Parameter | DBH (cm) |
Height (m) |
Basal area (m2 ha-1) |
Volume (m3 ha-1) |
|---|---|---|---|---|---|
| All | Mean | 11 | 11 | 25 | 160 |
| Min | 7 | 7 | 5 | 18 | |
| Max | 19 | 18 | 60 | 507 | |
| Robinia | Mean | 12 | 12 | 21 | 140 |
| Min | 7 | 7 | 5 | 18 | |
| Max | 21 | 18 | 50 | 467 |
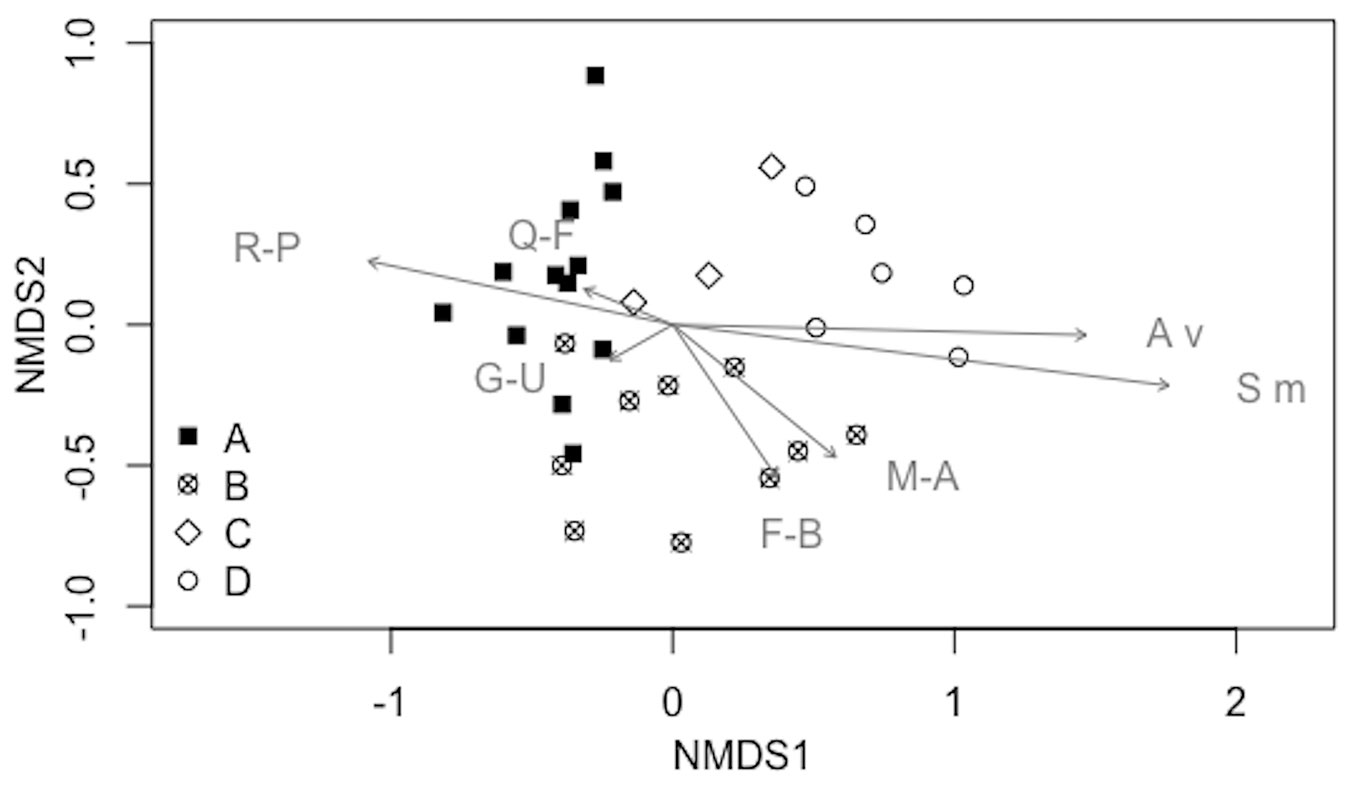
A gradient of stands was observed containing species from Rhamno-Prunetea and Querco-Fagetea species (including some of Quercetea ilicis) to Festuco-Brometea (including Trifolio-Geranietea species), Artemisietea vulgaris, Molinio-Arrhenatheretea, Stellarietea mediae, and Galio-Urticetea (Fig. 2).
Fig. 2 - Results of the NMDS (dimensions: 3, stress: 0.136927) showing syntaxonomic groups (R-P: Rhamno-Prunetea; Q-F: Querco-Fagetea, including some Quercetea ilicis species; F-B: Festuco-Brometea, including Trifolio-Geranietea species; A v: Artemisietea vulgaris; M-A: Molinio-Arrhenatheretea; S m: Stellarietea mediae; G-U: Galio-Urticetea) vs. stands (with the exclusion of companion species). Stands are also related to the four groups identified by cluster analysis: (A) black filled quadrat; (B) cross in a circle; (C) empty rotated quadrat; (D) empty circle (see also Tab. 3).
Results of the indicator species analysis revealed 20 species that are overrepresented in one of the four groups (indicator species - Tab. 3). Group A and C had a high number of indicator species that are related to shaded conditions, whereas a number of indicator species of group D are usually linked to open habitats. The indicator species of group B are related to nitrogen-rich soils.
Tab. 3 - Indicator species for the four groups of stands identified by cluster analysis of vascular plant communities recorded in thirty-two 100 m2 plots in secondary Robinia forests in Veneto (north-eastern Italy). (r.g): indicator value; (A): n=13; (B): n=10; (C): n=3; (D): n=6.
| Group | Species (code) | r.g | p-value |
|---|---|---|---|
| A | Tamus communis (Tamcom) | 0.741 | 0.003 |
| Ulmus minor (Ulmmin) | 0.652 | 0.015 | |
| Cornus mas (Cormas) | 0.630 | 0.009 | |
| Viola alba (Vioalb) | 0.559 | 0.035 | |
| Fraxinus ornus (Fraorn) | 0.533 | 0.034 | |
| Viola hirta (Viohir) | 0.508 | 0.047 | |
| B | Sambucus nigra (Samnig) | 0.688 | 0.003 |
| Parietaria officinalis (Paroff) | 0.678 | 0.007 | |
| Hedera helix (Hedhel) | 0.605 | 0.008 | |
| C | Galeopsis pubescens (Galpub) | 0.739 | 0.008 |
| Acer pseudoplatanus (Acepse) | 0.708 | 0.005 | |
| Geum urbanum (Geuurb) | 0.638 | 0.009 | |
| Castanea sativa (Cassat) | 0.626 | 0.01 | |
| Duchesnea indica (Ducind) | 0.577 | 0.011 | |
| Ostrya carpinifolia (Ostcar) | 0.48 | 0.032 | |
| D | Bromus sterilis (Broste) | 0.917 | 0.001 |
| Galium aparine (Galapa) | 0.761 | 0.001 | |
| Geranium rotundifolium (Gerrot) | 0.585 | 0.009 | |
| Ranunculus bulbosus (Ranbul) | 0.522 | 0.036 | |
| Poa trivialis (Poatri) | 0.513 | 0.042 |
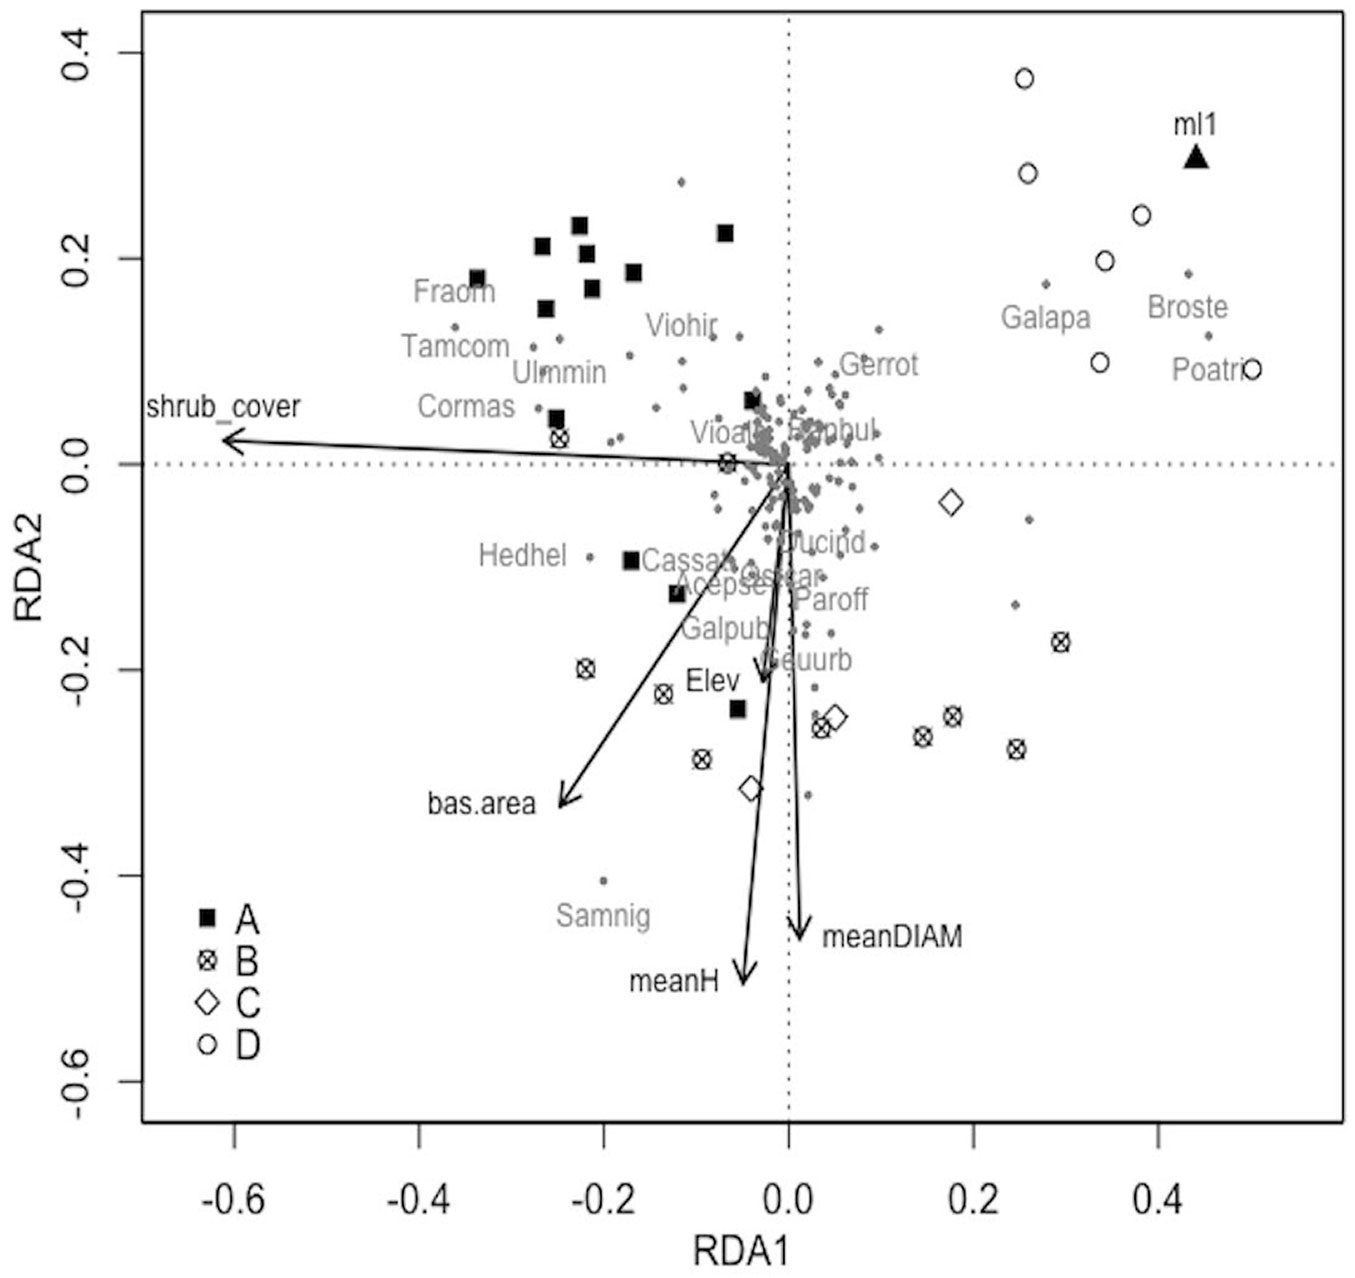
In the RDA analysis all factors explained 60% of variance (constrained fraction) in species composition (R2adj=0.11) and the model resulted significant (p=0.004).
Results of RDA analysis (Fig. 3) showed that six predictors significantly (p<0.05) influence plant communities in secondary Robinia stands: elevation (p=0.039), vertical stratification (p=0.023), shrub cover (p=0.005), mean diameter (p=0.026), mean height (p=0.015) and basal area (p=0.042). Vertical stratification, in terms of single layer woodlands (ml1), was important for shaping communities associated to Bromus sterilis, Galium aparine, and Poa trivialis, all species associated to group D. Shrub cover was instead more related to Fraxinus ornus, Crataegus monogyna, Cornus mas, Prunus mahaleb, Ligustrum vulgare and Hedera helix that were found in group A and some stands of group B. Elevation, mean diameter, mean height and basal area were related to Sambucus nigra, Corylus avellana, Lamium orvala and Alliaria petiolata mainly in group B but also in group A and C.
Fig. 3 - RDA ordination diagram (axis I: 12% expl. var.; axis II: 7% expl. var.) of vascular plant species in the secondary Robinia forests. Stands are reported according to their inclusion in one of the four groups identified by cluster analysis (A: black filled quadrat; B: cross in a circle; C: empty rotated quadrat; D: empty circle). Species are shown with grey dots and codes for indicator species are reported (Tamus communis: Tamcom; Ulmus minor: Ulmmin; Cornus mas: Cormas; Viola alba: Vioalb; Fraxinus ornus: Fraorn; Viola hirta: Viohir; Sambucus nigra: Samnig; Parietaria officinalis: Paroff; Hedera helix: Hedhel; Galeopsis pubescens: Galpub; Acer pseudoplatanus: Acepse; Geum urbanum: Geuurb; Castanea sativa: Cassat; Duchesnea indica: Ducind; Ostrya carpinifolia: Ostcar; Bromus sterilis: Broste; Galium aparine: Galapa; Geranium rotundifolium: Gerrot; Ranunculus bulbosus: Ranbul; Poa trivialis: Poatri). Only six predictors significantly explaining community composition are reported with black arrows (shrub layer cover: shrub_cover; basal area: bas.area; mean height: meanH; mean diameter: meanDIAM; elevation: Elev) and black triangle (vertical stratification/single layer). For further information see Tab. 1.
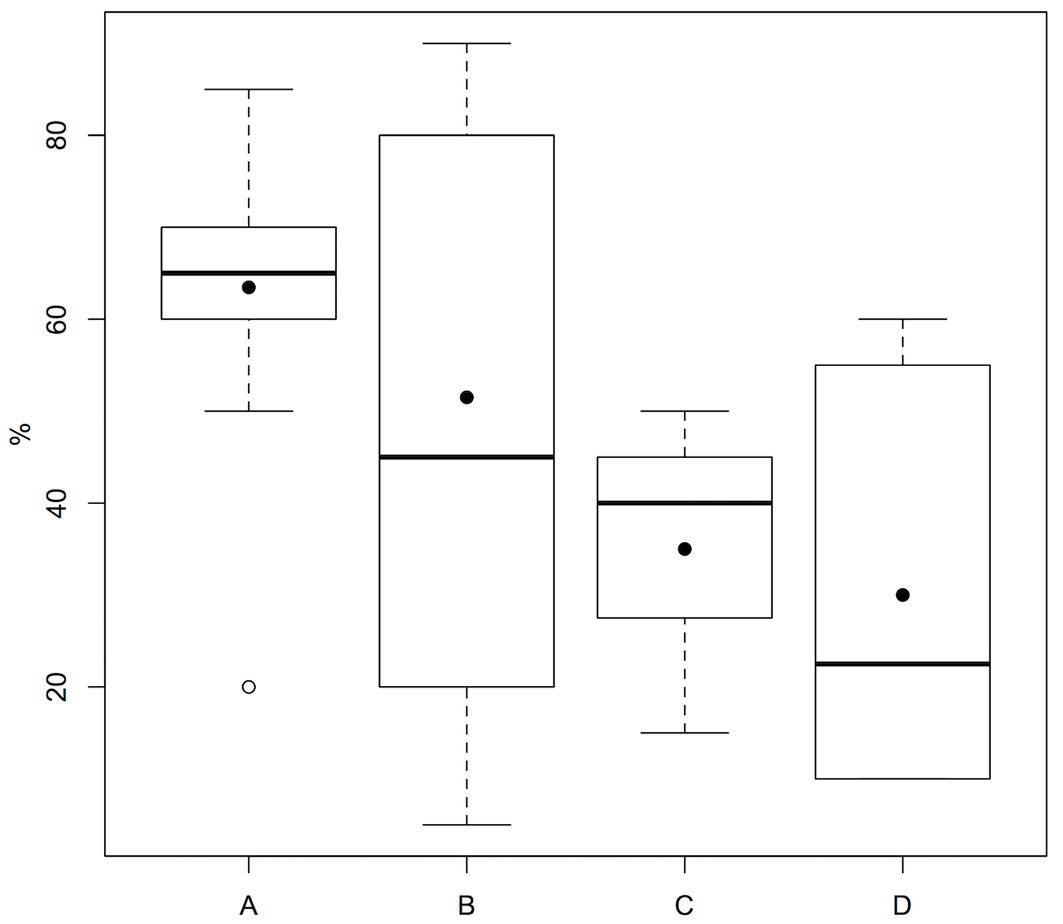
Pairwise comparisons allowed to better understand the effects of the single factors. We have reported results only for the factor found to differ statistically between two groups, with shrub cover statistically higher in group A than in D (p=0.034 - Fig. 4).
Fig. 4 - Comparison of shrub cover between the four groups identified by cluster analysis (black dots indicate mean values). For further information on groups see Tab. 2.
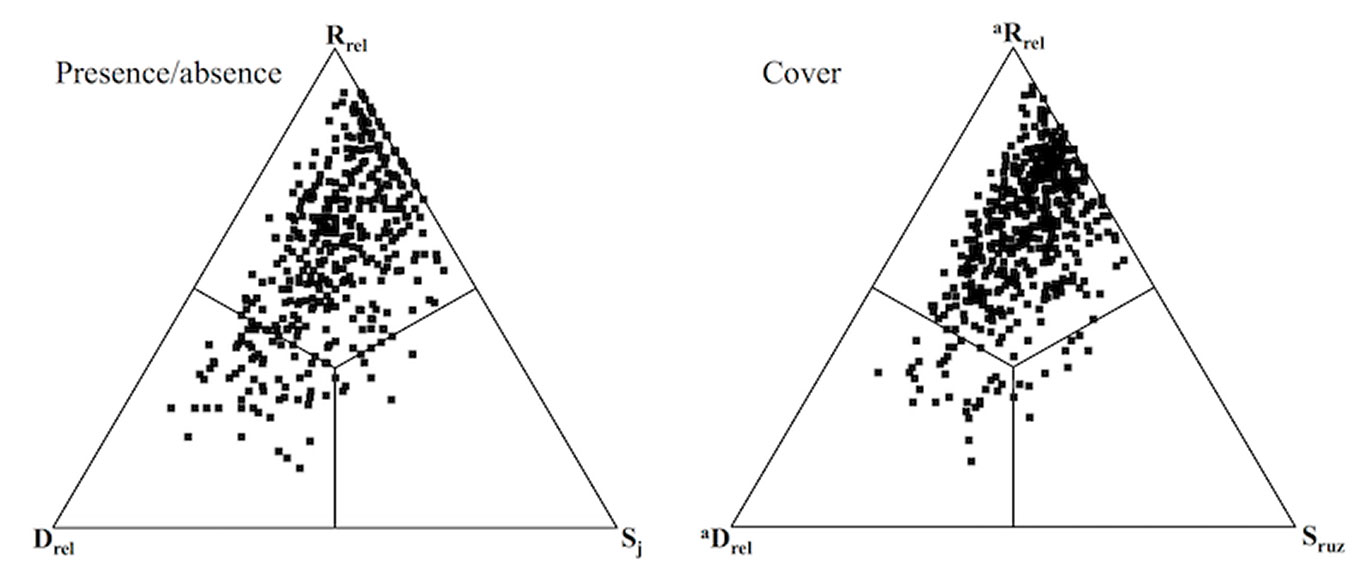
Results of the SDR analysis (on 496 pairs) were consistent between the presence/absence and cover datasets (Fig. 5). In both cases, replacement was the main component (mean %: Rrel= 57.86; aRrel= 61.34) with relatively high values of β-diversity indicated by a low proportion of similarity (mean %: Sj= 20.62; Sruz= 21.26). Furthermore, contributions of richness and abundance difference (mean %: Drel= 21.53; aDrel= 17.44) were similar to that of compositional similarity.
Fig. 5 - SDR simplex ternary plots with presence/absence (left) and cover data (right). (Sj): Jaccard similarity; (Rrel): species replacement; (Drel); richness difference; (Sruz): Ružička similarity; (aRrel): abundance replacement; (aDrel): abundance difference. All quadrats represent pair-wise comparison between Robinia stands.
Discussion
Our study assigned plant communities of secondary Robinia forests growing on abandoned sites to different phytosociological units, including vegetation types related to both open and shaded conditions and to nitrogen-rich soils. These plant communities were surprisingly heterogeneous, depending on a gradient of environmental and stand structure factors. The analysis of β-diversity components indicated that the observed compositional differences are mainly related to the process of species replacement, rather than to richness differences among stands.
Patterns and drivers of plant community composition
This study deepens our knowledge on plant communities and the main drivers of their composition patterns in secondary Robinia forests on abandoned land. Robinia spontaneously expanding on abandoned areas can form dense stands strongly dominated by this species ([33]) or with a minor presence of a small number of tree species as in our study, both native and alien. The class Robinietea Jurko ex Hadac & Sofron 1980 is certainly acknowledged in Italy and described as a “anthropogenic, neophytic forest vegetation dominated by Robina pseudoacacia, with a herb layer rich in nitrophilous species, often referred to the classes Artemisietea vulgaris and Galio aparines-Urticetea dioicae” ([4]). It is a common practice to describe communities dominated by Robinia referring to differential species of several orders, like Prunetalia, Fagetalia sylvaticae and Quercetalia pubescenti-petraeae ([47]).
In our case study, certain stands were strongly separated based on species of different syntaxa indicating a high compositional variability. The presence of species related to different syntaxa and different habitat conditions (open and shaded) is of importance for biodiversity conservation as these forests can occur in Natura 2000 protected European sites (9 plots within 3 sites in our study). In these cases, the occurrence of species linked to different habitat conditions could be prioritized for restoration activities. For instance, it could be possible to rely on the presence of species adapted to open conditions when the aim is to restore specific grasslands or carry out silvicultural interventions favouring native trees and species adapted to shaded habitats ([40]). Interestingly, Robinia stands may host vascular plants of particular importance; for example, rare native species such as vernal geophytes ([30]) or species of regulatory concern such as Ruscus aculeatus (listed in annex V of the Habitats Directive) in our secondary stands.
The environmental heterogeneity hypothesis of invasions predicts that heterogeneous conditions increase the success of alien species and reduce changes in native communities ([25]). Therefore, the observed variability in environmental and structural conditions could have favoured the invasion by Robinia and shaped the heterogeneity in species composition. This suggests that other factors shape understory communities rather than the Robinia invasion per se. This seems to be true in our case as we found that heterogeneity in structural (i.e., shrub cover, basal area and mean tree diameter) and environmental (i.e., elevation) conditions especially influence our secondary Robinia woodland plant communities. Shrub cover variation was already pointed out as an important factor shaping plant communities ([47], [41]). Denser shrub cover was linked to communities with species of the Quercus-Fagetea and Quercetea ilicis syntaxa; whereas single layer, less shaded forests have plant communities with many herbaceous species commonly found in open habitats (e.g., Poa trivialis, Bromus sterilis). As expected, most of these species are differential elements of Robinietea Jurko ex Hadac & Sofron 1980. Other factors related to shade, i.e. basal area and mean tree diameter, influenced these plant communities probably filtering for true forest species ([44]). Furthermore, elevation played a role in determining species composition, confirming the importance of this factor when studying plant communities ([5]).
Components of β-diversity: mechanisms structuring plant communities
Partitioning β-diversity was an informative approach to shed light on the influence of alien species on plant communities ([24]). This analysis reinforced the remarkably heterogeneous composition under Robinia as additionally suggested by the low contribution of similarity to γ-diversity ([29]). Species and cover replacement seems to be the main process ruling community assembly and explaining such heterogeneity. In plant communities under secondary Robinia forests species tend to replace each other most probably due to the reported effect of site and stand structure factors. According to Solar et al. ([43]) a high contribution of replacement supports the “landscape-divergence hypothesis” ([20]) . This hypothesis predicts that habitats diverge in community composition due to differences in disturbance outcomes or the interactions between heterogeneous environmental conditions and disturbance processes, here most likely linked to Robinia invasion, forest structure and environmental factors. Indeed, several pairwise comparisons highlighted a “perfect gradient”, i.e., cases of richness and abundance agreement with continuous partial replacement ([29], [28]), reinforcing the idea that site and stand structure factors may be important in driving community composition.
Conclusion
Robinia forests are plant communities forming a picturesque and, nowadays, typical landscape feature in European plain and hilly areas. Among these, secondary Robinia forests developing on abandoned land seem to be highly heterogeneous in vascular plant species composition. Our results indicate that the variability of environmental conditions in which these forests can be found and their heterogeneity in stand characteristics could explain the overall heterogeneity in plant community composition. The analysis of β-diversity components revealed that the mechanism causing this heterogeneity in community structure was mainly species and cover replacement.
Indeed, species replacement indicates that secondary Robinia forests can contribute to plant biodiversity at the landscape scale by hosting diverse plant communities. Specific environmental and stand factors, together with the presence of Robinia, can shape either degraded (e.g., nitrogen-rich) or valuable (e.g., with typical forest species) plant communities. Management and conservation actions such as the implementation of appropriate silvicultural measures ([40]) must take into account this heterogeneity, its drivers, and the major mechanisms determining the observed patterns.
Acknowledgments
TC and TS were supported by funding of the Project CPDA151999/15 from the Università degli Studi di Padova (Italy). The authors thank Alison Garside for editing the English text.
References
Online | Gscholar
Gscholar
Online | Gscholar
Gscholar
Gscholar
Online | Gscholar
CrossRef | Gscholar
Authors’ Info
Authors’ Affiliation
Juri Nascimbene
Giovanni Trentanovi
Tommaso Sitzia
Department of Land, Environment, Agriculture and Forestry, Università degli Studi di Padova, v.le dell’Università 16, 35020 Legnaro, PD (Italy)
Department of Biological, Geological, and Environmental Sciences, Università di Bologna, v. Irnerio 42, 40126 Bologna (Italy)
v. Gioberti 6, 36100, Vicenza (Italy)
Corresponding author
Paper Info
Citation
Campagnaro T, Nascimbene J, Tasinazzo S, Trentanovi G, Sitzia T (2018). Exploring patterns, drivers and structure of plant community composition in alien Robinia pseudoacacia secondary woodlands. iForest 11: 586-593. - doi: 10.3832/ifor2687-011
Academic Editor
Matteo Garbarino
Paper history
Received: Nov 15, 2017
Accepted: Jun 26, 2018
First online: Sep 25, 2018
Publication Date: Oct 31, 2018
Publication Time: 3.03 months
Copyright Information
© SISEF - The Italian Society of Silviculture and Forest Ecology 2018
Open Access
This article is distributed under the terms of the Creative Commons Attribution-Non Commercial 4.0 International (https://creativecommons.org/licenses/by-nc/4.0/), which permits unrestricted use, distribution, and reproduction in any medium, provided you give appropriate credit to the original author(s) and the source, provide a link to the Creative Commons license, and indicate if changes were made.

Web Metrics
Breakdown by View Type
Article Usage
Total Article Views: 50796
(from publication date up to now)
Breakdown by View Type
HTML Page Views: 41314
Abstract Page Views: 4256
PDF Downloads: 4000
Citation/Reference Downloads: 6
XML Downloads: 1220
Web Metrics
Days since publication: 2866
Overall contacts: 50796
Avg. contacts per week: 124.07
Article Citations
Article citations are based on data periodically collected from the Clarivate Web of Science web site
(last update: Jul 2026)
Total number of cites (since 2018): 17
Average cites per year: 1.89
Publication Metrics
by Dimensions ©
Articles citing this article
List of the papers citing this article based on CrossRef Cited-by.
Related Contents
iForest Similar Articles
Research Articles
Effects of black locust and black pine on extremely degraded sites 60 years after afforestation - a case study of the Grdelica Gorge (southeastern Serbia)
vol. 9, pp. 235-243 (online: 22 August 2015)
Review Papers
Breeding and improvement of black locust (Robinia pseudoacacia L.) with a special focus on Hungary: a review
vol. 16, pp. 290-298 (online: 28 October 2023)
Research Articles
Are Mediterranean forest ecosystems under the threat of invasive species Solanum elaeagnifolium?
vol. 14, pp. 236-241 (online: 10 May 2021)
Research Articles
Essential environmental variables to include in a stratified sampling design for a national-level invasive alien tree survey
vol. 12, pp. 418-426 (online: 01 September 2019)
Research Articles
Natural spread of Verticillium wilt as effective constraint on Ailanthus altissima invasion
vol. 18, pp. 391-398 (online: 22 December 2025)
Short Communications
Influences of Black Locust (Robinia pseudoacacia L.) afforestation on soil microbial biomass and activity
vol. 9, pp. 171-177 (online: 16 February 2015)
Research Articles
Assessing escapes from short rotation plantations of the invasive tree species Robinia pseudoacacia L. in Mediterranean ecosystems: a study in central Italy
vol. 9, pp. 822-828 (online: 25 May 2016)
Research Articles
Spatial and temporal variation of drought impact on black locust (Robinia pseudoacacia L.) water status and growth
vol. 8, pp. 743-747 (online: 18 June 2015)
Research Articles
Groundwater uptake of forest and agricultural land covers in regions of recharge and discharge
vol. 9, pp. 696-701 (online: 17 May 2016)
Research Articles
Allometric models for the estimation of foliage area and biomass from stem metrics in black locust
vol. 15, pp. 281-288 (online: 27 July 2022)
iForest Database Search
Search By Author
Search By Keyword
Google Scholar Search
Citing Articles
Search By Author
Search By Keywords
PubMed Search
Search By Author
Search By Keyword


