Groundwater uptake of forest and agricultural land covers in regions of recharge and discharge
iForest - Biogeosciences and Forestry, Volume 9, Issue 5, Pages 696-701 (2016)
doi: https://doi.org/10.3832/ifor1864-009
Published: May 17, 2016 - Copyright © 2016 SISEF
Research Articles
Abstract
Groundwater uptake of vegetation in discharge regions is known to play an important role, e.g., in the Hungarian Great Plain. Nevertheless, only little detailed monitoring of water table fluctuations and groundwater uptake (ETgw) were reported under varying hydrologic conditions and vegetation cover. In this study, results of water table monitoring under forest plantations and adjacent corn plots in discharge and recharge regions were analyzed to gain better understanding of the relation of vegetation cover to groundwater uptake. A poplar (Populus tremula) plantation and adjacent corn field plot were surveyed in a local discharge area, while a black locust (Robinia pseudoacacia) plantation and adjacent corn field plot were analyzed in a recharge area. The water table under the poplar plantation displayed a night-time recovery in the discharge region, indicating significant groundwater supply. In this case an empirical version of the water table fluctuation method was used for calculating the ETgw that included the groundwater supply. The mean ETgw of the poplar plantation was 3.6 mm day-1, whereas no water table fluctuation was observed at the nearby corn plot. Naturally, the root system of the poplar was able to tap the groundwater in depths of 3.0-3.3 m while the shallower roots of the corn did not reach the groundwater reservoir in depths of 2.7-2.8 m. In the recharge zone the water table under the black locust plantation showed step-like changes referring to the lack of groundwater supply. The mean ETgw was 0.7 mm day-1 (groundwater depths of 3.0-3.2 m) and similarly no ETgw was detected at the adjacent corn plot with groundwater depths between 3.2 and 3.4 m. The low ETgw of the young black locust plantation was due to the lack of groundwater supply in recharge area, but also the shallow root system might have played a role. Our results suggest that considerations should be given to local estimations of ETgw from water table measurements that could assist to better understanding of groundwater use of varying vegetation types in recharge and discharge zones.
Keywords
Groundwater, Evapotranspiration, Poplar, Black Locust, Recharge and Discharge Area
Introduction
Significant afforestation is planned in Hungary in the coming decades, supported by the European Union ([4]). The Hungarian Great Plain is one of the main target regions for afforestation ([15]) where the mean annual precipitation is less than 650 mm, thus the water demand of forests is often completed from the groundwater.
Discharge and recharge regions of groundwater can be identified by changes of water table levels with depth, surface water networks and vegetation patterns ([38], [39]). In discharge regions the net saturated flow of groundwater is directed upward. The water table is close to the surface, thus the vegetation often rely on the groundwater ([22], [27]). Recharge areas occur where the net saturated flow of groundwater is directed away from the water table ([14]). In these areas the groundwater is seldom available for the vegetation to transpire.
Evapotranspiration (ET) by local phreatophytic vegetation is one of the primary processes of natural groundwater discharge. In discharge regions the plants often meet their water demands partly directly from the groundwater via their root systems, thereby inducing a diel signal of the water table which is characterized by an early morning maximum and an afternoon minimum in the groundwater level ([26], [8], [37], [25]). The high ET of vegetation creates local depression of groundwater, which enhances the subsurface flow and further support the ET. In discharge regions, comparative groundwater ET studies showed a two- to three-fold difference in groundwater ET (ETgw) between forests and the nearby land cover ([36], [33], [19]). Schilling ([36]) studied three common riparian land covers (forest, corn and grass) using high-resolution water table measurements in Iowa (USA). ETgw of forest was found to be significantly higher in mid-July than that of the other land covers (1.6-2.2-fold in case of the corn and 2.1-3.5-fold in case of the grass). Móricz et al. ([33]) compared the water balance of different land uses (common oak and fallow) in the northeastern part of the Hungarian Great Plain. ETgw was three times higher in the oak forest than in the nearby fallow plot, estimated by high temporal resolution groundwater measurements. Gribovszki et al. ([19]) examined the effect of forests on groundwater ET in the Jászság region of the Hungarian Great Plain. The water table was about 0.5 m lower in the forest than under the pasture and the ETgw of the oak plot was more than twice (2.3-fold) as large.
In recharge areas where the deep-rooted vegetation is able to tap the groundwater, the typical diurnal water table fluctuation shows a stepped pattern. ET causes the water table to deepen during the day and then the water table remains relatively leveled or slightly deepens during the night. In such upland locations forests face a major threat by drought stress ([7], [2], [29]) due to climate change ([16]), especially where the roots of trees could hardly tap the groundwater reservoir.
The higher water consumption of forests compared to grasslands and short rotation crops leads to the reduction of water yield ([3], [23], [34]) and causes the drop of water table levels ([28]) especially at small catchment scale. However, at larger scales the plantation of additional forests should raise water availability downstream and intensify the hydrological cycle through increased precipitation in the interior of continents. For that reason, water resource management should consider not only the local effect of forests on discharge, but also the products water footprint, the value of ecosystem services, the drought mitigation strategies and the large-scale positive effect of forests on the climate ([13], [21], [11], [17]).
A wide range of methods for estimating the actual ET are available ([9]). The remote sensing based evapotranspiration method is cost effective, but captures the ET values on a scale of 1 km or larger for heterogeneous land cover; thus the ET of small forest patches, agricultural fields or pastures in recharge and discharge zones cannot be analyzed. Often the equipment for actual ET measurement either is not only expensive but also only point measurements are provided. A cost-effective approach for estimation of ETgw is the use of the diurnal groundwater fluctuations.
Although the importance of groundwater uptake in shallow water table environments of the riparian zones is indisputable, the groundwater uptake of plant communities is rarely studied under various hydrologic conditions ([36], [30]).
In this paper we analyzed the water table fluctuation and the ETgw of different vegetation covers (forest vs. agricultural land) in recharge and discharge zones using the diurnal groundwater fluctuation. The novelty of our approach was the employment of different estimation methods for the discharge and recharge areas. Our research focused on the following questions: (1) how water table depth varies over the course of a day under different vegetation types in discharge and recharge areas? (2) How can the groundwater consumption be estimated in these areas? and (3) What are the magnitude of ETgw under different vegetation types?
Materials and methods
Site description
In the frame of a national project (OTKA NN 79835 project), 108 plots of forested and nearby non-forested sites were investigated. In this paper two pairs of neighboring plots were compared in the Hungarian Great Plain in May-June of 2014. One study site is situated close to Nyírbogát (47 47′ N, 22 01′ E), where a 26-year-old poplar (Populus tremula) forest (GW well F2, sparse plantation: 312 trees ha-1, mean diameter: 0.297 m, height: 22.1 m) was analyzed in parallel with a corn field (GW well F3). The other study site is located near to Jászjákóhalma (47 31′ N, 20 01′ E), where a 12 years old black locust (Robinia pseudoacacia) forest (GW well F6, dense plantation: 8900 trees ha-1, mean diameter: 0.129 m, height: 11.4 m) and a nearby corn field (GW well F7) were compared (Fig. 1).
Fig. 1 - Map of land use, elevation and location of monitoring plots with GW wells. Poplar plot well is indicated by F2, black locust plot well by F6 and the corn plots by F3 and F7.
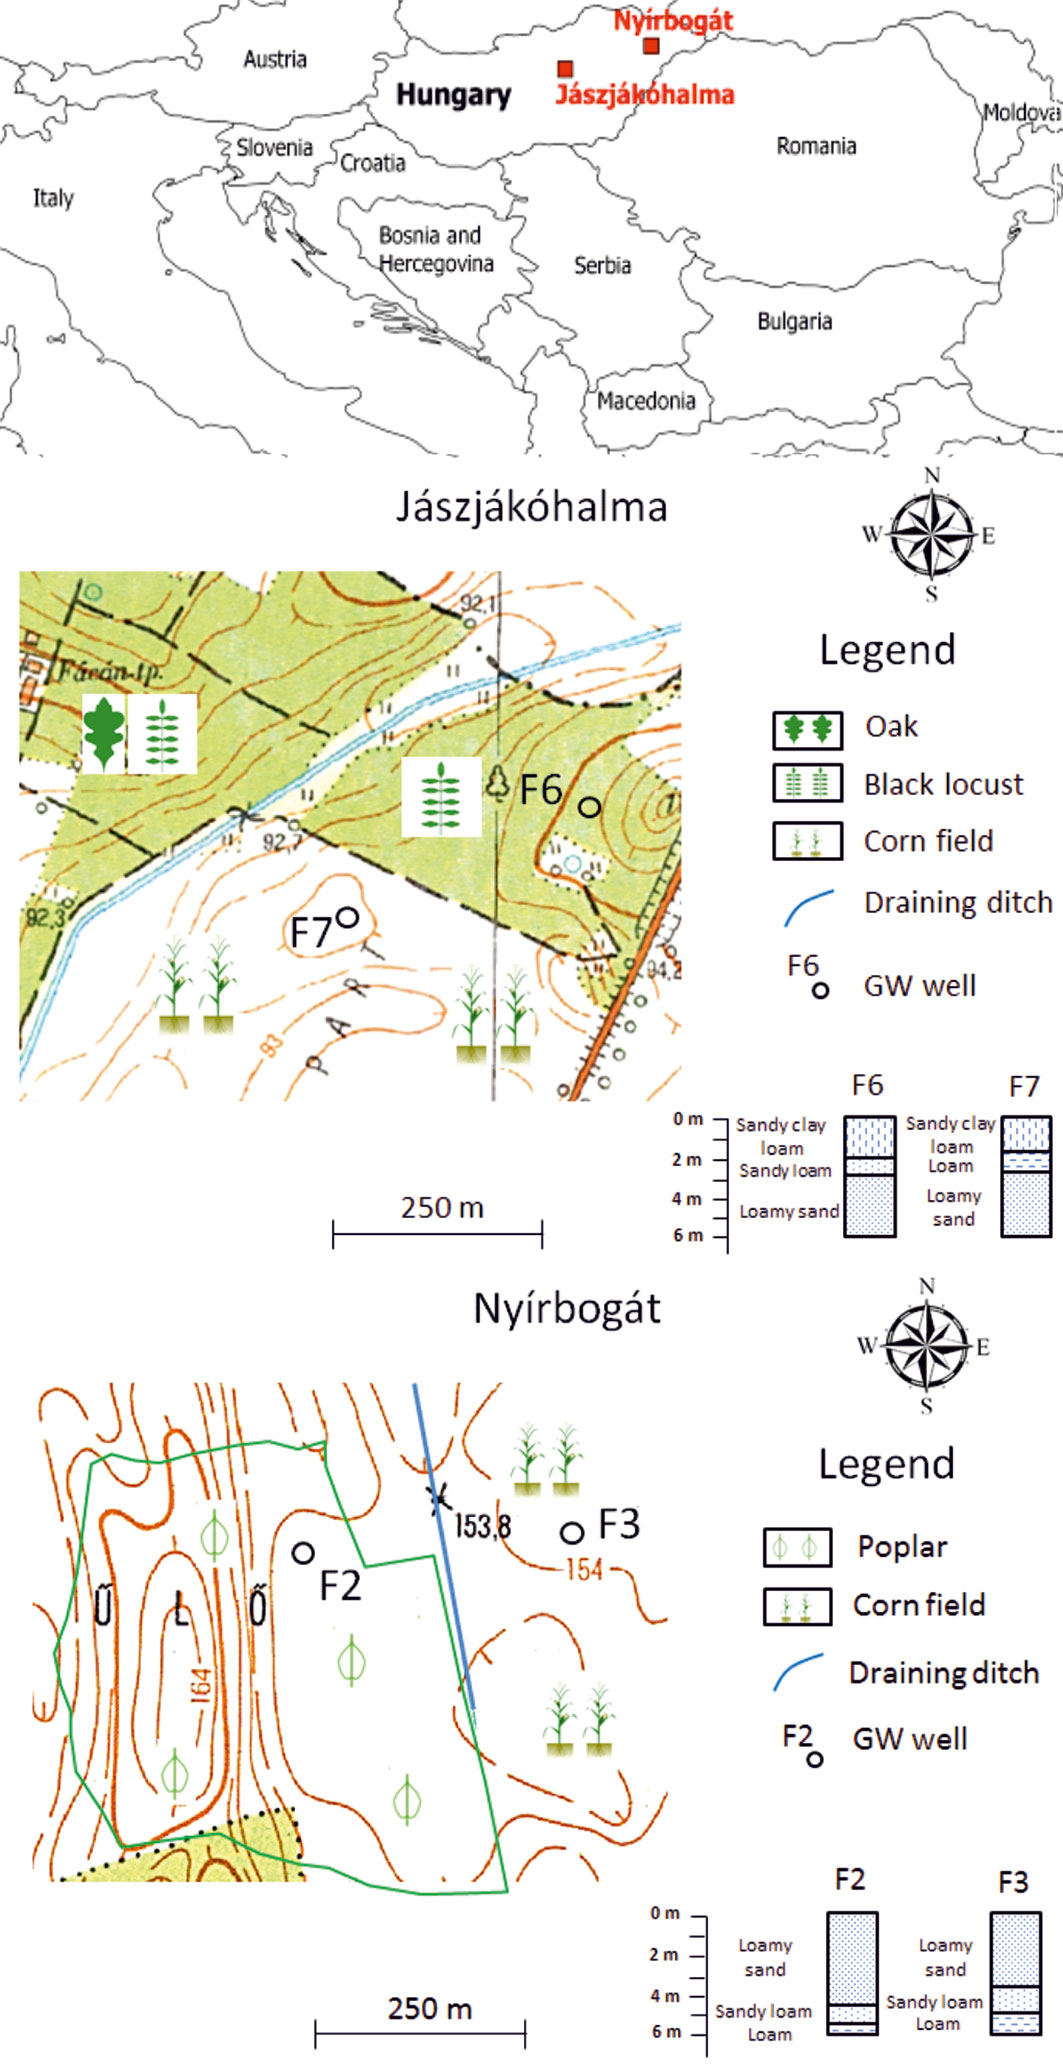
The area of Nyírbogát is built up from sandy river deposits of the early Pleistocene ([6]), but the sand was transported by wind (fluvio-eolian relief) ([5]). Both plots (wells F2 and F3) are situated in a local discharge zone, surrounded by higher elevation. Not only the geomorphology and the nearby draining ditch, but also the presence of phreatophytic vegetation indicate the discharge character of these plots. Historically (in the first half of the 20th century) the area of the present poplar forest was grassland, then it was afforested and the preceding tree species was grey poplar (Populus × canescens) which was logged in 1988.
In contrast the Jászjákóhalma plots (wells F6 and F7) are located in local recharge zone, 3-4 m above the depression of the nearby draining ditch. The geological basis of this area is fluvial sediments, mainly sand and silt (Fig. 1), in some areas re-transported by wind. The area of the black locust plot was grassland in the first half of the 20th century, then it was transformed into agricultural land and finally it was afforested with black locust 12 years ago.
Data collection
Meteorological conditions and groundwater level were monitored by automatic equipments. The weather stations (Vantage Pro2®, Davis Instruments Co., Hayward, CA, USA) recorded standard meteorological parameters (air temperature, relative humidity, global radiation, wind speed and precipitation) every five minutes. Groundwater wells were installed in each plot (F2, F3, F6, F7) with depth of 6 meters. Groundwater levels were measured by vented pressure transducers (Dataqua Elektronikai Kft., Balatonalmádi, Hungary) with time interval of 15 min.
At each site the mineral soil was sampled with 20 cm intervals down to 100 cm depth and with 50 cm intervals down to the full depth of the wells. Soil texture was determined using grain size distribution measured by the pipette method.
Evapotranspiration calculation
Diurnal signal of groundwater levels can be detected in areas with shallow groundwater depths due to the daily changes of transpiration during vegetation periods ([40], [20]). The amplitude of the signal is determined by the soil texture and magnitude of groundwater uptake. ETgw was estimated from groundwater level readings for each plot.
In case of the groundwater discharge area (Nyírbogát) the empirical version of a technique was applied ([18]), based on the White-method ([40]). The proposed method obtained the highest correlation with evapotranspiration measured at a groundwater lysimeter ([12]).
The fundamental assumption was that the groundwater supply per unit area (Qnet) changes over the day. The maximum value of Qnet was calculated for each day by selecting the largest positive time-rate of change value in the groundwater level readings, while the minimum was obtained by computing the mean of the smallest time-rate of change in the predawn hours, by multiplying it by the value of Sy (see below). The values of the minimum and maximum Qnet then were assigned to the locations of the groundwater level extremes. Spline interpolation was applied to interpolate the missing values between the minimum and maximum values.
The ETgw rates were obtained as follows (eqn. 1):
where Qnet [L3T-1] is the net groundwater supply, WT [L] is the average groundwater level, t is the time, Sy is the readily available specific yield ([26]), which denotes the amount of water released from the vadose zone during the time frame (<12 hours) of the diurnal fluctuations.
In the groundwater recharge area (Jászjákóhalma) where a step-like pattern of water table was observed, the following formula may be well suited for estimating ETgw (eqn. 2):
The readily available specific yield was estimated from soil texture data. According to the trilinear diagram of Loheide et al. ([26]), Sy varied between 0.21 and 0.28. Following Meyboom ([31]) the Sy values were halved to consider the effect of time for drainage.
Rainfall events affect the groundwater uptake estimation through evaporation of intercepted rainfall from the canopy and evaporation loss from topsoil. These days were excluded since neither the rainfall interception nor the soil water content changes of the topsoil were measured.
The reference evapotranspiration of Allen et al. ([1]) was calculated using the measured meteorological parameters for grass surface. The estimated ET values were used to calculate correlations with the estimated groundwater uptake values. The strength of the correlations showed the importance of groundwater use.
Results and discussion
Water table fluctuations and groundwater supply
During the study period the precipitation was only 30-50% of the average precipitation sum of May and June in both study sites (Fig. 2).
Fig. 2 - Groundwater depths from the surface. Poplar forest (GW well F2) and nearby corn site (GW well F3) in Nyírbogát (A) and the black locust forest (GW well F6) and nearby corn site GW well F7) in Jászjákóhalma (B) (09.05.2014 - 31.06.2014).
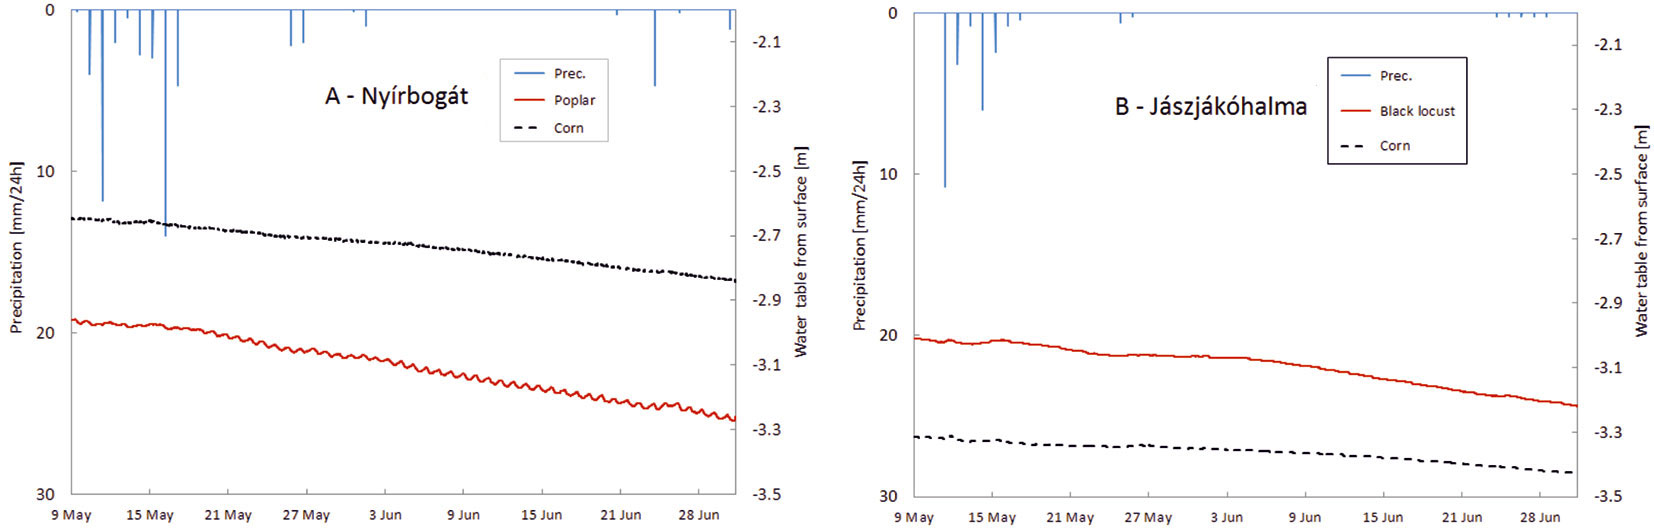
The water table depression in Nyírbogát (0.37 m) was similar to the water drop observed by Móricz et al. ([33]) in the Nyírség region (about 0.5-0.6 m) while there was no observable depression under the young black locust plantation, probably due to its shallow rooting depth ([24] - Fig. 2).
In both regions the water table sank considerably more under the forest plantations (poplar: 0.15 m month-1; black locust: 0.125 m month-1) than under the corn plots (GW well F3: 0.1 m month-1; GW well F7: 0.075 m month-1).
In the discharge area the water table under the poplar plantation (GW well F2) increased at night, which combined with the daytime ET draw-down signal, producing the diurnal pattern observed in the hydrograph (Fig. 3). The night-time recovery of the water table was probably due to the upwelling from the aquifer enhanced by the plant draw-down of groundwater. The amplitude of daily water table fluctuation for the poplar was about 1 cm in the study period. Maximum and minimum groundwater levels were measured around 6 AM and 18 PM respectively. There was no systematic observed diurnal water table fluctuation under the corn plot (GW well F3), since the roots of the corn could not tap the water table.
Fig. 3 - Diurnal fluctuations of water table levels of the poplar (GW well F2) and the black locust (GW well F6) plots.
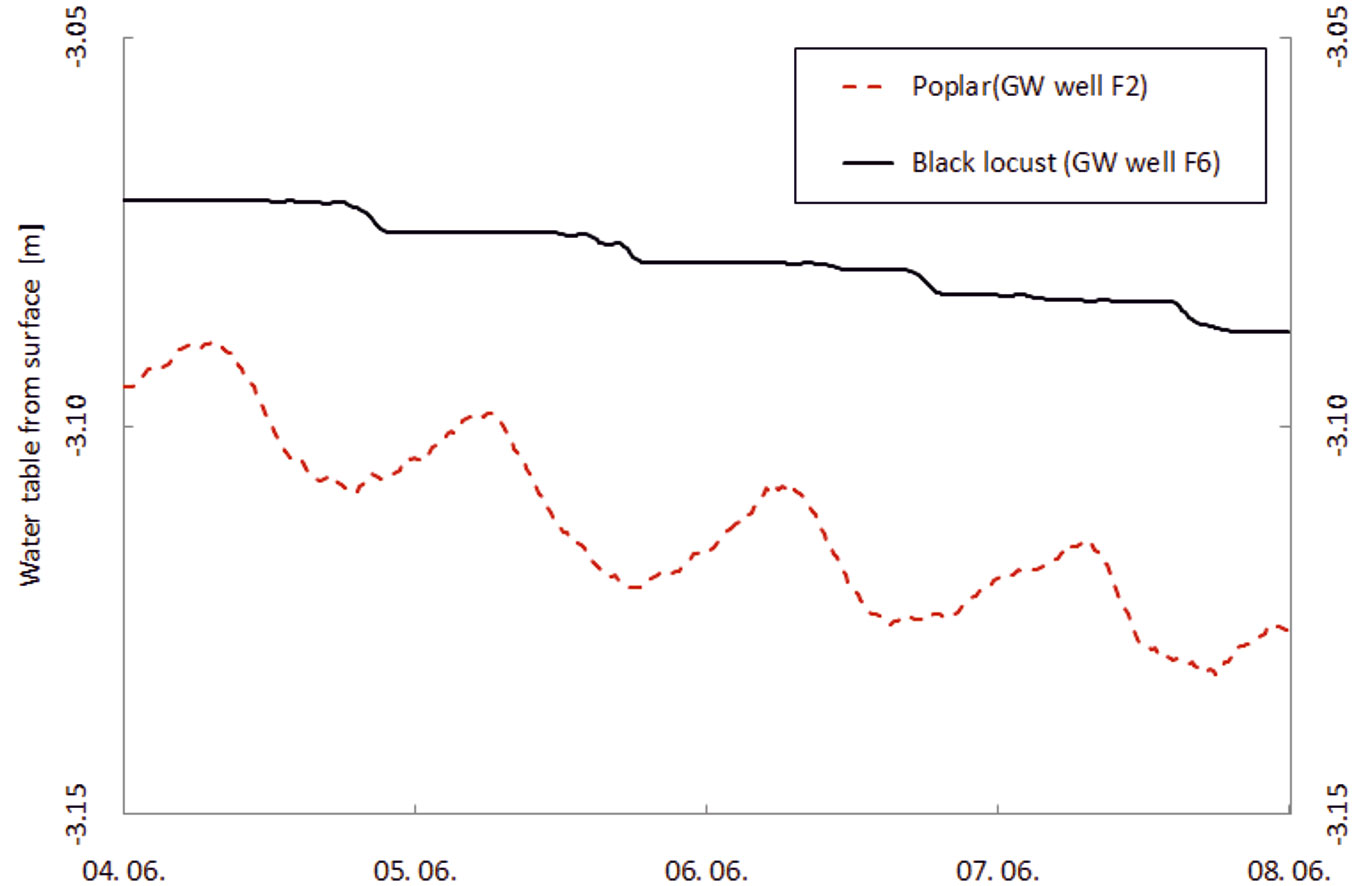
In the recharge area the diurnal fluctuation under the black locust forest (GW well F6) was considerably different showing clear step changes (about 0.4 cm). The lack of night-time recovery of water table meant that there was no net water supply, but the roots of the trees could tap the groundwater table for evapotranspiration (Fig. 3). The lack of any signal under the corn plot (GW well F7) indicated that the roots of the corn could not use the groundwater for evapotranspiration.
It should be noted that the shape of the observed water table fluctuation is suitable to decide whether a particular location acts as a recharge or discharge zone. However, the groundwater zones are not only spatially variable but are also changing in time. The recharge area could transform to discharge area and vice versa due to changes in water table depth, land cover and climate. For instance afforestation of a recharge zone may cause a water table depression, thereby inducing groundwater supply from the adjacent regions that is characteristic of the discharge zones.
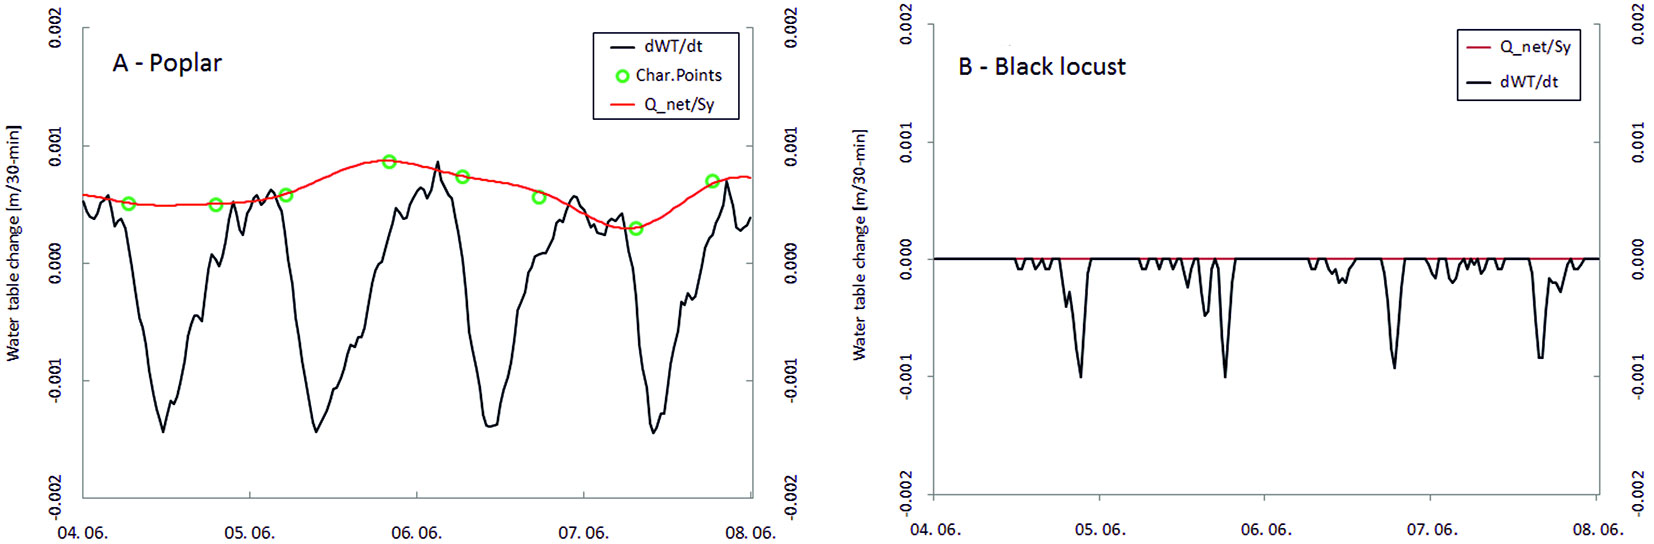
The net groundwater supply displayed a significant daily fluctuation changing between 0.04 and 0.1 mm/30 min under the poplar plot (GW well F2). In case of the black locust (GW well F6) there was no observed groundwater supply during night hours (Fig. 4). The readily available specific yield values (Sy) presented an uncertainty for the calculations. We used the soil texture to estimate a constant Sy, but it is known from previous research that Sy can be highly variable with water table depth ([10]).
Fig. 4 - Net groundwater supply rate (Qnet) and water table change. Qnet is divided by Sy, the readily available specific yield (Qnet/Sy), water table change (dWT/dt) and characteristic points of Qnet in the poplar (GW well F2 - A) and black locust (GW well F6 - B) plots.
Groundwater evapotranspiration of the poplar and the black locust plantations
The calculated daily groundwater evapotranspiration of the poplar and black locust plantations were compared to PM_ET (Penman-Monteith reference evapotranspiration) for a period in May-June in 2014 (Fig. 5).
Fig. 5 - Daily ET rates of the poplar (GW well F2) and black locust (GW well F6) plantations.
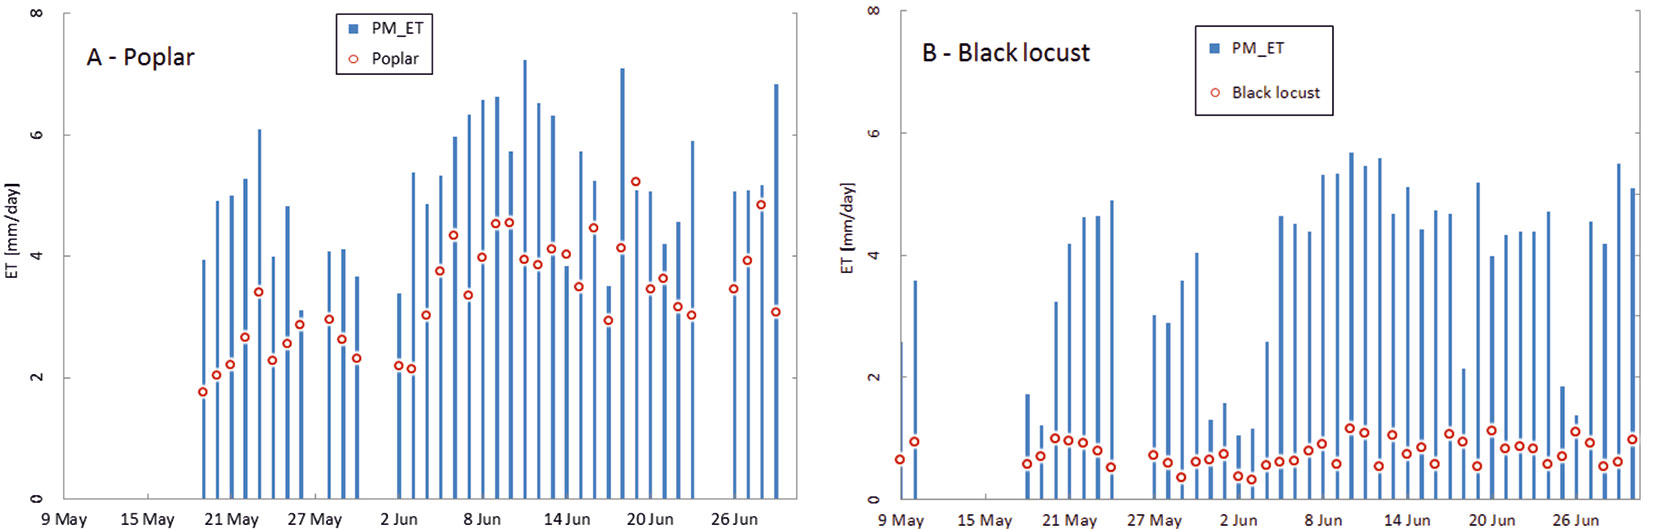
Significant daily water table fluctuation suggested a substantial groundwater consumption of the poplar plantation of Nyírbogát. The ETgw of the poplar (mean ET rate: 3.6 mm day-1) plantation was about 65% of the potential evapotranspiration, calculated for the grass reference surface (5.18 mm day-1). On some days the groundwater ET was almost as high as the reference ET (calculated for a grass reference surface) showing that the higher leaf area index and canopy conductance of the forest canopy induced higher actual ET. The average ET of the black locust plantation was only 0.73 mm day-1, which was about 20% of the calculated daily potential ET (3.67 mm day-1).
The groundwater consumption of the studied plantations was less than observed in the various studies of the region, probably due to lower leaf area index and rooting depth. Gribovszki et al. ([19]) determined a 7.5 mm day-1 mean ET rate for a 60 year old oak forest close to Jászjákóhalma in the Jászság region in the exceptionally dry year 2012. The high ET values of that study were the result of the large atmospheric and canopy conductance of that forest plot. In the Northeastern part of the Hungarian Lowland Móricz ([32]) measured groundwater consumption up to 5.8 mm day-1 for a 60 year old oak forest in a shallow water table (between 1.3 and 2.5 m deep) environment. In the central part of the Hungarian Lowland Nosetto et al. ([35]) determined a 1.9 mm day-1 (up to 3.2 mm day-1) groundwater ET for an oak forest. In that study the water table was lower (mean: 5 m) and the study period was in autumn.
The correlation coefficient between the reference ET and groundwater ET was not high at either plot (Tab. 1), but was statistically significant. Although there were not any soil moisture measurements available, the medium strong correlation of the poplar showed that the groundwater ET was under the potential ET indicating notable soil moisture also available for transpiration. In case of the black locust the weaker correlation referred to the relatively shallow rooting depth and the recharge of the young plantation.
Tab. 1 - Correlation coefficients (r) between reference ET and estimated ETgw values. (*): Correlation is significant at the 0.1 level (two-tailed); (**): correlation is significant at the 0.01 level (two-tailed).
| Plot | r |
|---|---|
| Poplar (GW well 2) | 0.49** |
| Black locust (GW well 6) | 0.35* |
Conclusions
ETgw of forest covers (poplar and black locust plantations) and adjacent corn-field plots were compared in discharge and recharge zones in the Hungarian Great Plains during a two-month period in 2014.
In the discharge zone the water table under the poplar plantation showed a diurnal pattern with night-time recovery. The roots of the poplar trees were able to reach the groundwater, thereby creating a water table depression and inducing groundwater supply in depths of 3.1-3.3 m. We applied a water table fluctuation method to estimate ETgw that incorporated the daily changes of groundwater supply. The mean ETgw of the poplar plantation was about 3.6 mm day-1. Contrary, the shallow roots of nearby corn field could not tap the groundwater, therefore neither daily groundwater fluctuation nor ETgw were detected.
The water table under the black locust plantation in the recharge zone displayed a step-like pattern, indicating the lack of night-time recovery of water table in similar water table depths of the poplar forest. ETgw was simply calculated using the observed water table changes and specific yield without the inclusion of the groundwater supply. The mean ETgw of the black locust plantation was 0.7 mm day-1, indicating the ability of groundwater extraction despite the upland location and the shallow rooting depth. Similarly to the discharge zone, ETgw was zero in the adjacent corn field.
This study indicates that local estimations of ETgw from simple water table measurements could assist to better understanding of groundwater use of varying vegetation types in recharge and discharge zones.
Acknowledgements
The research was supported by a fund from OTKA (NN 79835), the Postdoctoral Research Program of HAS No. PD-029/2015 and “Agrárklíma.2”(VKSZ_12-1-2013-0034).
References
Gscholar
CrossRef | Gscholar
Gscholar
Gscholar
CrossRef | Gscholar
Gscholar
Gscholar
Gscholar
Gscholar
Gscholar
Gscholar
Gscholar
Gscholar
Gscholar
Gscholar
Gscholar
Gscholar
Gscholar
Gscholar
Gscholar
Gscholar
Gscholar
Authors’ Info
Authors’ Affiliation
András Szabó
Ervin Rasztovits
Forest Research Institute, National Agricultural Research and Innovation Centre, Sárvár (Hungary)
Kitti Balog
Institute for Soil Sciences and Agricultural Chemistry, Centre for Agricultural Research, Hungarian Academy of Sciences, Budapest (Humgary)
Institute of Geomatics and Civil Engineering, University of West Hungary, Sopron (Hungary)
Corresponding author
Paper Info
Citation
Móricz N, Tóth T, Balog K, Szabó A, Rasztovits E, Gribovszki Z (2016). Groundwater uptake of forest and agricultural land covers in regions of recharge and discharge. iForest 9: 696-701. - doi: 10.3832/ifor1864-009
Academic Editor
Tamir Klein
Paper history
Received: Sep 08, 2015
Accepted: Jan 19, 2016
First online: May 17, 2016
Publication Date: Oct 13, 2016
Publication Time: 3.97 months
Copyright Information
© SISEF - The Italian Society of Silviculture and Forest Ecology 2016
Open Access
This article is distributed under the terms of the Creative Commons Attribution-Non Commercial 4.0 International (https://creativecommons.org/licenses/by-nc/4.0/), which permits unrestricted use, distribution, and reproduction in any medium, provided you give appropriate credit to the original author(s) and the source, provide a link to the Creative Commons license, and indicate if changes were made.

Web Metrics
Breakdown by View Type
Article Usage
Total Article Views: 52216
(from publication date up to now)
Breakdown by View Type
HTML Page Views: 43082
Abstract Page Views: 3365
PDF Downloads: 4442
Citation/Reference Downloads: 37
XML Downloads: 1290
Web Metrics
Days since publication: 3708
Overall contacts: 52216
Avg. contacts per week: 98.57
Article Citations
Article citations are based on data periodically collected from the Clarivate Web of Science web site
(last update: Mar 2025)
Total number of cites (since 2016): 4
Average cites per year: 0.40
Publication Metrics
by Dimensions ©
Articles citing this article
List of the papers citing this article based on CrossRef Cited-by.
Related Contents
iForest Similar Articles
Research Articles
Effects of black locust and black pine on extremely degraded sites 60 years after afforestation - a case study of the Grdelica Gorge (southeastern Serbia)
vol. 9, pp. 235-243 (online: 22 August 2015)
Research Articles
Comparative water balance study of forest and fallow plots
vol. 5, pp. 188-196 (online: 02 August 2012)
Research Articles
Allometric models for the estimation of foliage area and biomass from stem metrics in black locust
vol. 15, pp. 281-288 (online: 27 July 2022)
Research Articles
Spatial and temporal variation of drought impact on black locust (Robinia pseudoacacia L.) water status and growth
vol. 8, pp. 743-747 (online: 18 June 2015)
Research Articles
Links between phenology and ecophysiology in a European beech forest
vol. 8, pp. 438-447 (online: 15 December 2014)
Research Articles
Evaluation of fast growing tree water use under different soil moisture regimes using wick lysimeters
vol. 6, pp. 190-200 (online: 08 May 2013)
Review Papers
Breeding and improvement of black locust (Robinia pseudoacacia L.) with a special focus on Hungary: a review
vol. 16, pp. 290-298 (online: 28 October 2023)
Short Communications
Influences of Black Locust (Robinia pseudoacacia L.) afforestation on soil microbial biomass and activity
vol. 9, pp. 171-177 (online: 16 February 2015)
Short Communications
Stomata morphological traits in two different genotypes of Populus nigra L.
vol. 8, pp. 547-551 (online: 16 September 2014)
Research Articles
Thermo-modified native black poplar (Populus nigra L.) wood as an insulation material
vol. 14, pp. 268-273 (online: 29 May 2021)
iForest Database Search
Search By Author
Search By Keyword
Google Scholar Search
Citing Articles
Search By Author
Search By Keywords
PubMed Search
Search By Author
Search By Keyword


