SimHyb: a simulation software for the study of the evolution of hybridizing populations. Application to Quercus ilex and Q. suber suggests hybridization could be underestimated
iForest - Biogeosciences and Forestry, Volume 11, Issue 1, Pages 99-103 (2018)
doi: https://doi.org/10.3832/ifor2569-011
Published: Jan 31, 2018 - Copyright © 2018 SISEF
Research Articles
Collection/Special Issue: INCOTW - Sassari, Italy (2017)
International Congress on Cork Oak Trees and Woodlands
Guest Editors: Piermaria Corona, Sandro Dettori
Abstract
We present SimHyb, a Java-based software for the simulation of mixed hybridizing populations. The software incorporates user-defined initial parameters and input files to account for the initial census size of two species in a closed population, the number of intermediate specific classes, the directional fertility among specific classes, the fitness coefficients for each specific class, the inheritance of fitness, and the degree of ageing and self-incompatibility of the individuals. All these demographic and adaptive parameters can be modified by the user to analyze their effect on the evolution of the mixed population. SimHyb allows the traceability of each individual, whose pedigree is also recorded. For each simulated generation the software yields an output file that is easily convertible to an input for Structure, one of the most popular softwares for the Bayesian analysis of populations. Application of SimHyb to simulate Quercus ilex and Q. suber hybridizing populations, and further analysis with Structure, reveals that advanced introgressed individuals are very often misclassified with the currently available set of nuclear microsatellite markers, so that introgression between these two species could have been underestimated in previous studies. However, we provide a simple parameter based on Structure results to identify the directionality of pollination in the progeny of a known mother tree.
Keywords
Hybridization, Introgression, Simulations, Molecular Markers, Quercus suber, Quercus ilex
Introduction
Hybridization and introgression have presumably played a key role in the evolution of plants and, probably to a minor extent, of animals ([9]). Gene transfer can provide the hybridizing species with new adaptive skills, making them able to endure new environmental stresses or to colonize new habitats ([15], [12]), or can even lead to the appearance of new species ([16]). Identification of hybrid individuals has traditionally been based on phenotypic characters. However, such identification is not always obvious, and in the last decades genetic information based on molecular markers has been used for this purpose. Depending on the molecular marker of choice, inferences about evolutionary or population processes can be obtained at different time scales. Molecular markers from organellar DNA have been successfully used to infer ancient hybridization in plants, for instance, in the case of Quercus ilex and Q. suber ([4], [6], [7]). Nuclear molecular markers combined with Bayesian approaches have been used for the identification of hybrid individuals in populations, according to the posterior probability of each individual to belong to any of the parental species genetic clusters. This approach was applied by Burgarella et al. ([2]) in sympatric Q. ilex - Q. suber populations, estimating a current introgression rate of <2%. Later on, this procedure has been applied in studies for many other species, including animals ([10], [1], [8]).
Before proceeding to the quantification of introgression rates, the detection power and accuracy of the set of markers used to identify hybrid individuals needs to be estimated. According to this detection power, a threshold to classify a particular individual as a hybrid can further be established. This task is usually performed using virtual individuals whose actual specific category is accurately known. The aforementioned works usually employ software such as Hybridlab ([11]) for this purpose. In these types of programs, the generation of a virtual hybrid genotype is performed by drafting an allele from each genetic pool (parental species) at each locus, according to the specific allele frequencies provided by the user. The same procedure is followed to obtain F2 or backcrosses, considering the F1 hybrid pool as a parental species.
Here we present SimHyb, a software that follows a different approach, since it allows the simulation of the evolution of a mixed hybridizing population throughout generations, as well as the complete traceability of each individual pedigree. Thus, the expected contribution of each parental species to the genome of any individual is perfectly known. The program also allows the analysis of the effect of demographic and selective factors on the evolution of the population. SimHyb provides an output easily convertible to an input file for Structure ([13]), one of the most commonly used softwares for the Bayesian analysis of populations and detection of hybrids.
As a case study, we have simulated Q. ilex and Q. suber hybridizing populations, considering nine widely used nuclear microsatellites. Further analysis of the SimHyb output individuals with Structure have revealed that introgression between these species could have been underestimated in previous studies.
Material and methods
Conceptual approaches
SimHyb was programmed in Java 8, and runs in any computer with an OS that allows for Java (⇒ https://www.java.com/), or OpenJDK (⇒ http://openjdk.java.net/): Linux/ Unix, Microsoft Windows, Mac OS X, and other platforms. The software is available at: ⇒ http://www.gfhforestal.com/software.
Input files and parameters
Before starting the simulation, an interface window appears where the user must define the simulation parameters and input files (the Instructions Manual provided with the software includes examples of these input files). The user can define the population size for each species, considering only adult individuals. The size of the global population will be fixed throughout the simulation. The user must also provide the file with the loci and the allele frequencies of each species. Another important input file includes the specific classes and the fitness coefficient corresponding to each class. The user can define as many specific classes as desired, intermediate between the two pure species included in the original population, and can establish the limits of each class, according to the so-called “species coefficient”. Fertility among the different specific classes, which takes into account the pollination direction, is also defined as an input. Maternal or paternal inheritance of the chloroplast is also defined in this interface.
Simulation run
SimHyb creates an initial population with the specified number of adult individuals per species. Each individual has a multilocus genotype, with alleles drafted according to the allele frequencies provided by the user. The fitness coefficient of each individual corresponds to the one defined in the input, considering also the intraspecific variability εsp. Once the initial population is created, SimHyb simulates successive “generations”, in which new individuals are incorporated to the reproductive population while other individuals disappear (Fig. 1).
Fig. 1 - Overview of the workflow of SimHyb.
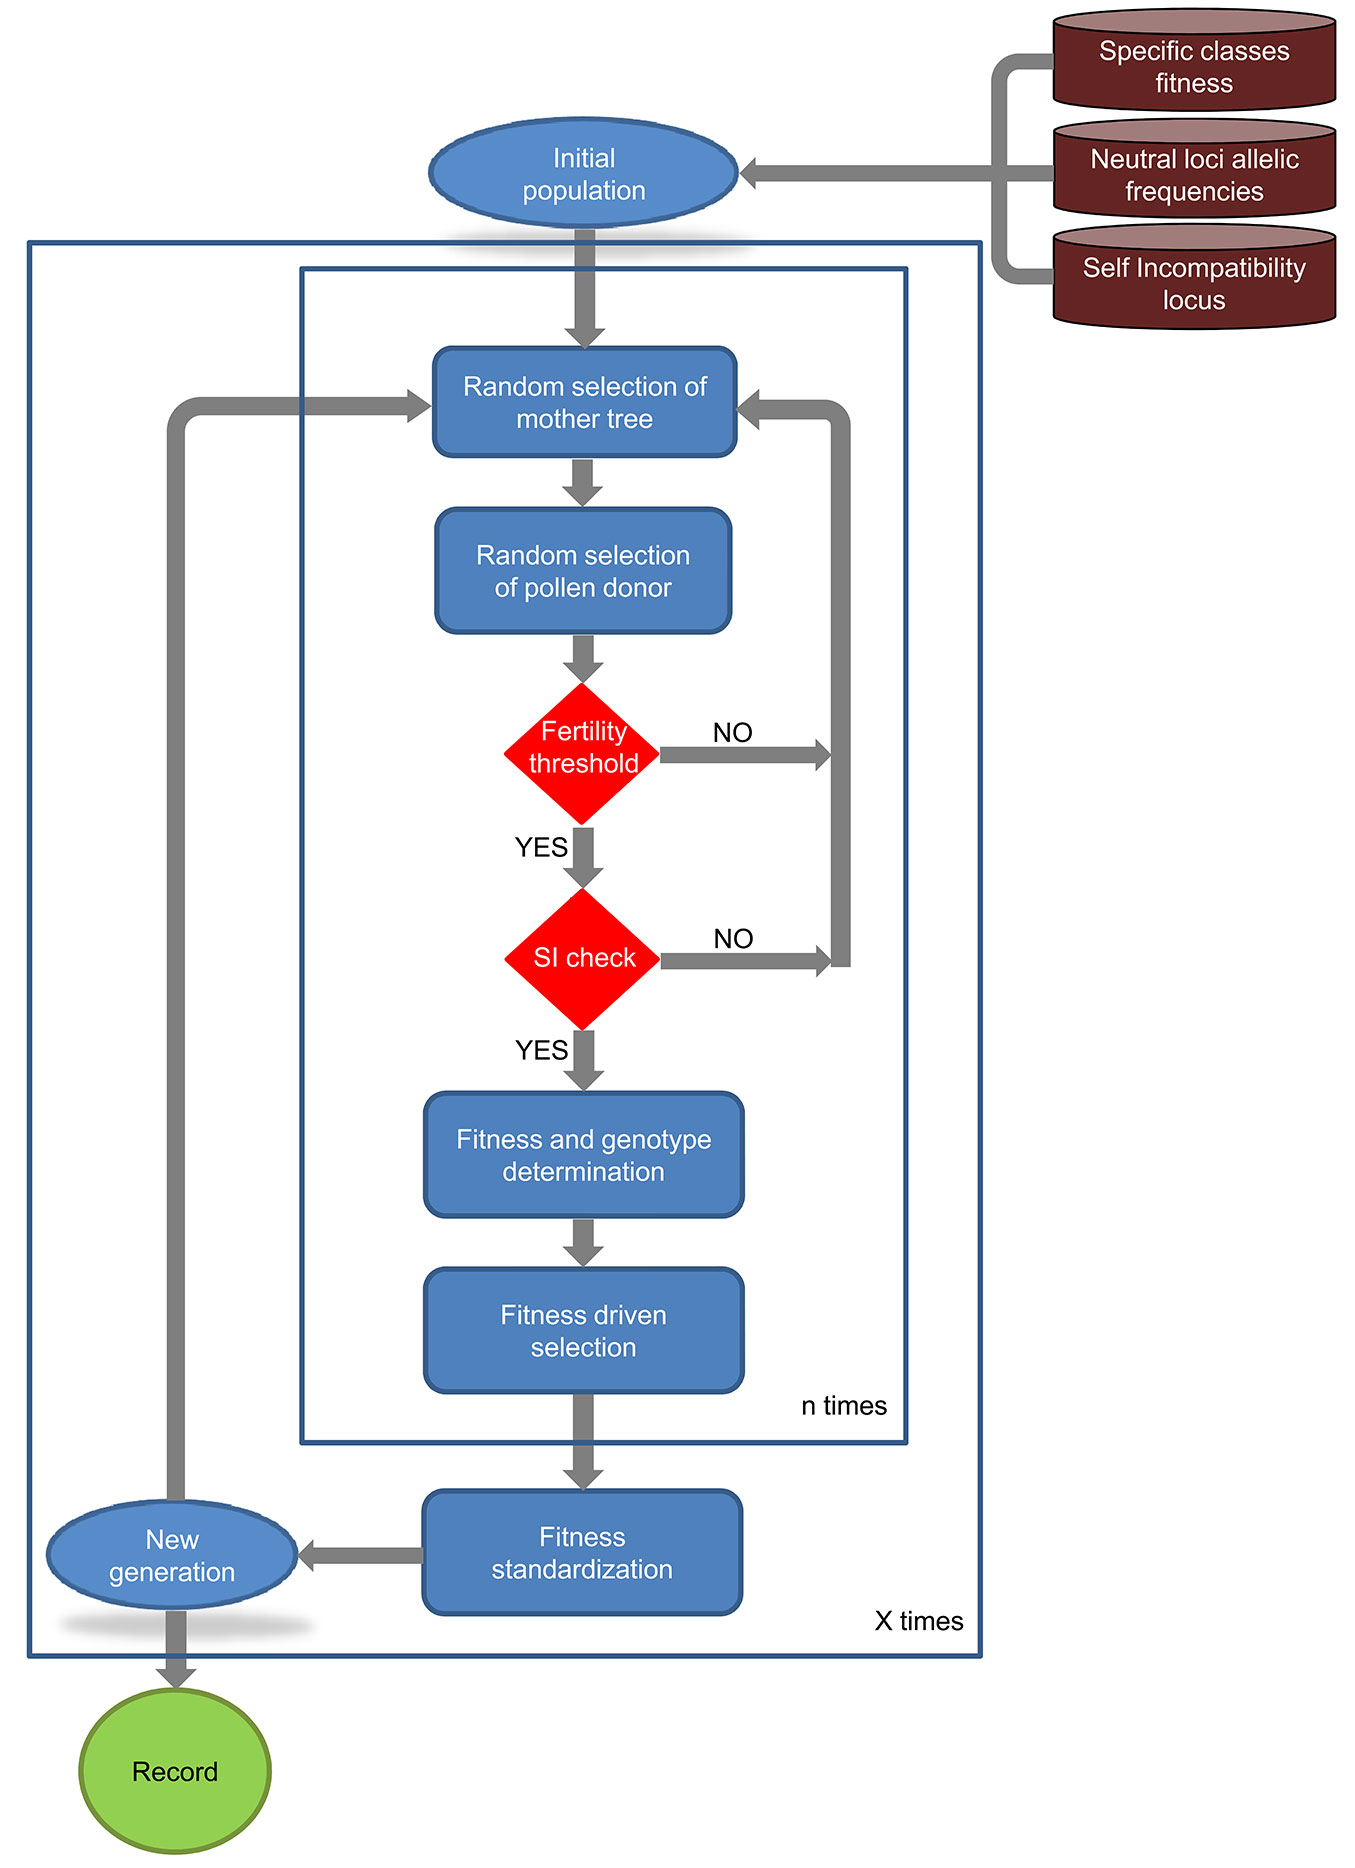
Each cycle or generation includes four phases: (1) reproduction; (2) ageing; (3) selection; and (4) standardization. No spatial restriction is considered in the current version of SimHyb for reproduction (phase 1), i.e., pollen from any individual can reach the flowers of any other tree with equal probability. The spatial positions of the individuals are not reckoned in SimHyb and, accordingly, there is no isolation by distance. The probability of obtaining a viable cross is firstly determined by the fertility coefficients defined in the input file “fertility.txt”, according to the specific classes of the mother tree and the pollen donor. After that, effective pollination is limited by self-incompatibility, if this option is selected. SimHyb considers gametophytic self-incompatibility driven by a single locus. Doing so, one of the alleles at this locus from the pollen donor is randomly selected and compared with both alleles of the mother tree. After passing these barriers, the new individual will carry at each locus one of the alleles of each parent, randomly selected, and the chloroplast and mitochondrial DNA of the corresponding parent, as specified by the user. The species coefficient of the new individual will be the average of the parents’ values, so it becomes a precise estimation of the contribution of each genetic pool (pure species) to the genome of the individual. A new fitness coefficient will be assigned to the new individual according to the following formulas (eqn. 1, eqn. 2):
where fsp is the fitness coefficient corresponding to the specific class of the new individual, fh is the fitness inherited from the parent trees, εh is a variability parameter, to include variability among full-sibs, and wh and wsp are weights, established by the user.
Ageing (phase 2) affects each individual fitness every cycle, according to this formula (eqn. 3):
where ft is the fitness coefficient t cycles after birth, f0 is the initial fitness, at the time of birth, a is the ageing coefficient, and b is the linearity coefficient, which varies between 0 and 1. However, the user should be cautious with high values of b, since they can lead to virtually eternal individuals (see below).
Selection (phase 3) takes place at this moment, and the N (population size, defined by the user) individuals with the highest fitness coefficients are selected and remain in the reproductive population, while the other individuals die. In the last step of the simulation, standardization (phase 4), the fitness coefficients are normalized between 0 and 1 (this way, if high b and wh have been selected, certain individuals can keep very high fitness values along the generations).
Output files
The user can select to finish the simulation when one of the chloroplasts is completely replaced by the other one or after a desired number of cycles. SimHyb provides as output a picture of the complete evolution of the population, as a series of “snapshots” after each reproductive cycle in a single .csv file where each individual appears as a row. The first row includes the headings of the first ten columns, while the second row includes the name of the loci included in the genotypes. The next rows correspond to the individuals in each generation (“snapshot” of the population). Each individual appears in a row, including its ID, species coefficient, father, mother, chloroplast, mitochondria, current generation, generation of birth, generation of death, fitness coefficient at the current generation, and the genotype, including the diploid self-incompatibility locus and the neutral loci defined by the user. This way, the output file is easily convertible into a SUSVDUVSF input file, simply removing the non-desired rows. Columns 3 to 12 could be considered as extra-columns in Structure analysis.
Case study: hybridization and introgression in the Quercus ilex × suber complex
In order to confirm the full operability of the software, a simulation study was performed on the Q. ilex and Q. suber hybridizing complex employing nine microsatellites that are commonly used to address hybridization in these species: MSQ4, MSQ13 ([3]), QpZAG9, QpZAG15, QpZAG36, QpZAG46, ([17]), QrZAG7, QrZAG11 and QrZAG20 ([5]). We used the allele frequencies obtained for the pure Q. ilex and Q. suber individuals identified in Burgarella et al. ([2]), covering the whole distribution range of Q. suber. We run several simulations with a variable number of input parameters to produce pure and hybrid individuals of known pedigree. The output of the simulations was downstreamed to Structure 2.3.4 ([13]), and the individual q values of the offspring, and the ratio between the offspring and the maternal q were calculated to infer the detection power of the aforementioned microsatellites in identifying hybrids and advanced introgression. For Structure analyses we used the admixture model assuming independent allele frequencies, a burn-in of 50.000 steps followed by 100.000 iterations, as in Burgarella et al. ([2]). Results do not vary significantly across multiple runs and with longer burn-in/iteration cycles. Statistical analyses were performed using the R software ([14]).
Results and discussion
Case study: hybridization and introgression in the Quercus ilex × suber complex
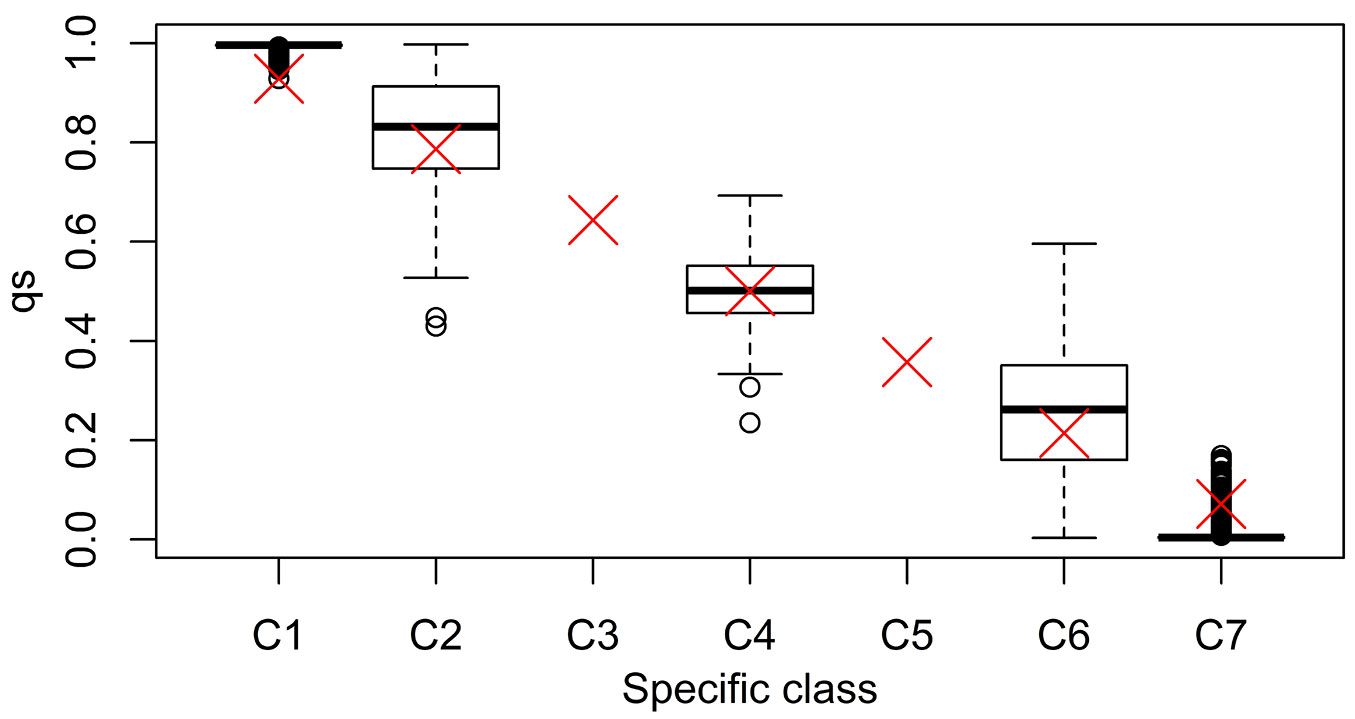
The simulation of the evolution of mixed, hybridizing Q. ilex and Q. suber populations, confirmed the full operability of SimHyb. In the simulations reported here, we defined seven specific classes. A species coefficient of 0 was assigned to pure Q. suber individuals in the initial population, and 700 to pure Q. ilex individuals (Tab. 1). The output of SimHyb provided hybrid and introgressed individuals whose pedigree could be easily reconstructed, and whose species coefficient provided a direct quantification of the contribution of each species to its genome. Tab. 1 includes the expected values of q, the probability of an individual to belong to the Q. suber cluster, provided by Structure. This parameter can be used to detect hybrid individuals ([2]) and is frequently considered a proxy of the contribution of one species to the genome. Burgarella et al. ([2]) reported a good performance of Structure and this set of markers for the detection of first generation hybrids and first backcrosses, in terms of efficiency and accuracy (sensu [18]). On the contrary, we have detected a high proportion of wrong assignations for advanced introgressed individuals (hybrid individuals corresponding to further backcrosses). In a scenario of a low hybridization rate as the one reported by Burgarella et al. ([2]) a high percentage of advanced introgressed individuals could go unnoticed with this set of markers. Tab. 2 and Fig. 2 summarize the results obtained for a simulated population with a 5% of first generation hybrids and a 5% of advanced introgressed individuals, highlighting the wrong assignations particularly for this latter group. Results for other simulated populations are provided in Tab. S1 to Tab. S4 in Supplementary material.
Tab. 1 - Specific classes defined in the simulation, with the corresponding range for the SimHyb specific coefficient. The expected values (average and range, in brackets) for each category of the qs provided by Structure are also included.
| Specific category | SimHyb specific coefficient |
Structure expected qs |
|---|---|---|
| 1 (Q. suber) | [0, 100] | 0.982 (0.858 - 1) |
| 2 | (100, 200] | 0.786 (0.715 - 0.858) |
| 3 | (200, 300] | 0.643 (0.572 - 0.715) |
| 4 | (300, 400) | 0.500 (0.429 - 0.572) |
| 5 | [400, 500) | 0.358 (0.286 - 0.429) |
| 6 | [500, 600) | 0.215 (0.143 - 0.286) |
| 7 (Q. ilex) | [600, 700] | 0.072 (0 - 0.143) |
Tab. 2 - Example of assignation of simulated individuals to specific categories according to Structure qs. Simulated population includes 5% of first generation hybrids (specific category 4) and 5% of advanced introgressed individuals (categories 2 and 6).
| Specific coefficient |
True specific category |
Structure-assigned specific category (%) | Total number |
||||||
|---|---|---|---|---|---|---|---|---|---|
| 1 | 2 | 3 | 4 | 5 | 6 | 7 | |||
| 0 | 1 | 100.00 | - | - | - | - | - | - | 6355 |
| (0, 100) | 1’ | - | - | - | - | - | - | - | - |
| (100, 200] | 2 | 39.94 | 42.49 | 16.43 | 1.13 | - | - | - | 353 |
| (200-300] | 3 | - | - | - | - | - | - | - | 0 |
| (300, 400) | 4 | - | - | 17.00 | 70.25 | 12.61 | 0.14 | - | 706 |
| [400, 500) | 5 | - | - | - | - | - | - | - | 0 |
| [500, 600) | 6 | - | - | - | 10.20 | 33.15 | 34.84 | 21.81 | 353 |
| [600, 700) | 7’ | - | - | - | - | - | - | - | - |
| 700 | 7 | - | - | - | - | - | 0.13 | 99.87 | 6356 |
Fig. 2 - Boxplot of the distribution of Structure-assigned qs to virtual individuals, according to their specific class. The red cross represents the expected qs value.
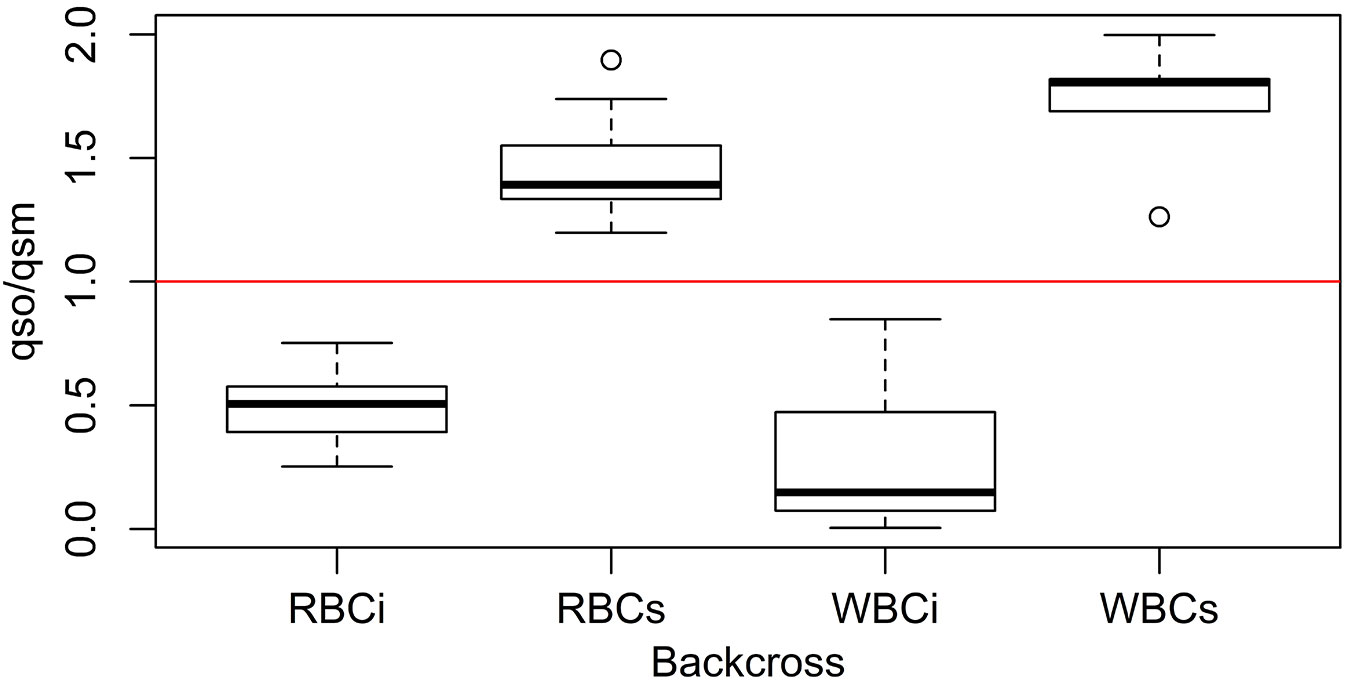
However, since SimHyb provides individuals of known pedigree, we performed direct comparisons of the q parameter provided by Structure for different individuals and for their parents. Our results show that the ratio qoffspring/qmother helps to assess the specific identity of the pollen donor. If this ratio is higher than 1, the pollen donor should have been a Q. suber individual (or, at least, an individual with a higher proportion of Q. suber genome than the mother tree), while, if the q ratio is lower than one, the pollen donor belongs to the Q. ilex group. Fig. 3 shows an example of how this parameter behaves in the case of backcrosses rightly and wrongly assigned based exclusively in the Structure q parameter.
Fig. 3 - Boxplot of the distribution of the ratio qs(offspring)/qs(mother) for simulated backcrosses. (RBCi): backcrosses F1 hybrid × Q. ilex rightly classified according to Structure qs.; (RBCs): backcrosses F1 hybrid × Q. suber rightly classified according to Structure qs.; (WBCi): backcrosses F1 hybrid × Q. ilex wrongly classified according to Structure qs.; (WBCs): backcrosses F1 hybrid × Q. suber wrongly classified according to Structure qs. Values below 1 (red line) indicates the hybrid has been pollinated by Q. ilex while values above 1 indicates pollination by Q. suber.
Conclusion
SimHyb is a user friendly software for the simulation of hybridizing populations, and the output provided is easily convertible into an input file for Structure, one of the most popular software packages for the analysis of admixture using genotypic data. It can be used both for research and for educational purposes, to analyze the effect of the different factors influencing the evolution of hybridizing populations, such as population size, inter- and intraspecific fertility, directionality in the effective pollination, selective advantage (fitness), ageing, etc.
Application to Q. ilex and Q. suber with a set of commonly used nuclear microsatellite markers has revealed that advanced introgression could have been missed in previous studies, so that rates of current hybridization between these species could have been underestimated. Nevertheless, we have found that ratio of the q parameter provided by Structure for a seedling and for its mother tree provides a good indication of the specific identity of the pollen donor.
Acknowledgements
AS & ULH conceived the idea; AS designed the program and drafted the manuscript; DRM programmed the software. All the authors have contributed to the final manuscript.
Development of this software has been funded by the project AGL2015-67495-C2-2-R (Spanish Ministry of Economy and Competitiveness)
References
CrossRef | Gscholar
Authors’ Info
Authors’ Affiliation
David Rodríguez-Martínez
Unai López De Heredia
GI Genética, Fisiología e Historia Forestal, Dept. Sistemas y Recursos Naturales, ETSI Montes, Forestal y del Medio Natural, Universidad Politécnica de Madrid, Madrid (Spain)
Corresponding author
Paper Info
Citation
Soto Á, Rodríguez-Martínez D, López De Heredia U (2018). SimHyb: a simulation software for the study of the evolution of hybridizing populations. Application to Quercus ilex and Q. suber suggests hybridization could be underestimated. iForest 11: 99-103. - doi: 10.3832/ifor2569-011
Academic Editor
Piermaria Corona
Paper history
Received: Jul 28, 2017
Accepted: Jan 12, 2018
First online: Jan 31, 2018
Publication Date: Feb 28, 2018
Publication Time: 0.63 months
Copyright Information
© SISEF - The Italian Society of Silviculture and Forest Ecology 2018
Open Access
This article is distributed under the terms of the Creative Commons Attribution-Non Commercial 4.0 International (https://creativecommons.org/licenses/by-nc/4.0/), which permits unrestricted use, distribution, and reproduction in any medium, provided you give appropriate credit to the original author(s) and the source, provide a link to the Creative Commons license, and indicate if changes were made.

Web Metrics
Breakdown by View Type
Article Usage
Total Article Views: 50198
(from publication date up to now)
Breakdown by View Type
HTML Page Views: 42255
Abstract Page Views: 3345
PDF Downloads: 3276
Citation/Reference Downloads: 9
XML Downloads: 1313
Web Metrics
Days since publication: 3055
Overall contacts: 50198
Avg. contacts per week: 115.02
Article Citations
Article citations are based on data periodically collected from the Clarivate Web of Science web site
(last update: Mar 2025)
Total number of cites (since 2018): 10
Average cites per year: 1.25
Publication Metrics
by Dimensions ©
Articles citing this article
List of the papers citing this article based on CrossRef Cited-by.
Related Contents
iForest Similar Articles
Research Articles
Molecular evidence of bidirectional introgression between Quercus suber and Quercus ilex
vol. 11, pp. 338-343 (online: 18 April 2018)
Research Articles
Fine-scale spatial genetic structure in a multi-oak-species (Quercus spp.) forest
vol. 8, pp. 324-332 (online: 05 September 2014)
Research Articles
Leaf morphology of progenies in Q. suber, Q. ilex, and their hybrids using multivariate and geometric morphometric analysis
vol. 11, pp. 90-98 (online: 31 January 2018)
Research Articles
Delineation of seed collection zones based on environmental and genetic characteristics for Quercus suber L. in Sardinia, Italy
vol. 11, pp. 651-659 (online: 04 October 2018)
Research Articles
Shrub facilitation of Quercus ilex and Quercus pubescens regeneration in a wooded pasture in central Sardinia (Italy)
vol. 3, pp. 16-22 (online: 22 January 2010)
Research Articles
Germination and seedling growth of holm oak (Quercus ilex L.): effects of provenance, temperature, and radicle pruning
vol. 7, pp. 103-109 (online: 18 December 2013)
Review Papers
Indicators of drought effects in Pinus sylvestris: genetic analyses to corroborate the results of empirical methods
vol. 3, pp. 89-91 (online: 15 July 2010)
Research Articles
Adjustment of photosynthetic carbon assimilation to higher growth irradiance in three-year-old seedlings of two Tunisian provenances of Cork Oak (Quercus suber L.)
vol. 10, pp. 618-624 (online: 17 May 2017)
Research Articles
Carbon storage in degraded cork oak (Quercus suber) forests on flat lowlands in Morocco
vol. 9, pp. 125-137 (online: 08 August 2015)
Research Articles
Genetic diversity of core vs. peripheral Norway spruce native populations at a local scale in Slovenia
vol. 11, pp. 104-110 (online: 31 January 2018)
iForest Database Search
Search By Author
Search By Keyword
Google Scholar Search
Citing Articles
Search By Author
Search By Keywords
PubMed Search
Search By Author
Search By Keyword


