Spatial diversity of forest regeneration after catastrophic wind in northeastern Poland
iForest - Biogeosciences and Forestry, Volume 9, Issue 3, Pages 414-421 (2016)
doi: https://doi.org/10.3832/ifor1699-008
Published: Jan 29, 2016 - Copyright © 2016 SISEF
Research Articles
Abstract
We examined the spatial diversity of young growth established after the catastrophic windthrow occurred in 2002 in the northeastern part of Poland. Our observations and measurements were conducted on permanent circular measurement plots located in the Szast Protected Forest (continental lowland temperate forests) that were established 3 years after the windstorm and left to natural succession. We evaluated the spatial indices characterizing the four main aspects of stand structure: the spatial arrangement of seedlings and saplings, species mingling, tree size diversity at the local spatial scale and the overall structural complexity index. The calculations were conducted in parts of the forest with differing severity of disturbance. The obtained results indicated the prevalence of a random arrangement of young growth. Clumps of regeneration were observed to a lesser degree in all parts of the forest. The species diversity was moderate and was the highest in the slightly or severely disturbed stands. Scots pine formed homogenous groups of regeneration and oaks were intermingled among other tree species. The height of the natural regeneration was moderately or highly differentiated in all stands. The overall structural diversity index showed that stand regeneration in the slightly or moderately disturbed stands was more differentiated than the young growth in the severely disturbed stands. The size differentiation of young growth is a long-lasting process and thus should be considered in practices aimed at the re-growing of areas after a natural disturbance. This process might be used to the replace monocultures with more diversified forests even in poor forest site types.
Keywords
Spatial Diversity, Spatial Indices, Natural Regeneration, Windthrow, Forest Succession
Introduction
The recognition that ecosystems are dynamic and that disturbances play a key role in the development of many ecosystems was an important paradigm proclaimed among ecologists and resource managers during the 20th century ([27]). Natural disturbances (e.g., storm events) are now recognized to be among the most important processes that guide forest dynamics ([26], [27], [3]) because of their effects on forest structure, species composition, patchiness and resource availability. In most cases, windthrows help to revive the habitat. The forest response following blowdown can occur by the recruitment of new individuals or release of the previously suppressed understory ([14]).
Severe wind storms are expected to increase in Europe, especially in the continental zone, and the role of such natural disturbances in shaping European forest ecosystems has received increasing attention ([44], [19], [25], [33], [37], [48], [46], [6], [11], [3], [21], [35]). Catastrophic windstorms usually cause the destruction of tree canopy and influence the environmental conditions ([44], [21]). Different light availability and microsite heterogeneity influence forest regeneration in the years following a windthrow ([17], [49], [16], [11], [21]). Kuuluvainen & Juntunen ([17]) noted the importance of microhabitat heterogeneity (pits and mounds, mineral soil exposition etc.) for regeneration in a mature Scots pine stand characterized by windthrow gaps. These researchers observed that birch seedlings occupied mostly the pits and mounds created by tree falls, while pine regeneration was mostly found on the uprooting spots. The early growth of recruits was determined by the type of microhabitats and the radiation environment as well as by the competition with neighboring individuals. Kuuluvainen & Kalmari ([16]) studied the regeneration microsites of Norway spruce seedlings in the old-growth forest disturbed by the wind in the boreal zone of Finland. Spruce seedlings were found the most often in disturbed microsites and immediately beside or on decayed wood. Vodde et al. ([46]) studied the natural regeneration of heavily or moderately damaged windthrow areas in hemiboreal mixed forests in Estonia. Regeneration establishment and its growth were favored in the pits and mounds of uprooted trees. Moreover, they observed that seedling grow better in the large but shallow soil pits created by uprooted spruce, and poorer in the small but deeper pits created by hardwoods. The annual height growth of seedlings was higher in the heavily damaged areas than in the moderately damaged ones, and the best height was observed for rowan seedlings followed by birch, alder and spruce ([46]). Mitchell ([21]) noted that forest recovery after extreme weather events depended on the severity and extent of the damage, the release of the understory trees or colonization of available growing space by new regeneration, influencing the tree species succession. For example, if the windthrow removes light-demanding tree species from the overstory and these species are replaced by more shade-tolerant ones, then the windthrow can be viewed as accelerating succession ([11], [21]). In the case of whole-stand replacement, the potential exists for early-serial tree species to occupy the disturbed large areas, leading to uniform stands. The dependence of species composition change on the damage severity was reported by Ilisson et al. ([12]) in a Norway spruce-dominated forest in Estonia. The biodiversity (number of species) was the highest in the areas with moderate damage followed by heavily damaged ones. Despite the severity of damage, the stand attributes are also important factors driving the successional dynamics after wind-induced changes ([33]). Holzmueller et al. ([11]) reported the species composition change after the strong windthrow in an oak-dominated forest caused by the release of shade-tolerant tree species present in the understory. Studies conducted by Močalov & Lässig ([19]) in boreal forests in Central Ural also showed the significant increase in the number of broadleaved tree species, mostly downy birch and European aspen, after the windstorm. Recruits were most abundant on sites where woody debris was cleared.
While most previously conducted research focused on the effect of the disturbance on species composition change and the dependence of the regeneration on the microhabitat variation, only a few have focused on the spatial structure of regeneration and its subsequent growth ([17], [25], [48], [1]). Kuuluvainen & Juntunen ([17]) reported a clumped distribution of pine and birch regeneration in the disturbed microhabitats created by fallen trees, but they found that pine seedlings/saplings were less aggregated than birch. Kuuluvainen & Kalmari ([16]) investigated the regeneration of Norway spruce in the windthrow area of boreal old-growth forest in Finland, finding that more than 60% of the seedlings showed aggregated distribution across microsite types created by the wind storm. Nagel et al. ([25]) reported that the spatial pattern, as well as the stand structure, showed dependence on the disturbance event in an old-growth Fagus-Abies forest. Beech saplings showed clumped distribution at small and medium spatial scales and their clumping intensity was slightly higher in the stand damaged by windthrow compared to the undisturbed one. Fir saplings showed an aggregation pattern only at a small spatial scale, which was also higher in the case of the windthrow plot ([25]). Allen et al. ([1]) analyzed 25 years of change in wind-damaged oak and pine-dominated stands in Minnesota, USA. Their study indicated that after disturbance the stands were converging towards a late-successional forest type dominated by the shade-tolerant tree species and the windstorm in both stands led to a more clumped distribution of the survived trees. Tree regeneration did not show any significant differences from random distribution in the case of the pine-dominated stand. In the oak-dominated plot, the trees showed random distribution prior to disturbance. Afterward, the spatial pattern of regeneration showed clumping only at the finer spatial scales due to the recruits’ occurrence in the treefall gaps. Overall, the authors stated that the windthrow weakly modified the spatial pattern of the trees in the oak site; the modification of the spatial pattern was more pronounced in the pine site. Their results also showed that the recruits that had occurred after the windthrow were randomly distributed around the overstory trees in the pine-dominated stand, but showed a positive spatial dependence on the dead overstory trees at the small spatial scale in the oak-dominated site ([1]).
Knowledge of the spatial distribution of trees, including species and size attributes, allows to better understand forest dynamics and growth as most natural processes operate at a certain spatial scale ([18], [36], [15], [20], [32]). The present paper is focused on the structural diversity of the natural regeneration observed in a continental lowland temperate forest in Poland in the eleven years following the windthrow of 2002. The purposes of the present paper were, first, to evaluate the effect of the disturbance event on three different spatial aspects (i.e., horizontal distribution, species mingling and spatial size differentiation) of the structure of the young generation growing in the forest areas that experienced different disturbance severity. Second, the overall structural diversity index, being the summation of the weighted different structural indices, was calculated to assess the overall structural complexity of regeneration depending on the disturbance severity observed in the forest.
Material and methods
Study area
The study was conducted in the Piska Forests located on the Mazurska Plain in northeastern Poland (21° 48′ E, 53° 38′ N). The region is rather flat and the altitude of the hills ranges from 110 to 190 m a.s.l. The character of the region (a multitude of lakes and hills) has been formed by the last Baltic glacial period. The forests consist mainly of Scots pine (Pinus sylvestris L.) that cover about 84% of the area. Other tree species are black alder (Alnus glutinosa L.), silver birch (Betula verrucosa Ehrh.) and Norway spruce (Picea abies (L.) Karst). Most of the stands in the forest district are 30 to 70 years old. Birch and pine are the pioneer tree species that dominate the landscape. The stands of the Szast PF showed different levels of disturbance severity. In some areas, almost all the trees were snapped, and others presented only a few dead trees. The trees in most of the stands that suffered severe blowdown were of a similar age. The pine and oak regeneration is heavily browsed by red deer (Cervus elaphus L.) and roe deer (Capreolus capreolus L.) in all the stands of the Piska Forests ([7]).
A severe climate with changeable weather is typical of this area. The total precipitation is 541 mm year-1 with the majority falling in the summer. The average annual temperature is 7 °C and the vegetation season lasts 190-220 days. Soils are of glacial origin and are composed mainly of sands, boulder clays, or alluvial cones.
The observations were carried out in Szast Protected Forest (Szast PF), which was established 3 years after the wind disturbance of 2002. The total area of the Szast PF is 445 ha, and no management activity has been conducted on this area after its establishment as a protected forest. This area is secured against fire on one side by the Pisa River and on the other side by a 70 m wide protection belt ([4]). The main criteria for choosing the study plots were the forest site type and the disturbance intensity. According to Polish site classification ([23]), the dominant forest site type based on the natural potential vegetation is fresh coniferous forest (Peucedano-Pinetum association), and the study was conducted on this site type. On the basis of the aerial photos, a map of the disturbed forest stands was created. The degree of forest damage was estimated based on stereoscopic image observations. Images were acquired on 14 November 2002 in 1: 15.000 scale by an analogue camera with a fixed focal length of 153.172 mm on light sensitive film (Kodak Infrared Aerochrome® 1443). After digitalization and orientation (internal, exterior, and absolute), manual interpretation and stereo digitalization of areas with varying degrees of damage were performed ([7]). The next criteria for choosing the site of experimental plots were the number of damaged trees and the disturbance severity observed in a stand (Tab. 1). The study plots were established in the south part of Szast PF in stands differing in age from 43 to 104 years. The old stands were the only ones in the investigated area that were slightly disturbed. Thus, the age of the studied stands was different. The Szast PF was surrounded by stands showing different levels of disturbances. The distance from the research plots to the undamaged stands was approximately 500 m. The source of the pine seeds was the undamaged stands and the living trees in the moderately and severely disturbed stands. Birch produces seed every year in Poland and therefore regenerates abundantly (and naturally) if seed sources are available. Plots were established in the stands with the following levels of disturbance severity:
Tab. 1 - Characteristic of the study plots in Szast Protected Forest. (*): basal area in 2005.
| Disturbance severity | Species composition |
Age (year) |
Area (ha) |
Plot number |
BA* (m2 ha-1) |
|---|---|---|---|---|---|
| Slightly disturbed (Se) | Scots pine | 104 | 15.48 | 24 | 29.22 |
| Moderately disturbed (Mo) | Scots pine | 48 | 15.77 | 21 | 29.77 |
| Severely disturbed - removed wood (Sr) | Scots pine | 43 | 10.94 | 10 | 19.62 |
| Severely disturbed - left wood (Sl) | Scots pine | 46 | 13.40 | 10 | 36.66 |
- plots with slightly disturbed stands - less than 10% of the trees showed visible damage (snags, dead standing trees), and the plots had very few lying dead trees (Se);
- plots with moderately disturbed stands - 11-50% of the trees showed visible damage, and the plots had a number of snags (Mo);
- plots with severely disturbed stands - over 90% of the trees were damaged, and most trees were snags (or uprooted trees). Although some wood were logged before the establishment of the Szast PF, this occurrence presented an opportunity to investigate the influence of the wood presence on the stand dynamics. These stands were further divided into stands where timber was logged (Sr) and stands with timber left on the ground (Sl).
Methods
Data were collected on 65 circular plots in the regular 50 × 100 m grid established in 2005 in four forest compartments representing different degrees of disturbance severity. The number of plots was not evenly distributed between the treatments (disturbance severity) and depended on the area of disturbance severity in the southern part of the Szast PF. The measurements of spatial diversity were completed in 2013. All seedlings (h ≤0.5 m) and saplings (h>0.5 m and DBH ≤7 cm) were measured in the plots of 10 and 100 m2 area, respectively, and they were the subjects of further statistical analysis. The azimuth of each specimen and the distance from the center of each plot to all trees within that plot were measured. The plots with very sparse regeneration (few trees only) were excluded from the analysis. The percentage of study plots covered by natural regeneration (seedlings and saplings) was also described for all the investigated plots ([8]).
To evaluate the overall structural diversity, we calculated the most commonly used structural indices describing diversity with respect to the spatial positioning of the trees, the spatial mingling of tree species and the size differentiation of trees.
Spatial arrangement of trees (W)
The spatial arrangement of the trees was evaluated using the contagion index W. This index was developed by Gadow ([10]) and is based on the classification of the angles between neighboring trees. In contrast to distance methods such as the Clark-Evans index, angles do not have to be measured exactly; rather, it is sufficient to classify the angles ([30], [32], [41]). This index can take four values in the case of 3 neighbors taken into account: 0; 0.33; 0.66 and 1.0. Values of W≤0.5 indicate a regular distribution of specimens, 0.5<W≤0.6 indicate a random distribution, while W>0.6 indicate a clumped arrangement of trees ([30], [41]).
Species diversity (DM)
Species diversity can be estimated using a spatially explicit index DM (mingling index) elaborated by Gadow ([10]). This index describes the degree of mixing of the tree species in the forest and is defined as the fraction of n-th nearest neighbor that is of a different species from the “reference tree” ([30], [13], [32], [40]). The index ranges from 0 (low species diversity) to 1 (high species diversity) and can take 4 values (3 neighbors are taken into account): 0; 0.33; 0.66 and 1.0. Homogenous groups of tree species produce low values of the index, while perfectly intermingled species produce high values of DM. For our purposes, the value of DM≤0.33 suggests low species diversity, 0.33<DM≤0.66 suggests moderate species diversity, while the value of DM>0.66 indicates high species diversity.
Size diversity (TH)
Tree height was the tree attribute used to describe the size diversity of the young generation in the forest. Height diversity was evaluated using the differentiation index TH, commonly applied in forestry ([31], [39], [40], [42]). The index describes the degree of dissimilarity of the height between neighboring trees. The TH value ranges from 0 (low differentiation) to 1 (high differentiation). The TH range can be divided into 5 equal classes of size differentiation ([47]). For the purpose of this paper, values of TH≤0.40 indicate low size diversity, 0.40<TH≤0.60 indicate moderate size diversity and TH>0.60 indicate high size diversity.
Complex structural diversity index (SI)
The complex diversity index is composed of three indices describing the spatial positioning of trees, species diversity and size differentiation, each of which receives a different weight ([28]). In the original form, tree diameter was the characteristic used in the size differentiation-index calculations. In the present study, we used the tree height parameter instead of the stem diameter to calculate the size diversity index. The SI index is the weighted sum of three indices and the weight for each component was estimated considering the relative importance of the three variables (i.e., indices too) described above ([20], [28]). The weighted SI index is calculated as follows (eqn. 1):
where DM is the mingling index, W is the spatial arrangement index; TH is the height differentiation index, and the weights w were: wDM=0.5, wW=0.3 and wTH=0.2, according to Pastorella & Paletto ([28]).
An SI<0.3 indicates low diversity, 0.3< SI<0.4 indicates moderate diversity and SI≥0.4 indicates high overall diversity of tree regeneration. To determine whether plots with different severities of damage are different with respect to the overall diversity, we used one-way ANOVA.
The effect of the disturbance severity on the ground cover as a result of the regeneration was tested using the Kruskal-Wallis test.
Results
Ground cover and species composition of regeneration
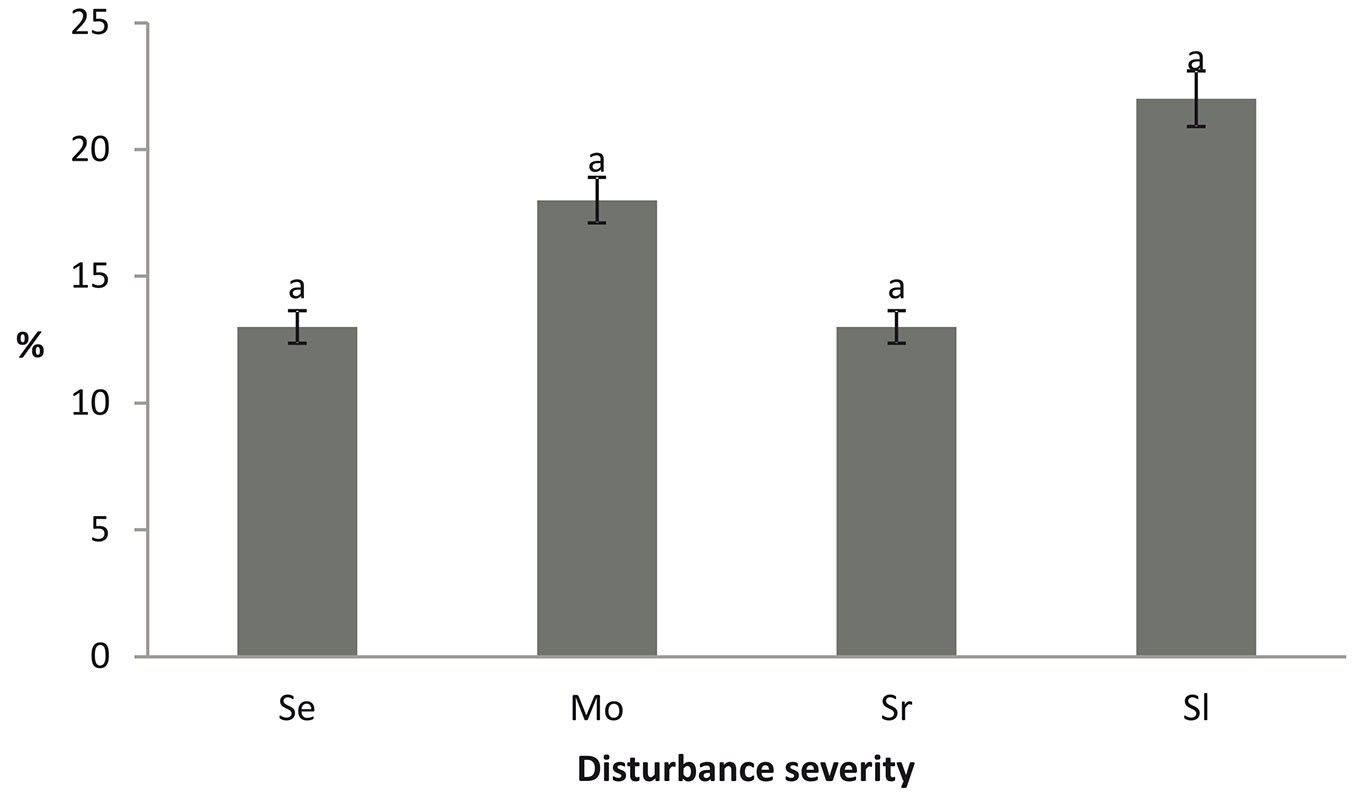
The disturbance severity did not influence the ground cover by regeneration (Fig. 1). The regeneration cover varied across the study area. The highest cover was observed in the severely disturbed stands with unlogged wood. The lowest cover was measured in the stands with slight and severe blowdown and with salvage logging.
Fig. 1 - Regeneration cover (%) in the Szast Protected Forest.
The seedlings of Scots pine dominated in the moderately disturbed stands (Fig. 2a). The lowest percentage of pine seedlings was observed in the severely disturbed stands. The seedlings of European beech (Fagus sylvatica L.) and Norway spruce (Picea abies (L.) Karst) were found only in the slightly disturbed stand. Young growth of silver birch (Betula pendula Roth) was absent in the severely disturbed stand with logged wood and the density of pedunculate oak (Quercus robur L.) seedlings was the highest in the slightly and severely disturbed stand with unlogged timber.
Fig. 2 - Seedlings and saplings in the Szast Protected Forest depending on the severity of disturbance.
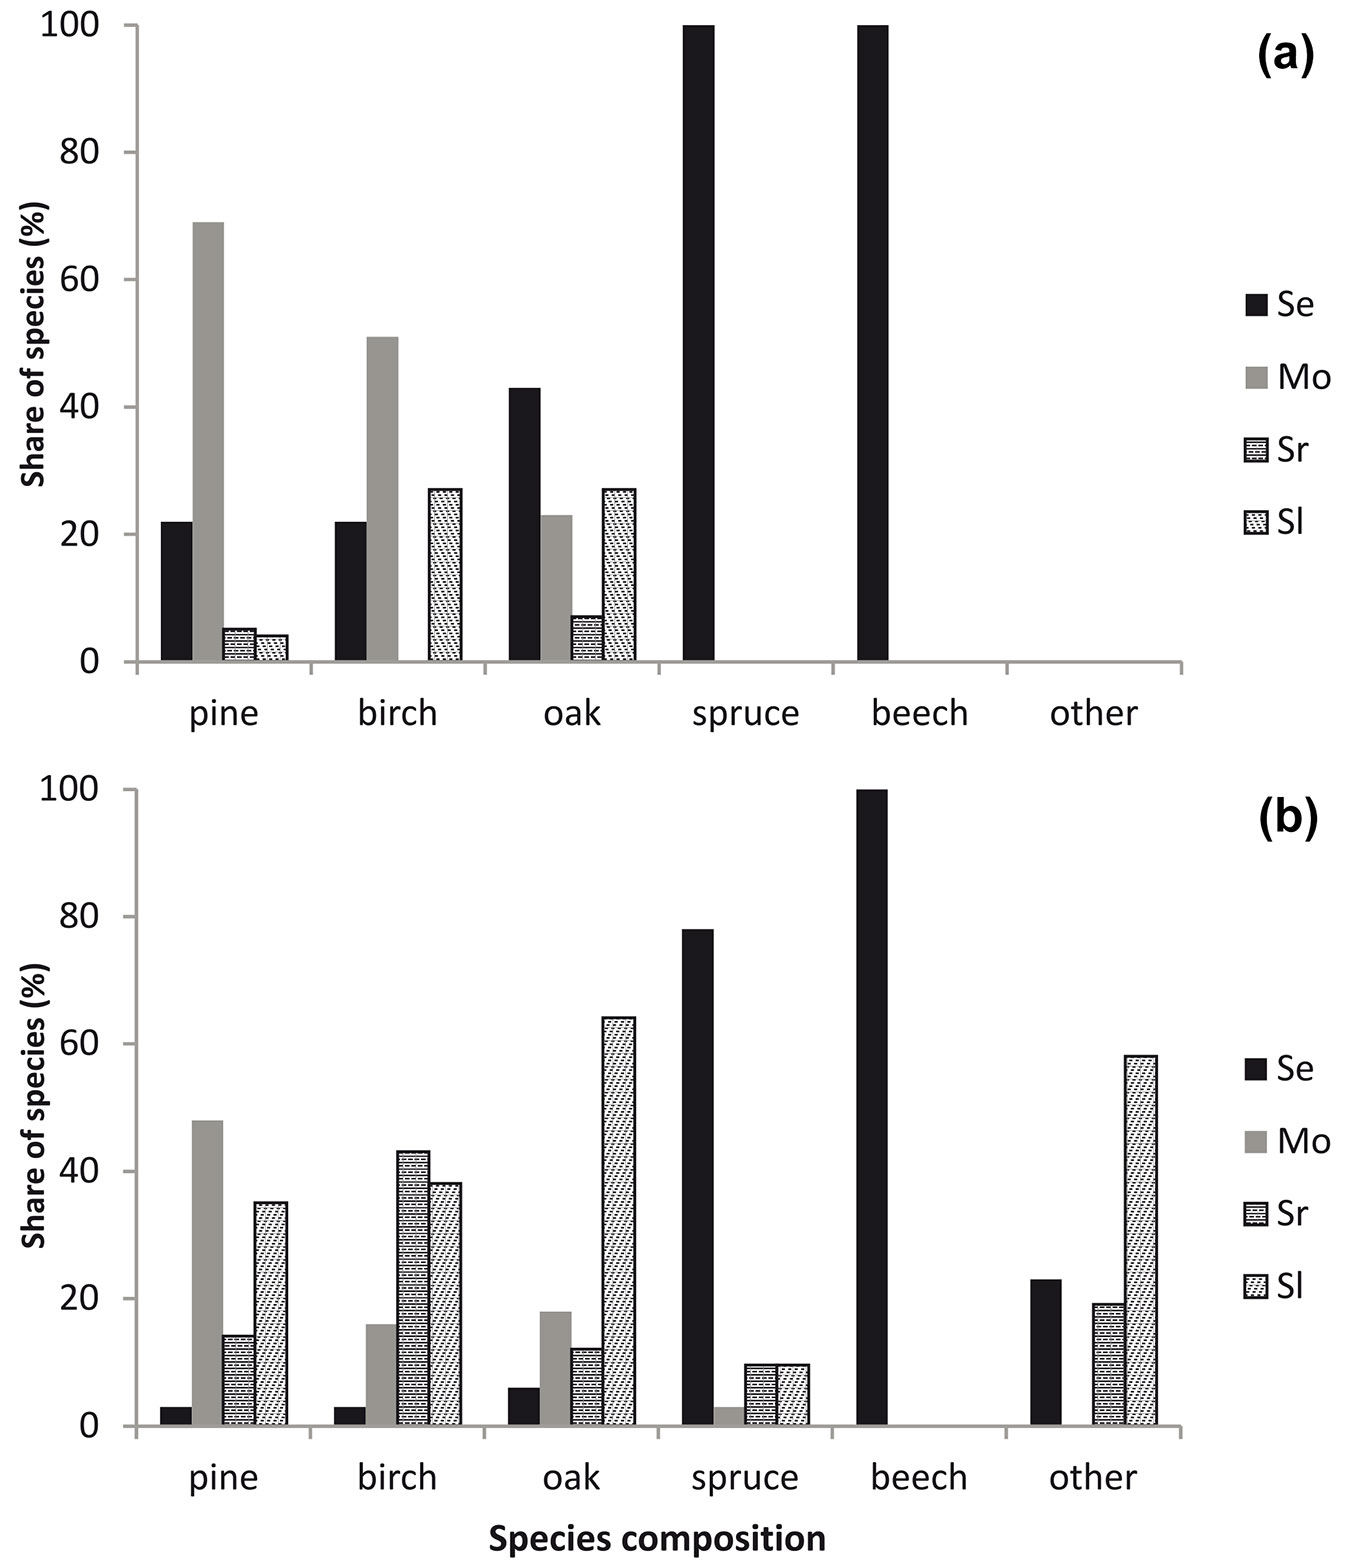
Scots pine was the dominant tree species in the sapling phase in the moderately disturbed stands (Fig. 2b). The percentage of pine saplings was also high in the severely disturbed stands with unlogged wood. Birch dominated in the severely disturbed stand with logged timber. The percentage of oak was the highest in the severely disturbed stands without salvage logging. Saplings of spruce were found in all the investigated stands with the highest percentage in the slightly disturbed forests. Other species (mainly shrubs) were observed in all stands, except the moderately disturbed stands, and the highest percentage was found in the severely disturbed stands with unlogged wood.
Spatial pattern of natural regeneration
Natural regeneration occurred mostly at random in the moderately disturbed stands and in both variants of the severely disturbed stands. The trees were established at random, especially in the severely disturbed forests where timber was not removed (70% of plots in Sl). In the case of the slightly disturbed forest (Se), the prevailing type of tree distribution was regular (Tab. 2). This regular type of tree arrangement could be observed on 40% of the plots established in this part of the forest. A clumping distribution of the young forest generation was often observed on the plots located in each part of the forest, irrespective of the disturbance severity, but their share varied from 20% (Sl) to 37.5% (Sr). The clusters were observed on 25-26% of the plots in the forest areas with slight and moderate disturbance (Se and Mo, respectively). The coefficient of variability for the W-index was highest in the severely disturbed part of the forest with removed timber (Sr, CV=0.63%), and its lowest value was found for the moderately disturbed stand (Mo, CV=15%).
Tab. 2 - Indices of structural diversity of natural regeneration in disturbed stands of the Szast Protected Forest. (DM): spatial mingling index; (W): contagion index; (TH): tree height differentiation index; (SI): complex structural index); (Se); slightly disturbed stand; (Mo): moderately disturbed stand; (Sr): severely disturbed stand with removed wood; (Sl): severely disturbed stand with left wood.
W
|
DM
|
TH
|
SI
|
||||||||||||
|---|---|---|---|---|---|---|---|---|---|---|---|---|---|---|---|
| Se | Mo | Sr | Sl | Se | Mo | Sr | Sl | Se | Mo | Sr | Sl | Se | Mo | Sr | Sl |
| 0.53 | 0.38 | 0.00 | 0.59 | 0.45 | 0.41 | 0.43 | 0.60 | 0.47 | 0.47 | 0.55 | 0.57 | 0.48 | 0.41 | 0.33 | 0.59 |
| 0.56 | 0.49 | 0.58 | 0.59 | 0.13 | 0.00 | 0.50 | 0.57 | 0.51 | 0.34 | 0.63 | 0.50 | 0.34 | 0.22 | 0.55 | 0.56 |
| 0.50 | 0.76 | 0.75 | 0.51 | 0.16 | 0.51 | 0.00 | 0.46 | 0.48 | 0.55 | 0.48 | 0.40 | 0.33 | 0.59 | 0.32 | 0.46 |
| 1.00 | 0.62 | 0.56 | 0.57 | 0.58 | 0.08 | 0.49 | 0.54 | 0.54 | 0.29 | 0.51 | 0.44 | 0.70 | 0.28 | 0.52 | 0.53 |
| 0.57 | 0.50 | 0.00 | 0.75 | 0.40 | 0.49 | 0.00 | 0.57 | 0.51 | 0.52 | 0.55 | 0.50 | 0.47 | 0.50 | 0.11 | 0.61 |
| 0.74 | 0.51 | 0.62 | 0.58 | 0.40 | 0.57 | 0.24 | 0.58 | 0.53 | 0.61 | 0.48 | 0.56 | 0.53 | 0.56 | 0.40 | 0.58 |
| 0.56 | 0.50 | 0.57 | 0.00 | 0.00 | 0.37 | 0.32 | 0.42 | 0.48 | 0.45 | 0.46 | 0.52 | 0.26 | 0.43 | 0.42 | 0.31 |
| 0.61 | 0.65 | 0.63 | 0.52 | 0.43 | 0.08 | 0.32 | 0.49 | 0.60 | 0.56 | 0.47 | 0.55 | 0.52 | 0.35 | 0.44 | 0.51 |
| 0.00 | 0.51 | - | 0.58 | 0.54 | 0.88 | - | 0.53 | 0.38 | 0.63 | - | 0.59 | 0.35 | 0.72 | - | 0.56 |
| 0.42 | 0.60 | - | 0.67 | 0.67 | 0.39 | - | 0.42 | 0.67 | 0.58 | - | 0.55 | 0.60 | 0.49 | - | 0.52 |
| 0.00 | 0.72 | - | - | 0.20 | 0.53 | - | - | 0.67 | 0.43 | - | - | 0.23 | 0.57 | - | - |
| 0.37 | 0.60 | - | - | 0.33 | 0.08 | - | - | 0.51 | 0.42 | - | - | 0.38 | 0.30 | - | - |
| 0.00 | 0.53 | - | - | 0.67 | 0.17 | - | - | 0.56 | 0.48 | - | - | 0.45 | 0.34 | - | - |
| 0.61 | 0.54 | - | - | 0.63 | 0.36 | - | - | 0.66 | 0.47 | - | - | 0.63 | 0.44 | - | - |
| 0.50 | 0.60 | - | - | 0.30 | 0.3 | - | - | 0.52 | 0.49 | - | - | 0.40 | 0.43 | - | - |
| 0.55 | 0.56 | - | - | 0.26 | 0.21 | - | - | 0.60 | 0.4 | - | - | 0.42 | 0.35 | - | - |
| 0.00 | 0.59 | - | - | 0.62 | 0.62 | - | - | 0.66 | 0.69 | - | - | 0.44 | 0.63 | - | - |
| 0.52 | 0.58 | - | - | 0.46 | 0.23 | - | - | 0.62 | 0.36 | - | - | 0.51 | 0.36 | - | - |
| 0.65 | 0.67 | - | - | 0.11 | 0.00 | - | - | 0.68 | 0.55 | - | - | 0.39 | 0.31 | - | - |
| 0.55 | - | - | - | 0.22 | - | - | - | 0.35 | - | - | - | 0.35 | - | - | - |
Diversity measures
Species mingling (DM index)
The severely disturbed stand with timber left on the ground (Sl) was the most diverse. At least two of the three closest neighbors belonged to other tree species than the reference tree (Tab. 2). The lowest diversity of tree species was observed in Sr (62% of the study plots). In the slightly (Se) and moderately (Mo) disturbed stands, the species diversity was lower (45 and 47% of plots, respectively) than that in Sr. However, the species diversity was the highest (different tree species recorded for 3 neighbors) on only two plots in Se and one plot in Mo. These results were confirmed by the distribution of the DM index (results not shown), indicating that at least 2 closest neighbors belonged to the same species as the reference tree in Mo and Sr. Thus, in these sites, the natural regeneration was rather homogenous in terms of species composition at the nearest neighbor scale. The distribution of the DM index suggested a greater differentiation of plots in Se and Sl because there were more cases when two or three neighbors belonged to different species than the reference tree. The spatial mixture of the tree species was different in particular stands (Tab. 3). Scots pine created homogenous clusters in the slightly disturbed stands (Se) and oak was the single mixed-tree species in the same site. Beech and spruce were found spatially mixed between the Scots pine and oak. Scots pine created homogenous clusters also in Mo (DM=0.15). Birch occurred individually (DM=0.65) both in Mo and Sr. Homogenous clusters of Scots pine and birch were also found in Sr (Tab. 3). The tree species (Scots pine, pedunculate oak and silver birch) did not show any trend in terms of species mingling in Sl. The coefficient of variability for the average DM index ranged from 13 to 72%.
Tab. 3 - Average values of the DM index for particular tree species growing in disturbed stands of the Szast Protected Forest (values in parenthesis are the range of DM for plots).
| Species | DM Index |
|||
|---|---|---|---|---|
| Se | Mo | Sr | Sl | |
| Scots pine | 0.26 (0.19-0.50) |
0.15 (0-0.47) |
0.24 (0-0.42) |
0.41 (0.29-0.62) |
| Norway spruce | 0.34 (0.03-0.70) |
- | - | - |
| Pedunculate oak | 0.85 | 0.08 | - | 0.63 (0.45-0.80) |
| Silver birch | - | 0.65 (0.37-0.94) |
0.28 (0.13-0.78) |
0.54 (0.38-0.67) |
| European beech | 0.36 (0-0.83) |
- | - | - |
Height diversity (TH index)
The spatial diversity of the tree height was moderate (0.4<TH<0.6) or high (TH>0.6) in the investigated stands. TH values ranged from 0.36 to 0.68 in the slightly disturbed stands (11 plots exhibited medium diversity, 9 high diversity). Medium tree height differentiation dominated in the moderately disturbed stands (16 plots in Mo). Only in the case of three plots did the trees show a high diversity of this tree characteristic. The TH index in the severely disturbed parts of the forest (Sr and Sl) was moderately diverse in terms of tree height (Tab. 2). The distribution of the TH values in the differentiation classes (results not shown) confirmed the medium and high diversity of tree height. The coefficient of variability for the height differentiation index, which ranged from 11 to 21%, was the lowest in comparison to all of the analyzed spatial indices. The lowest values of CV were observed in both variants of the severely disturbed forest (12 and 13%), while the highest CV was recorded for the moderately disturbed stand (21%).
Complex structural diversity (SI index)
The range of the SI index values distinctly differed between the parts of the forest with different disturbance severity. The forests with slight or moderate disturbance showed a wider range of SI values; in contrast, the severely disturbed forests showed a narrower range (Tab. 2).
In the plots located in slightly disturbed parts of the forest (Se), the most abundant were those that can be described by the random distribution of trees with low species diversity and moderate differentiation of tree height (5 cases). For these plots, the complex diversity index ranged from 0.26 to 0.48. Three plots (the second rank) showed a clumped arrangement of specimens and moderate species and height diversity, with SI index values ranging from 0.52 to 0.70. One of these plots showed the highest SI value observed in this part of the forest. The lowest overall structural diversity was observed for the plot with a regular distribution of trees with small species diversity but with a high diversity of tree height (SI=0.23).
In the moderately disturbed stands (Mo), the most abundant plots were those with a random arrangement of specimens, with moderate species diversity and moderate tree height differentiation (4 cases). The SI index calculated for these sites ranged from 0.43 to 0.50. The highest value of complex structural diversity was found for the plot with a random distribution of trees and high diversity with respect to species composition and tree height (SI=0.72). The lowest SI value was recorded for the plot in which trees were regularly dispersed and which presented low species and height diversity (SI=0.22).
In the severely disturbed part of the forest with timber left on the ground, the most abundant plots were characterized by the clumped distribution of specimens, the low species diversity and the moderate differentiation of tree height (3 cases). The SI values for these plots ranged from 0.32 to 0.44. The highest SI was observed for the plot where trees were randomly dispersed and showed moderate species diversity and high tree height differentiation (SI=0.55). The lowest SI index was found in the case of the regular arrangement of specimens with a low species diversity and moderate tree height differentiation (SI= 0.11).
Plots located in the severely disturbed part of the forest where timber was removed could be described by the random allocation of trees with moderate species and height diversity (6 cases). The SI for these plots ranged from 0.51 to 0.59. The highest value of the complex structural diversity index was found in the case of the clumped distribution of trees and moderate species and height diversity (SI=0.61), whereas its lowest value was found on the plot with regular tree dispersion and moderate species and tree height differentiation.
Discussion
Species abundance and composition of regeneration
Regeneration covered less than 25% of the study plots. The process of regeneration began just after the wind blowdown and will continue in the upcoming years. The regeneration cover in the slightly disturbed stands was lower than 15%. The high density of surviving tree species negatively influenced the recruitment of new regeneration ([7]). In severely disturbed stands, increased light stimulates seed germination and the growth of seedlings present in the seedling bank ([45]).
The highest diversity of young growth (seedlings and saplings) was found in the forest with severe disturbance and without any salvage logging. In contrast, the severely disturbed forests with partial salvage logging were characterized by a lower share of trees, similar to the situation observed on the slightly disturbed plots. In the first case, a lower level of regeneration could be attributed to logging, which could destroy already established seedlings and saplings ([19], [29], [33]). The lowest share of young growth observed on the slightly disturbed plots could result from the insufficient amount of light reaching the ground because of the remaining tree canopy, thus preventing the establishment of a new generation of trees. In contrast to our results, Schönenberger ([34]) reported that in the case of mountain forests, the salvage-logged windthrow areas showed generally higher levels of natural regeneration than those observed in unharvested areas. Similar conclusions were drawn for lowland spruce forests by Ilisson et al. ([12]). Močalov & Lässig ([19]) reported that regeneration in windthrow areas in Central Ural was the most abundant on sites where woody debris was cleared after the disturbance and the lowest on those that were not cleared.
On the other hand, Peterson & Leach ([29]) reported a lack of significant differences in the density of tree seedlings in salvaged and unsalvaged areas 2 years after the wind storm, although the first had a greater variety of microsites.
Our findings confirmed the general statement that the occurrence of a natural disturbance can modify the species composition of the stand and increase overall biodiversity ([12], [9]). In the Szast PF, Scots pine was the main tree species before the disturbance. Subsequently, pine still dominated in the regeneration on most plots, but other tree species - oak, birch, beech and spruce - were found as well. In addition to pioneer tree species (pine and birch), late successional tree species (e.g., beech) may occur in the regeneration. The presence of beech was, however, associated with the slight disturbance of the tree canopy. A low disturbance level creates sufficient light conditions beneath the canopy, favoring the growth of light intolerant tree species such as beech or spruce. Oak, a more light demanding species than beech or spruce, was found at each level of disturbance but was the most abundant in the severely disturbed plots without logging. The severity of disturbance can modify the species composition in different ways. In the case of the totally devastated stands where all the overstory trees are damaged, the potential exists for early successional tree species that can then occupy large areas after the windthrow. Gap replacement, where canopy gaps are created by the death of single to several overstory trees, can lead to a mixed regime of cohort replacement and to forests dominated by shade-tolerant tree species. It is obvious that the success of regeneration depends also on the presence of the seed bank within the landscape, as well as the capacity of the tree species to regenerate on the microsites created by the windthrow ([26], [24], [38], [21]).
Spatial pattern of natural regeneration
The nonrandom distribution of seedlings and saplings is usually attributed to the microsite mosaic created by the disturbance ([16], [25], [43], [48], [1], [9]). The most common pattern of seedling and sapling distribution in the case of the analysed stands was random, which was present regardless of the disturbance severity in the forest. The clumped or hyperdispersed distribution of regeneration was found much less often. For example, the random distribution of regeneration at the large spatial scale after the disturbance was reported by Allen et al. ([1]). Nagel et al. ([25]) noted the clumped distribution of seedlings and saplings of fir and beech after the windthrow in southern Slovenia. Also Kuuluvainen & Juntunen ([17]) and Kuuluvainen & Kalmari ([16]) documented the aggregated distribution of pine, birch and spruce regeneration in the disturbed areas. The prevailing random distribution in young growth can be partly attributed to the low number of uprooted trees and the high number of snapped trees ([5]). Uprooted trees create specific microhabitats, the so-called pits and mounds, which are very suitable for the germination of new seedlings and their further growth, and such microsites would be more favorable for the non-random spatial pattern of recruits.
Species mingling and size differentiation in regeneration
Our results showed that only Scots pine was characterized by more homogenous structural groups of regeneration than the other tree species. This structural grouping was pronounced, especially on the plots with moderate disturbance. In contrast to pine, oaks were scattered among the other tree species, creating more differentiated species groups. The scattered distribution of oaks may be attributed to the dispersion of acorns by jays, which is a common way of propagation ([22]). Birch trees were scattered among other trees species in the severely disturbed stands, both with and without logging, but birch formed more homogenous groups in the moderately damaged stand. This spatial pattern of birch regeneration could be attributed to the fact that most trees were snapped but not uprooted. For example, Kuuluvainen & Juntunen ([17]) reported that birch recruits avoided undisturbed ground and preferred uprooting spots. Pine regeneration took place at ground level, as well as on or beside downed logs and stumps. They note also that both species differed in respect to the local relief and that pine recruits occurred generally closer to the ground. While there are many examples in the literature of the effect of windthrow on species composition change ([44], [2], [48], [6], [11], [3]) and the relationships between gaps, disturbed microsites and the occurrence and growth of regeneration, there are no reports about how windthrow affects the regeneration structure with respect to tree size. Our results indicated rather high differentiation in young growth height. This negative spatial autocorrelation of tree height indicated that trees of different height existed as patches and a local size hierarchy developed 11 years after the windthrow. After an extensive windstorm, a substantial part of natural regeneration is formed by broadleaved species (birch, oak, and beech), which is probably due to the disturbed soil surface, increased light level (oak and beech), and the easy dispersal of pioneer species seed (birch - [7]). The plots located in the severely disturbed forest (Sr and Sl) showed, however, a lower inequality of plant height than was found in the other plots.
Overall diversity of regeneration
To find the differences between the plots with different disturbance severity, we calculated the overall structural diversity index following Pastorella & Paletto ([28]). The highest values of the index were observed in the plots where mingling and differentiation indices showed high diversity, while the spatial positioning index was of minor significance. In contrast, the lowest overall structural diversity referred mostly to the regular pattern of young growth and low species mingling, irrespective of the disturbance severity in the forest.
Conclusion
Our study confirmed the significant effect of natural disturbance events on the species composition change in the Szast PF. Even-aged, one-layered monocultures of pine stands before the blowdown can be replaced by a more diversified forest in terms of the spatial distribution of trees, species composition and size differentiation, reflecting a more complex structure. Despite the presence of pioneer trees (pine and birch), late successional tree species (e.g., beech) can be found in the regeneration, and the different damage levels play a role in modifying the species composition and abundance. The number of seedlings and saplings of all trees varied between the stands ([7]). The most common type of seedling and sapling distribution was random, which occurred independently of the disturbance severity in the forest. The clumped and hyperdispersed distribution patterns of regeneration were observed much less often. Eleven years after the disturbance event young growth of different height existed as patches.
Acknowledgements
JS wrote the manuscript and analyzed the data; DD designed the experiment, carried out the field measurements, wrote the manuscript. We would like to thank Bogdan Pawlak for his help in the field works. We wish also to thank three anonymous reviewers for valuable suggestions and comments on an earlier version of the manuscript. The study was realized under the project funded by the General Directorate of State Forests (BLP-359) and the Ministry of Sciences and High Education (Grant No. 240110).
References
Gscholar
Gscholar
Gscholar
Gscholar
Gscholar
Gscholar
Gscholar
Gscholar
Gscholar
Gscholar
Gscholar
Authors’ Info
Authors’ Affiliation
Department of Silviculture, Faculty of Forestry, Poznan University of Life Sciences, Wojska Polskiego 69, 60-625 Poznan (Poland)
Forest Research Institute, Department of Forest Ecology, Braci Lesnej 3, 05-090 Raszyn (Poland)
Corresponding author
Paper Info
Citation
Szmyt J, Dobrowolska D (2016). Spatial diversity of forest regeneration after catastrophic wind in northeastern Poland. iForest 9: 414-421. - doi: 10.3832/ifor1699-008
Academic Editor
Matteo Garbarino
Paper history
Received: May 06, 2015
Accepted: Nov 05, 2015
First online: Jan 29, 2016
Publication Date: Jun 01, 2016
Publication Time: 2.83 months
Copyright Information
© SISEF - The Italian Society of Silviculture and Forest Ecology 2016
Open Access
This article is distributed under the terms of the Creative Commons Attribution-Non Commercial 4.0 International (https://creativecommons.org/licenses/by-nc/4.0/), which permits unrestricted use, distribution, and reproduction in any medium, provided you give appropriate credit to the original author(s) and the source, provide a link to the Creative Commons license, and indicate if changes were made.

Web Metrics
Breakdown by View Type
Article Usage
Total Article Views: 51358
(from publication date up to now)
Breakdown by View Type
HTML Page Views: 41795
Abstract Page Views: 3703
PDF Downloads: 4484
Citation/Reference Downloads: 24
XML Downloads: 1352
Web Metrics
Days since publication: 3805
Overall contacts: 51358
Avg. contacts per week: 94.48
Article Citations
Article citations are based on data periodically collected from the Clarivate Web of Science web site
(last update: Mar 2025)
Total number of cites (since 2016): 11
Average cites per year: 1.10
Publication Metrics
by Dimensions ©
Articles citing this article
List of the papers citing this article based on CrossRef Cited-by.
Related Contents
iForest Similar Articles
Research Articles
Assessing forest resilience after windthrow: linking deadwood, regeneration, and landscape-scale susceptibility - A case study in a Pre-Alpine forest in Italy
vol. 19, pp. 102-113 (online: 07 April 2026)
Research Articles
Short- and long-term natural regeneration after windthrow disturbances in Norway spruce forests in Bulgaria
vol. 11, pp. 675-684 (online: 23 October 2018)
Research Articles
Modelling natural regeneration of Oak in Saxony, Germany: identifying factors influencing the occurrence and density of regeneration
vol. 16, pp. 47-52 (online: 16 February 2023)
Research Articles
Soil microorganisms at the windthrow plots: the effect of post-disturbance management and the time since disturbance
vol. 10, pp. 515-521 (online: 20 April 2017)
Research Articles
Density and spatial distribution of beech (Fagus sylvatica L.) regeneration in Norway spruce (Picea abies (L.) Karsten) stands in the central part of the Czech Republic
vol. 9, pp. 666-672 (online: 12 March 2016)
Research Articles
First results on early post-fire succession in an Abies cephalonica forest (Parnitha National Park, Greece)
vol. 5, pp. 6-12 (online: 06 February 2012)
Research Articles
Spatial structure of the vertical layers in a subtropical secondary forest 57 years after clear-cutting
vol. 12, pp. 442-450 (online: 16 September 2019)
Research Articles
Post-fire effects and short-term regeneration dynamics following high-severity crown fires in a Mediterranean forest
vol. 5, pp. 93-100 (online: 30 May 2012)
Research Articles
Spatial distribution pattern of Mezilaurus itauba (Meins.) Taub. Ex mez. in a seasonal forest area of the southern Amazon, Brazil
vol. 9, pp. 497-502 (online: 25 January 2016)
Research Articles
Scale dependency of the effects of landscape structure and stand age on species richness and aboveground biomass of tropical dry forests
vol. 16, pp. 234-242 (online: 23 August 2023)
iForest Database Search
Search By Author
Search By Keyword
Google Scholar Search
Citing Articles
Search By Author
Search By Keywords
PubMed Search
Search By Author
Search By Keyword


