Diurnal surface fuel moisture prediction model for Calabrian pine stands in Turkey
iForest - Biogeosciences and Forestry, Volume 12, Issue 3, Pages 262-271 (2019)
doi: https://doi.org/10.3832/ifor2870-012
Published: May 03, 2019 - Copyright © 2019 SISEF
Research Articles
Abstract
This study presents a dynamic model for the prediction of diurnal changes in the moisture content of dead surface fuels in normally stocked Calabrian pine stands under varying weather conditions. The model was developed based on several empirical relationships between moisture contents of dead surface fuels and weather variables, and calibrated using field data collected from three Calabrian stands from three different regions of Turkey (Mugla, southwest; Antalya, south; Trabzon, north-east). The model was tested and validated with independent measurements of fuel moisture from two sets of field observations made during dry and rainy periods. Model predictions showed a mean absolute error (MAE) of 1.19% for litter and 0.90% for duff at Mugla, and 3.62% for litter and 14.38% for duff at Antalya. When two rainy periods were excluded from the analysis at Antalya site, the MAE decreased from 14.38% to 4.29% and R2 increased from 0.25 to 0.83 for duff fuels. Graphical inspection and statistical validation of the model indicated that the diurnal litter and duff moisture dynamics could be predicted reasonably. The model can easily be adapted for other similar fuel types in the Mediterranean region.
Keywords
Fuel Moisture Content, Modeling, Drying Rate, Vapor Pressure Deficit
Introduction
The ignition, growth and development of forest fires are highly dependent on the availability and conditions of forest fuels ([25]). Moisture content of the fuels determines the availability of the fuel for combustion ([33]). The prediction of surface fuel moisture is of primary importance in fire management and modeling, and requires sound models of fuel moisture dynamics.
In general, two different modeling approaches have been used to predict moisture content of dead fuels: empirical and process-based models ([21]). Most fuel moisture prediction models are empirical ([28], [11]) and use statistical equations to construct relationships between input weather variables and fuel moisture contents from field measurements. However, empirical models are static in nature and may be reliable only within the constraints of a particular data set, or for circumstances that are similar to those where the data were gathered ([35]). Process-based models are designed to predict fuel moisture contents from the simulation of processes occurring in the fuels based on physics ([24], [19]), or empirical fundamentals or both ([29], [45]). Such a modeling approach requires theoretical understanding of the processes involved and their parameter values ([21]). Additionally, they are usually complex and require many parameters that are not practically measured in the field ([14]).
Regression and process-based models may, on their own right, provide very successful results. However, limitations and complexities of existing models limit their use under different conditions. The power of statistical and physical models may be increased by combining empirical and theoretical modeling approaches ([35]). Here an attempt was made to construct a state-dependent dynamic model using empirical relationships that are structured in such a way as to mimic most important fuel moisture dynamics processes such as desorption and adsorption, thereby maintaining an acceptable level of functional realism as opposed to precision or generality. The proposed model simulates diurnal changes in the moisture content of surface fuels based on the difference between concurrent fuel moisture and equilibrium moisture content (EMC), regulated by Timelag. EMC and Timelag are intermediate variables used to predict fuel moisture contents in the model. EMC is the fuel moisture content attainable under constant temperature and relative humidity conditions ([4]). Timelag, varying in relation to environmental conditions, determines moisture response characteristics of dead surface fuels between concurrent fuel moisture and EMC ([6]).
In the proposed model, environmental conditions determine the surface fuel moisture content, and moisture dynamics are considered to depend mostly on weather variables such as relative humidity, air temperature, wind speed and precipitation ([36], [44]). Surface fuels increase their moisture from condensation, precipitation and through the adsorption of water vapor ([46]). Soil moisture is also known to affect duff and surface litter moisture ([49]). However, soil moisture effect was not accounted for in this study. Dead fuels lose their moisture by evaporation and desorption ([11]). Adsorption and desorption are complementary processes governed by relative humidity, air temperature and the rate of diffusion of moisture through the fuel ([23]). Wind and solar heating are other weather factors driving fuel moisture dynamics ([29]).
The objective of this study is to develop a dynamic model to predict surface fuel moisture dynamics on an hourly basis during dry and rainy periods in a “standard fuel type” characterized by fully grown, normally stocked Calabrian pine (Pinus brutia L.) stands. Calabrian pine has a wide distribution in the eastern Mediterranean region and is the most common tree species in Turkey, covering a land area of 5.85 million ha (the largest area worldwide - [10]). Pure natural stands of Calabrian pine are mostly found in fire prone areas in Turkey and usually originate from high-intensity, stand-replacing fires ([41]). Most fires occur in pure or mixed Calabrian pine stands, often leading to the loss of goods, services, resources and even lives in Turkey ([40]).
Many efforts have been made to predict moisture content of surface fuels in Pinus stands ([43], [2], [28], [39], [34]) including Mediterranean sites ([30], [11], [17], [3]). However, predictions of the models for comparable weather conditions may differ significantly due to differences in fuel characteristics for different species ([28]) and locations. Moreover, only two studies involved Calabrian pine stands so far ([30], [3]); the first study produced daily predictions only, with no provisions for diurnal changes in surface fuel moistures, while the latter provided diurnal predictions, but for precipitation-free periods only.
Material and methods
Model overview
A state-dependent model of surface fuel moisture dynamics was developed. The model can be considered a blend of empirical and process-based models. In that, it utilizes empirical relationships to quantitatively describe functional relationships that are common to a wide range of situations rather than fitting limited moisture responses from a set of measured situations. The model is based on the rate of change of fuel moisture contents depending on the difference between the concurrent fuel moisture and the equilibrium moisture content, and on timelag ([6] - eqn. 1).
where FMC(t) is the fuel moisture content at time t (%), EMC is the equilibrium moisture content (%), TLC is the timelag constant (hour). EMC refers to the fuel moisture content finally attained under a constant temperature and relative humidity conditions, while TLC refers to the time for a particle of dead surface fuels to gain or lose approximately 2/3 of the moisture contents between concurrent fuel moisture and EMC ([17]).
As can be derived from eqn. 1, FMC(t) does not incorporate the effects of new rainfall nor condensation. The rain effect was incorporated into the model based on a sigmoid relationship developed using previous fuel moisture content, the amount of rain and saturation moisture content. The condensation effect was incorporated using an inverse sigmoid relationship developed using vapor pressure deficit (VPD), assuming that at low values of VPD (i.e., at very high relative humidity and low temperature values) water condenses on fuel surfaces ([48]).
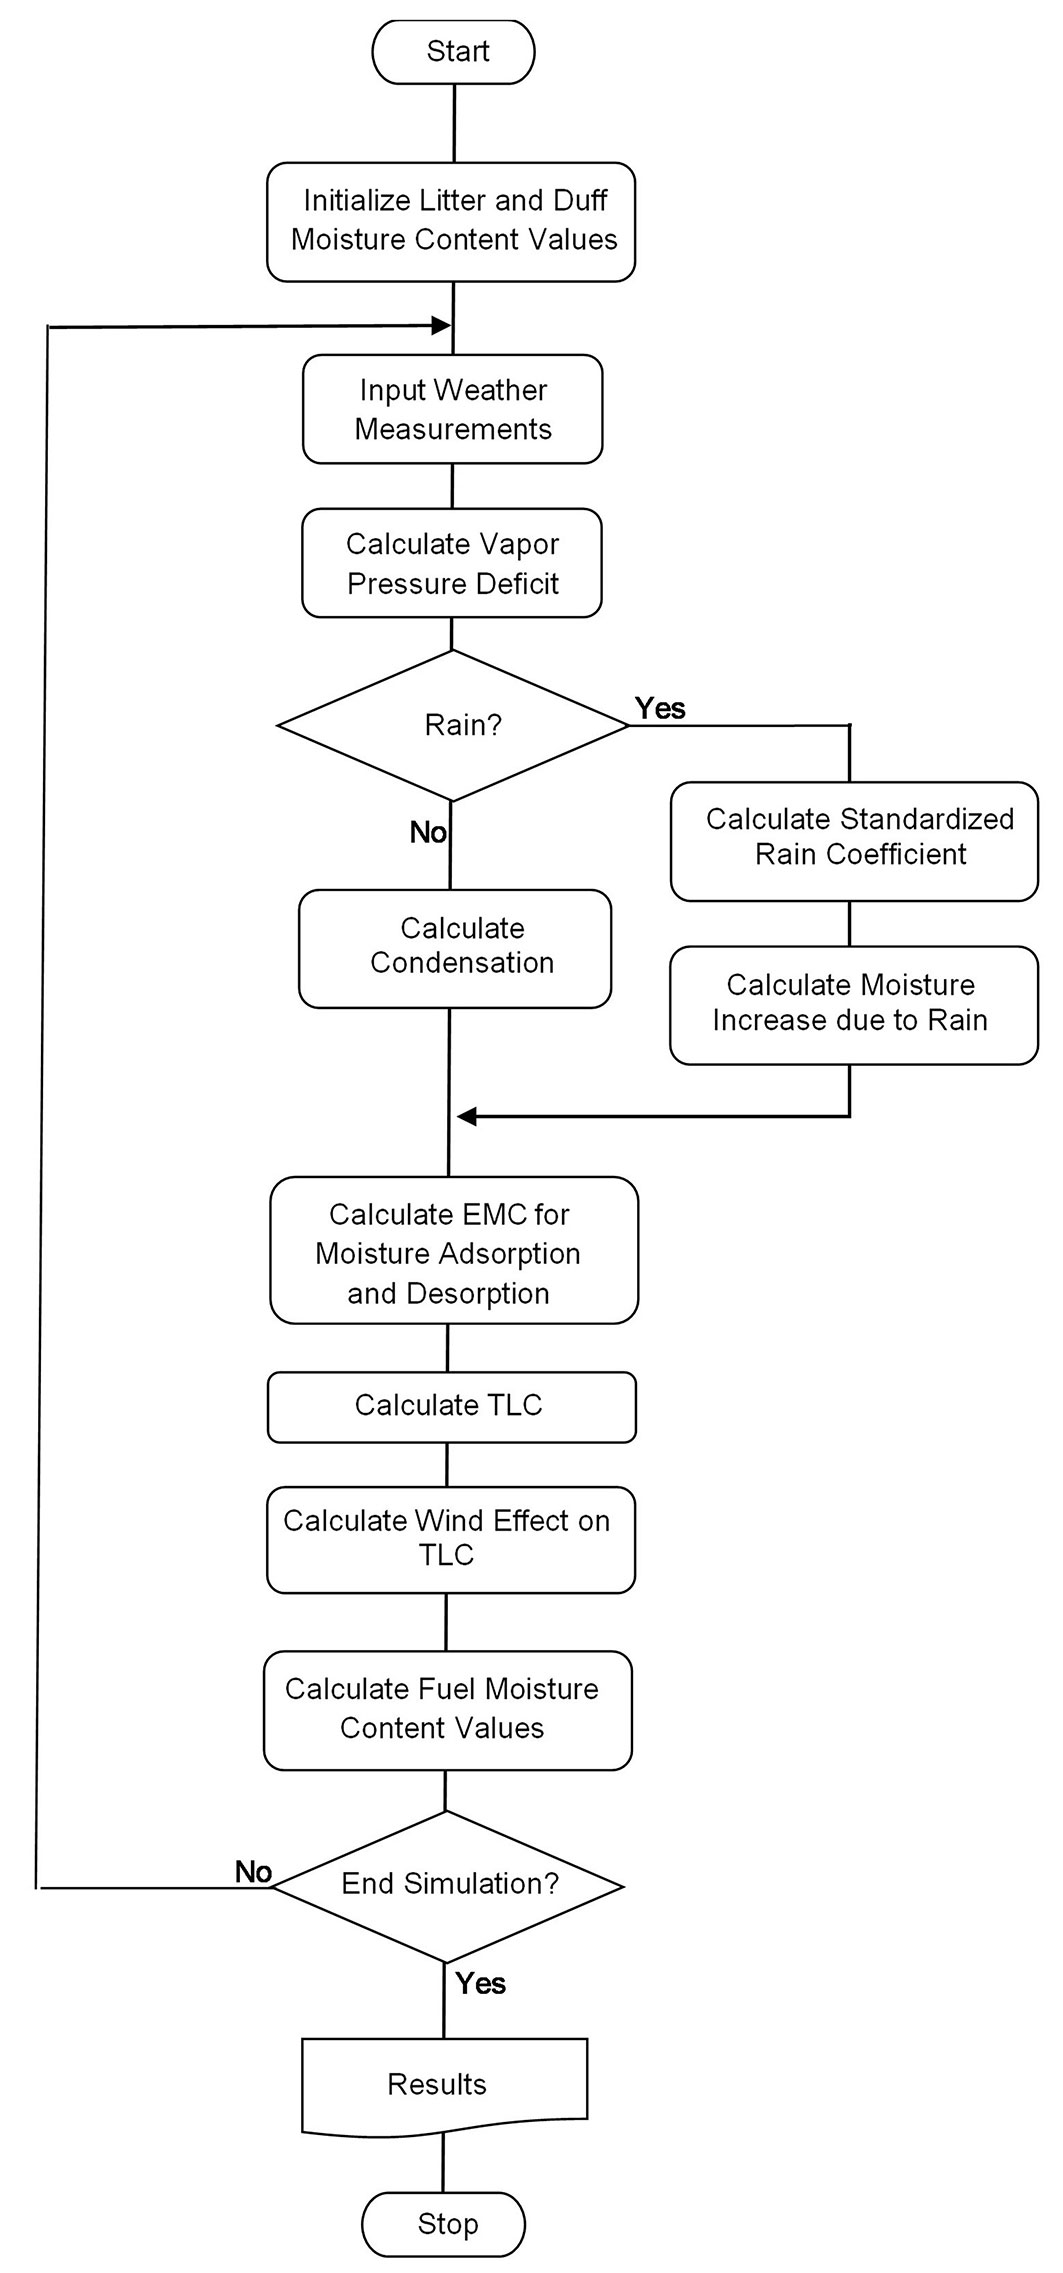
A simplified model flow chart is shown in Fig. 1. Major components of the model include: (i) input and initialization; (ii) moisture content increase due to rain; (iii) condensation effect; (iv) equilibrium moisture content calculation (EMC); (v) timelag and fuel moisture calculations. Diurnal moisture dynamics are determined hourly in the order set out in Fig. 1. Calculated moisture contents at the end of each hour are taken as the starting conditions for the next hour. The model requires as input hourly air temperature, relative humidity, wind speed and rainfall. A complete list of the variables included in the model are given in Tab. 1. The model components are described in more detail hereafter.
Fig. 1 - Flowchart of the model.
Tab. 1 - Definition of variables used in model specification.
| Variable | Description | Unit |
|---|---|---|
| CE | Condensation effect on surface fuels | mm |
| EMC | Equilibrium moisture content | % |
| FMIr | Fuel moisture increase due to rain | % |
| FMIc | Fuel moisture increase due to condensation | % |
| SMC | Saturation moisture content | % |
| FMC | Fuel moisture content | % |
| R | Rainfall | mm |
| RRFS | Rain required for saturation | mm |
| RH | Relative humidity | % |
| T | Air temperature | °C |
| TLC | Timelag constant | hour |
| W | Wind speed | km h-1 |
| VPD | Atmospheric vapor pressure deficit | Pa |
| FL | Fuel load | kg m-2 |
Input and initialization
The model requires values for litter and duff moisture to start simulation. Initial values can either be entered manually or calculated by running the model for three days to establish a reference moisture value, using respective weather data with an arbitrary initial moisture content value of thirty-five percent (i.e., moisture of saturation) set for litter and duff. The duration of the initialization phase was based on the literature and model results. It is suggested that one to three days of simulation would normally be enough for litter and duff fuels to reach the moisture content values expected under respective weather conditions ([29], [9]). Repeated model runs also confirmed that moisture content values expected under respective weather conditions are reached within 24 hours of simulation, regardless of the initial moisture content values. Once the final reference values are obtained, these values are accepted as the initial values for litter and duff for the next hour of the simulation.
Fuel moisture increase due to rain (FMIr)
The amount of rain is important to consider when estimating dead fuel moisture content as it can raise surface dead fuels moisture content more rapidly than any other weather variable. Surface fine dead fuels, especially litter, react very rapidly to rain and reach the saturation point quickly ([47]). Additional rain has little effect on surface fuels approaching the saturation point ([45]). Based on the information above, a new relationship was developed to calculate moisture content increase after a rain event. The relationship uses previous fuel moisture content, the amount of rain, the amount of rain required for saturation and saturation moisture content. The increase of fuel moisture due to rain (FMIr, %) was calculated as (eqn. 2):
where R is the amount of rain (mm), SMC is the saturation moisture content (%), FMC is the fuel moisture content (%), a1 and a2 are model parameters; WCF is the water content of fuels (kg m-2, mm equivalent), which was estimated as (eqn. 3):
while RRFS is the rain amount required for saturation (mm), obtained as follows (eqn. 4):
where FL is the fuel load (litter or duff, kg m-2), and b1 is the model parameter.
SMC is the maximum moisture content attainable for a given fuel layer (litter of duff). RRFS refers to the amount of rain required for complete saturation of dry fuels. The first part of eqn. 2 within brackets represents the rate of moisture increase after a rain event. The rate of change of moisture content depends on the amount of rain, the amount of moisture (water) currently available in fuels and the rain required for saturation. The water content of fuels in addition to the amount of rain was incorporated into the model to introduce the effect of fuel load. The difference between the present fuel moisture content (FMC) and the saturation moisture content (SMC) is then multiplied by the rate of moisture content change to calculate the increase in fuel moisture content. The relationship in eqn. 2 provides that the effect of rainfall decreases with increasing the amount of rain and the initial moisture content as the fuel moisture content approaches the saturation point ([45]). This model form also helps ensure low rates of moisture increases in the surface fuels under tree canopies at low amounts of rain (< 0.5 mm - [45]), thus accounting for the rain intercepted by tree canopies. This is accomplished by the a2 coefficient of eqn. 2, which can dynamically change according to varying conditions. Such dynamic approach has been chosen (instead of subtracting a fixed rain amount for interception) to reflect the actual amount of rain affecting surface fuels in the stands, which is inversely related to canopy closure ([50]). As for the calculations for the rainfall effect, rainfall was assumed to have occurred at the beginning of the time period.
RRFS relationship and SMC values were determined in relation to average moisture content values obtained from wetting experiments (see below). SMC values were taken as 150 and 300% for surface litter and duff, respectively. These values are comparable with those reported in the literature ([39], [18]).
Condensation effect
One of the main problems in fuel moisture modeling is the increase of fuel moisture content due to the water condensation on its surface. Condensation of water on surface fuels can be caused by both water deposition from the atmosphere by distillation and the upward water transport from the soil by turbulent diffusion ([22]). So far, little work has been carried out to account for the condensation effect ([47]). Viney & Hatton ([46]) provided a physical model to quantify the effects of nocturnal condensation on the moisture content of leaf litter. However, their model is complex, requiring many parameters that are not practically measured in the field ([14]). In this study, a different model form was developed using atmospheric vapor pressure deficit (VPD) to quantify the effect of condensation on the moisture content of surface fuels. It was based on the assumption that condensation takes place at very low VPD values, corresponding to very high relative humidity (e.g., over 90%) and relatively lower temperature conditions ([48] - eqn. 5):
where CE is the condensation effect (mm), c1, c2 and c3 are model parameters to be estimated, and VPD is the atmospheric vapor pressure deficit (Pa), calculated after Bonan ([5] - eqn. 6):
where T is air temperature (°C), RH is the relative humidity (%).
In eqn. 5, the maximum amount of condensed water on fuels is represented by c1 (determined from calibration data) and is related to the surface area (i.e., fuel load - [1]). The rationale behind the inclusion of CE relationship in the model is the observed difference between the calculated EMC and the actual moisture content for fuels under very high (e.g., > 90%) relative humidity and relatively low temperature (e.g., < 15 °C). Theferore, the value of c1 was determined based on the difference between the calculated EMC and the actual values of fuel moisture content. The CE relationship (eqn. 5) has an inverse sigmoid shape, and c2 and c3 coefficients define the shape of the curve. The values of c2 and c3 were determined by multiple nonlinear regression analyses using field measurements.
The increase of fuel moisture content due to condensation (FMIc, %) was then calculated as (eqn. 7):
where FL is the fuel load (litter or duff - kg m-2).
Using the estimated moisture increase due to rain and condensation described above, fuel moisture content of litter and duff (FMC(t), %) were estimated at the beginning of the hour as follows (eqn. 8):
Equilibrium moisture content
EMC is an intermediate variable used to predict fuel moisture contents finally attained by the fuels under constant air temperature and relative humidity ([4]). Several EMC models have been proposed ([36], [42], [2], [23], [7]) and used in fuel moisture prediction models ([43], [19], [37], [17], [9]). To calculate the EMC of dead litter and duff of Calabrian pine stands, the Anderson et al. ([2])’s EMC formula for Pinus ponderosa needles, based on the desorption (EMCd) and adsorption (EMCa) models by Van Wagner ([42]) were used (eqn. 9, eqn. 10):
Timelag
Timelag is the time necessary for a fuel particle to gain or lose approximately 63.3% of the difference between its initial moisture content and its equilibrium moisture content ([6]). Timelag is important for the moisture response characteristics of fine forest fuels. It is known that timelag can vary significantly in relation to concurrent weather conditions and stand and fuel bed characteristics such as crown closure, fuel bed thickness ([44]), fuel loading and density ([2]). However, the variation between wetting and drying timelag periods is little and has no practical significance ([2]). A new relationship which considers VPD and wind was developed to calculate timelag for litter and duff fuels. VPD is calculated from relative humidity and temperature and is a measure of the drying power of the air ([5]). The timelag constant (TLC, in hours) used in the model was then calculated as (eqn. 11);
where VPD is the vapor pressure deficit (Pa), d1, d2, d3 and d4 are model parameters, which were determined by multiple nonlinear regression analyses using field measurements; the parameter kw in eqn. 11 represents a wind correction factor, which was calculated as follows (eqn. 12):
where W is the wind speed (km h-1), e1 and e2 are model parameters.
Although it may seem somewhat complex, the TLC relationship has a simple inverse sigmoid shape; d1 and d4 are the maximum and minimum timelag values, respectively, while d2 and d3 define the shape of the curve. The coefficients d1 and d4 were determined from validation data. Such relationship yields high values (slow drying) under high temperature and low relative humidity conditions. Moreover, the wind has a diminishing effect on TLC based on an inverse smoothing curve.
Timelag constant is then used along with EMC and initial moisture content of the fuels to calculate the final moisture content values at the end of the hour (FMC(t+1), %) for litter and duff (eqn. 13).
The estimated FMC(t+1) values then become the initial values for the next step of the simulation.
Data collection
Study sites
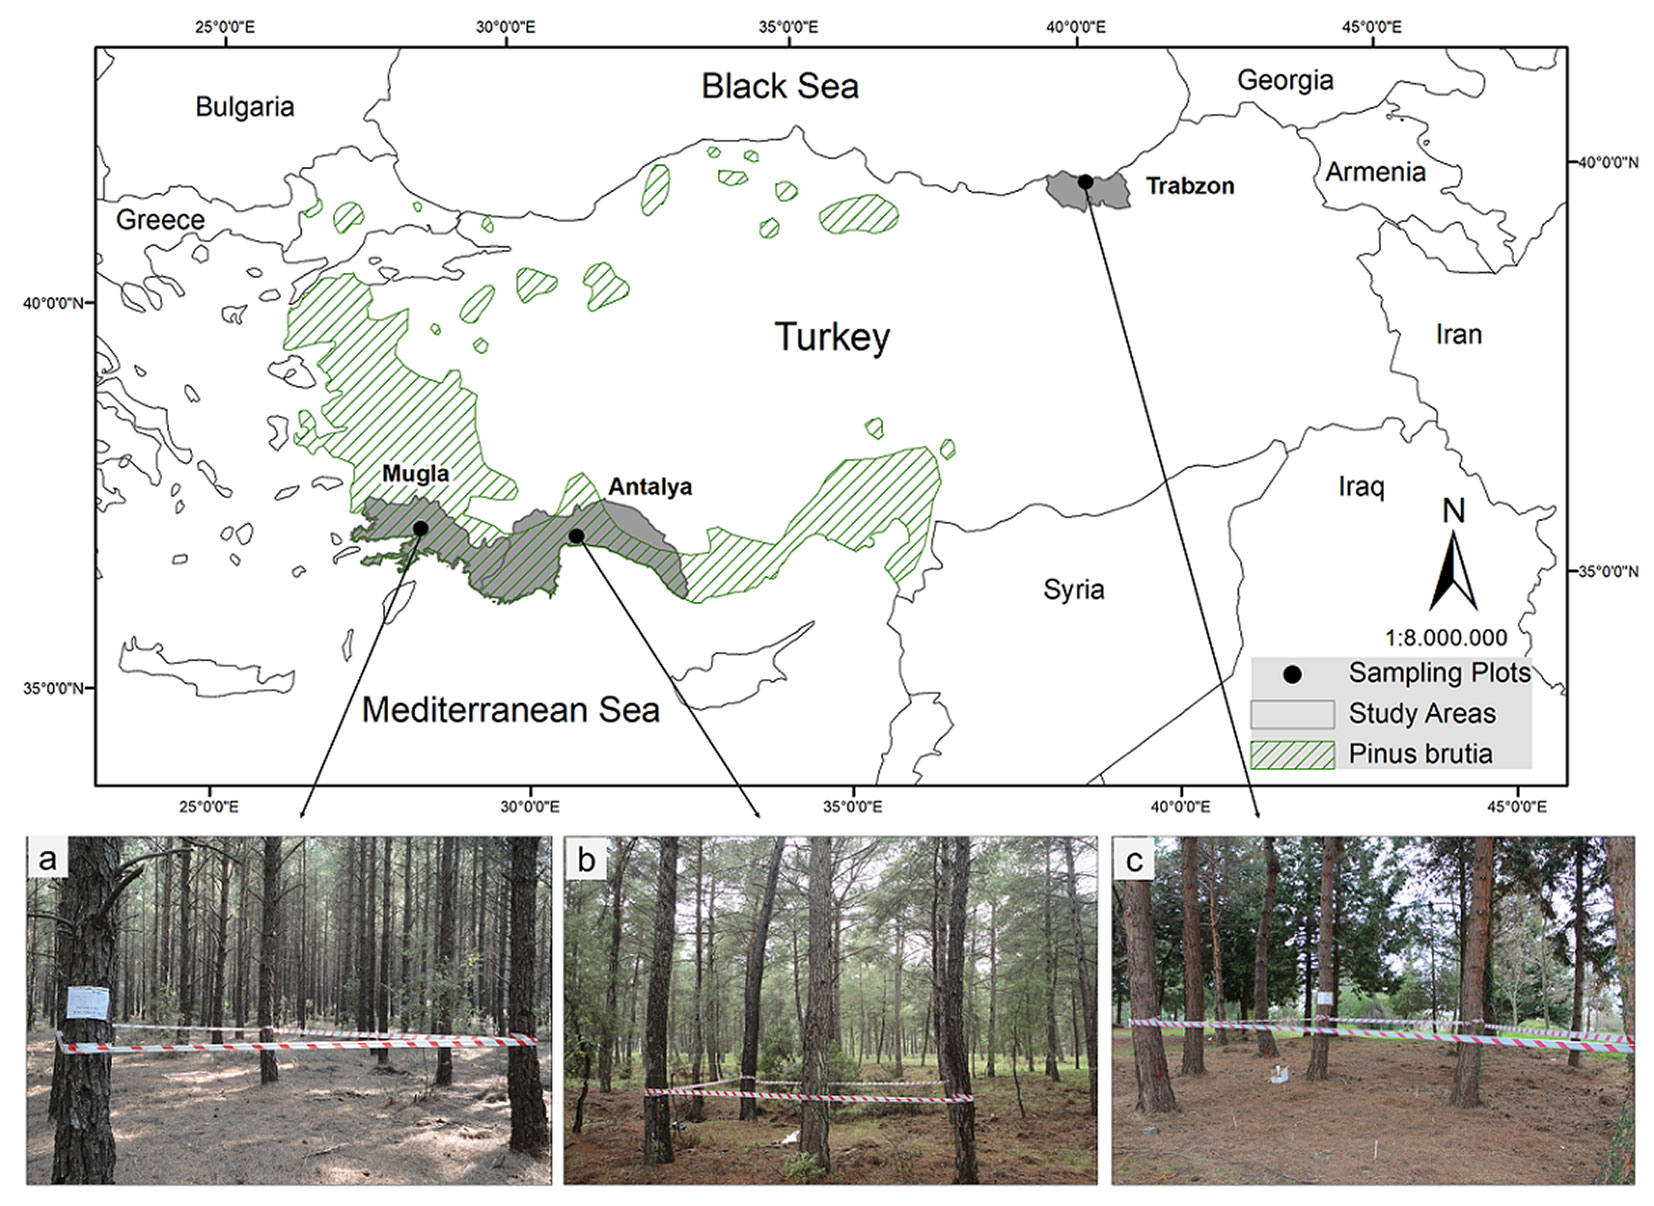
To determine the surface fuel moisture content changes under varying weather conditions, measurements were carried out in three geographic locations (Fig. 2) to reflect the widest range possible in weather parameters.
Fig. 2 - Geopraphic locations of study sites and sampling plots; Mugla (a), Antalya (b) and Trabzon (c). Dashed areas in the map shows the geographical distrubition of Calabrian pine in Turkey.
The first study area was in the Yaras State Forest in Mugla, south-western Turkey (37° 08′ N, 28° 30′ E; average elevation 750 m a.s.l.). The area has Mediterranean climate with prolonged dry summers and mild, moist winters. Average air temperature from May to October varies from 15 to 25 °C, and the average monthly rainfall ranges from 7.8 to 68.3 mm for the same period. The fire season in Mugla region generally lasts from late May until mid-September.
The second study area is in Antalya, southern Turkey (37° 08′ N, 28° 30′ E; average elevation 240 m a.s.l.). This area has climatic conditions similar to Mugla, characterized by prolonged dry summers and mild, moist winters. Average air temperature from May to October varies from 20 to 28 °C, and the average monthly rainfall ranges from 3.1 to 80.1 mm for the same period. The fire season in the Antalya region generally lasts from late May until mid-September.
The third study area was in the Trabzon region, north-eastern Turkey (40° 59′ N, 39° 46′ E; av. elev. 50 m a.s.l.). The study area has a Black Sea climate characterized by warm and humid summers, long cool/cold and damp winters with high and evenly distributed rainfall the year round. Average air temperature from November to May varies from 7 to 16 °C and average monthly rainfall is between 58.5 to 96.1 mm for the same period. The fire season in Trabzon differs from other regions and generally lasts from November until early-May.
The study was conducted in pure, normally stocked (~80-90% crown closure), and even-aged Calabrian pine stands. Sampling plots, 20 × 20 m in size, were established in normally-stocked and nearly fully-closed Calabrian pine stands in all three study areas. Plots were set up inside the stands at least 50 m away from open areas to avoid edge effect on fuel moisture. Measured stand characteristics included stand age, diameter at breast height (dbh), crown width, tree height, crown base height, canopy closure, stand density and basal area. Stand age was 41, 63 and 50 years; mean dbh 26.8, 37.1 and 34.2 cm; mean crown width 4.6, 8.3 and 5.6 m; mean tree height 14.0, 17.8 and 15.5 m; mean crown base height 8.7, 10.2 and 8.9 m; mean canopy closure 95, 80 and 85%; mean stand density 725, 250 and 450 stem ha-1; mean stand basal area 40.9, 27.0 and 41.3 m2 ha-1 for Mugla, Antalya and Trabzon, respectively.
No living plants were present in the understory within the stands, and living trees made up 100% of the overstory. Surface fuels consisted primarily of needle litter along with some branch and cone litter. Average litter and duff fuel loads in the measurement plots were 0.335, 0.396 and 0.405 kg m-2 and 1.647, 1.005 and 1.853 kg m-2 at Mugla, Antalya and Trabzon sites, respectively. Stand and surface fuel characteristics are given in Tab. 2.
Tab. 2 - Mean structural and surface fuel characteristics at the study plots.
| Feature | Variable | Units | Mugla | Antalya | Trabzon | |
|---|---|---|---|---|---|---|
| Stand | Stand Origin | - | Plantation | Natural | Plantation | |
| Stand Age | Year | 41 | 63 | 50 | ||
| Number of Plots | # | 3 | 3 | 2 | ||
| DBH (d1.30) | cm | 26.8 | 37.1 | 34.2 | ||
| Crown Width | m | 4.6 | 8.3 | 5.6 | ||
| Tree Height | m | 14.0 | 17.8 | 15.5 | ||
| Crown Base Height | m | 8.7 | 10.2 | 8.9 | ||
| Canopy Closure | % | 95 | 80 | 85 | ||
| Stand Density | Stem ha-1 | 725 | 250 | 450 | ||
| Stand Basal Area | m2 ha-1 | 40.9 | 27.0 | 41.3 | ||
| Surface Fuel | Litter | Fuel Depth | cm | 1.8 | 2.1 | 2.5 |
| Fuel Load | kg m-2 | 0.335 | 0.396 | 0.405 | ||
| Fuel Density | g cm-3 | 0.019 | 0.020 | 0.016 | ||
| Duff | Fuel Depth | cm | 4.1 | 3.2 | 3.9 | |
| Fuel Load | kg m-2 | 1.647 | 1.005 | 1.853 | ||
| Fuel Density | g cm-3 | 0.040 | 0.031 | 0.048 | ||
Weather measurements
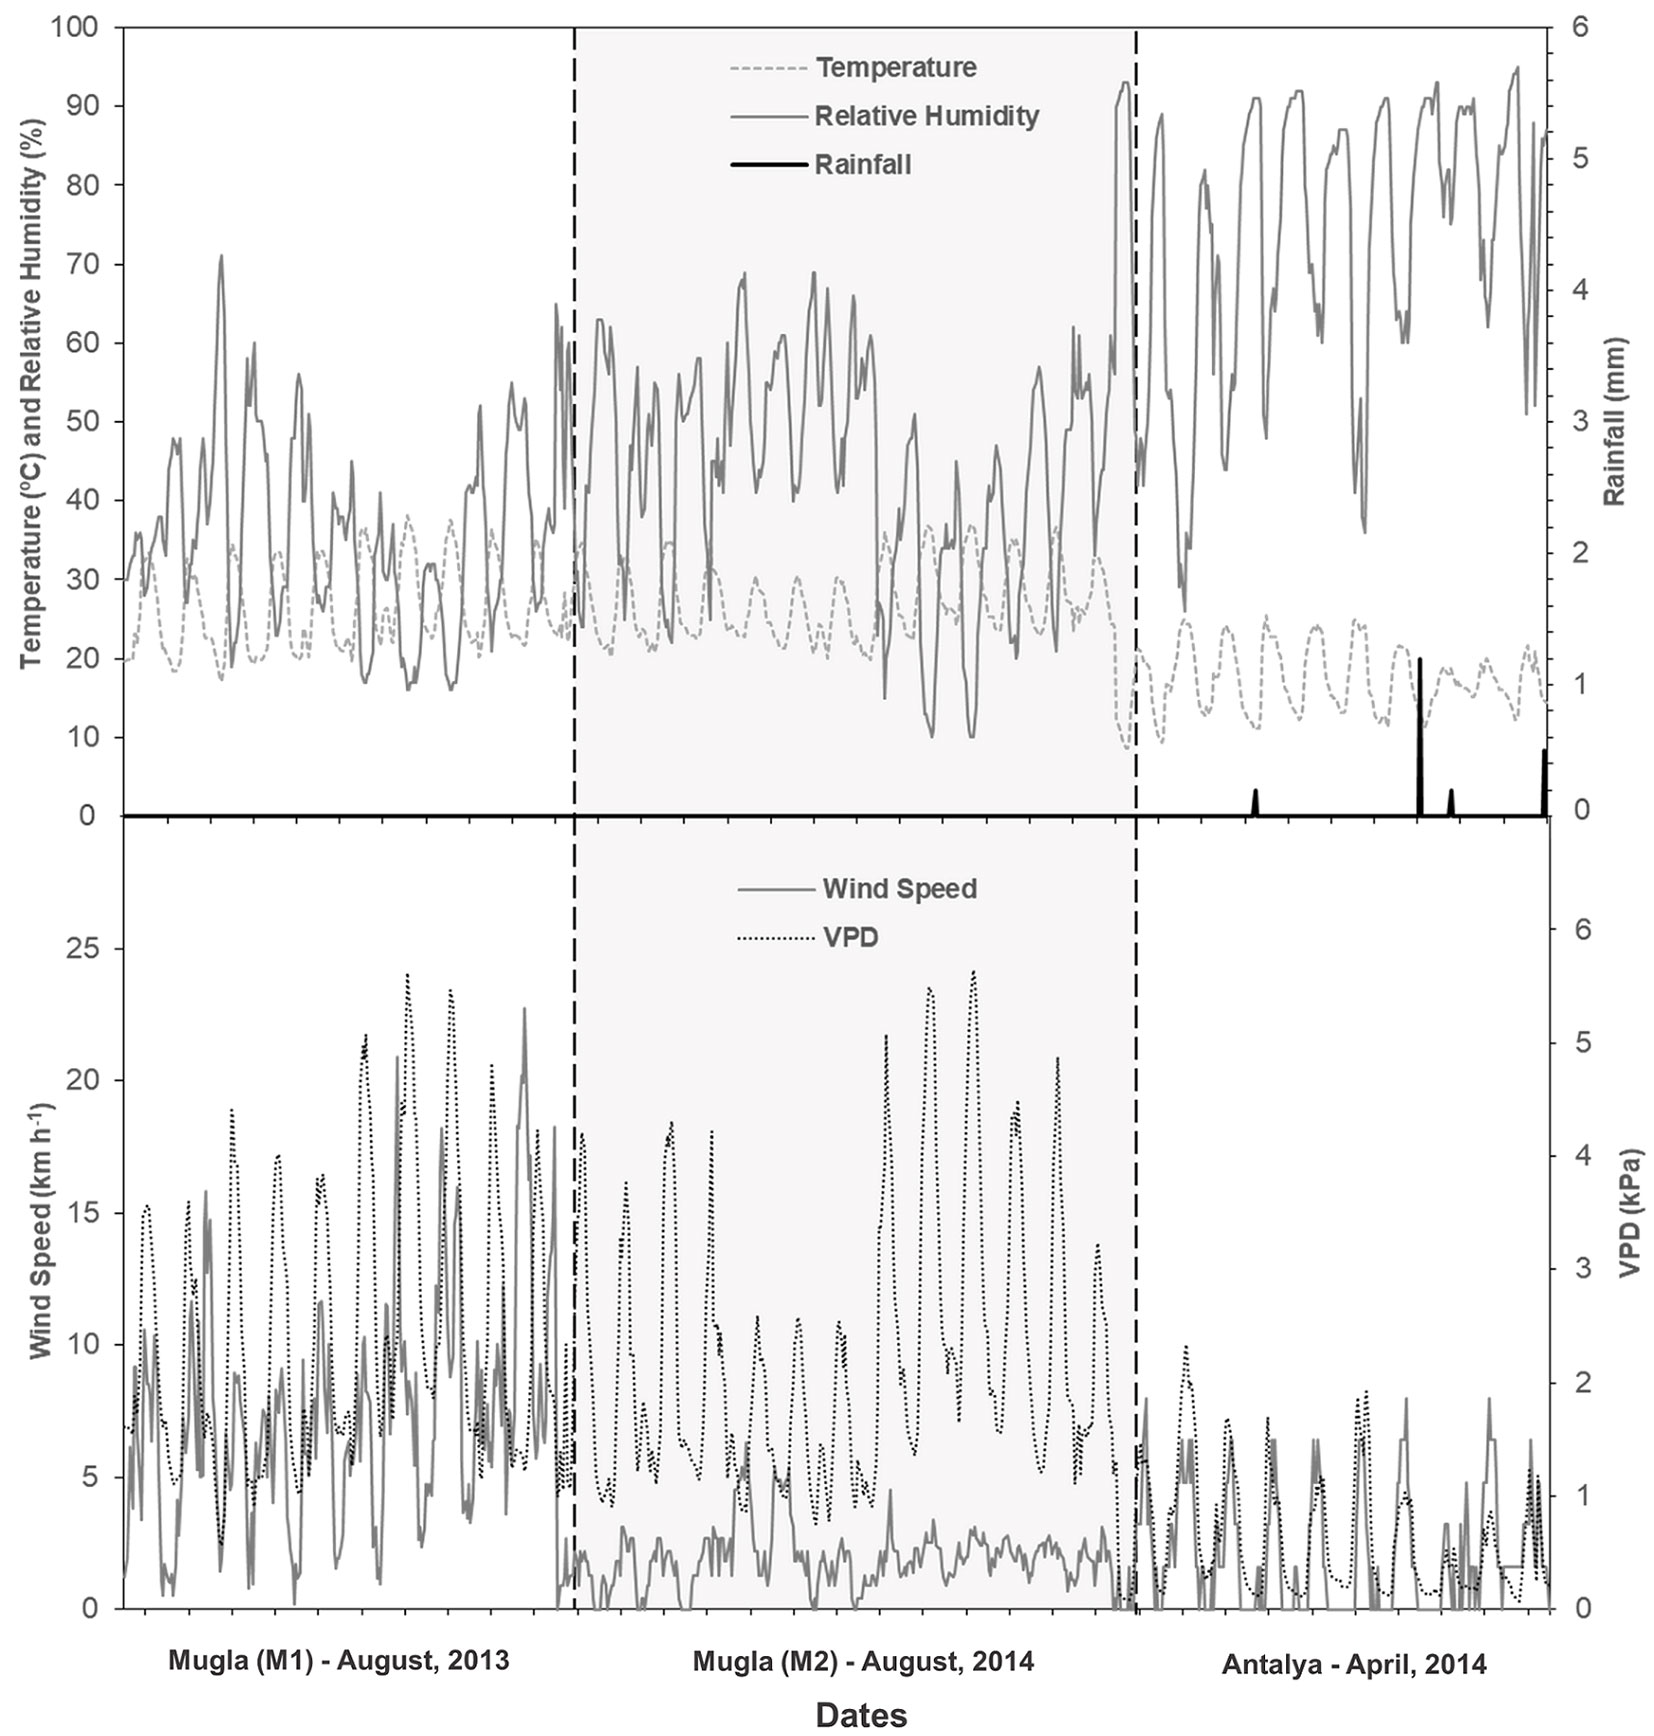
A fully automated weather station (Davis Vantage Pro™, Davis Instruments Corp., Hayward, CA, USA) was set up at the study sites to record weather variables. Measurements involved rainfall (mm), air temperature (°C), relative humidity (%), wind speed (km h-1) and direction. Weather measurements were recorded continuously during the period of fuel measurements. Weather measurements (Tab. 3) and calculated VPD values are provided in Fig. 3. Study periods included: (i) Mugla (24 days), August 22-31, 2013 (M1) and August 14-27, 2014 (M2); (ii) Antalya (10 days), April 20-29, 2014; (iii) Trabzon (83 days), February 18 - May 10, 2016.
Tab. 3 - Weather and fuel moisture variables for the study areas. (M1, M2, A, T): different study periods at the three sampling sites (see text); (a): wind speed was measured at 10 m standard height in the open ground ([16]); (b): wetting experiment in Trabzon, where values represent moisture contents after wetting; (SD): standard deviation.
| Feature | Variable | Stats | Mugla | Antalya | Trabzon | Trabzon WE (b) | |
|---|---|---|---|---|---|---|---|
| M1 | M2 | A | T | T | |||
| Weather | Temperature (°C) |
Min | 17.1 | 19.9 | 8.6 | 2.4 | - |
| Mean | 26.7 | 27.2 | 17.2 | 13.1 | - | ||
| Max | 38.2 | 37 | 25.5 | 20.4 | - | ||
| Relative Humidity (%) | Min | 16 | 10 | 26 | 8 | - | |
| Mean | 35.4 | 44.5 | 73.4 | 72.4 | - | ||
| Max | 71 | 69 | 95 | 96 | - | ||
| Wind Speed (a) (km h-1) |
Min | 0.2 | 0 | 0 | 0 | - | |
| Mean | 7.4 | 1.9 | 2.1 | 4.2 | - | ||
| Max | 22.7 | 6.3 | 8 | 20.9 | - | ||
| Rainfall (mm) | Max | 0 | 0 | 1.2 | 2.8 | - | |
| Fuel Moisture | Litter Moisture (%) |
Min | 3.6 | 4.8 | 5.5 | 15.4 | 22.8 |
| Mean | 8.8 | 8.4 | 17.9 | 24.7 | 72.7 | ||
| Max | 17.2 | 11.6 | 51.8 | 50.7 | 160.2 | ||
| SD | 2.9 | 1.4 | 17.8 | 9.3 | 21.9 | ||
| Duff Moisture (%) |
Min | 6.3 | 5.7 | 9.1 | 44.2 | 71.2 | |
| Mean | 8.1 | 9.2 | 32.3 | 67.8 | 160.9 | ||
| Max | 10.3 | 12.8 | 81.1 | 98.9 | 360.3 | ||
| SD | 1 | 1.9 | 24.6 | 13 | 59.2 | ||
Fig. 3 - Temperature, relative humidity, rainfall, wind speed and vapor pressure deficit values during the study for Mugla (M1 and M2) and Antalya sites.
Fuel moisture measurements
Surface fuel moisture measurements were carried out in the sampling plots every two hours between 09:00-19:00. Five fuel samples were taken from each plot for each sampling time. Each sample was obtained from a sub-plot measuring 15 × 20 cm. All fuels within the sub-sampling plot was removed and separated as surface litter (L layer, newly fallen surface litter) and duff (F layer, decomposed and/or decomposing organic matter below L layer). Fuel samples were sealed in plastic containers, weighed with 0.01 g precision and taken to the laboratory. Measurements continued until the end of the study period. All litter and duff samples were oven-dried at 105 °C for 24 h and weighed to obtain fuel moisture contents ([27]). Moisture content values were determined based on an oven-dry weight basis. The relationship between litter (LMC) and duff (DMC) moisture content and temperature and relative humidity are displayed in Fig. S1 (Supplementary material).
Some descriptive statistics of weather and fuel moisture are provided in Tab. 3.
Measurements of fuel moisture increase due to rain
To determine moisture content increase after a rain event, a wetting experiment was further conducted immediately before, during and after a rain event. To determine fuel moisture increase after wetting, fuel containers measuring 15 × 20 cm in size were prepared for litter and duff using nets of 1 × 1 mm mesh size. Containers were placed in plots measuring 1 × 1 m with three replicates for litter and duff. To wet the samples, tap water was used in quantities of 0.2, 0.5, 1.0, 2.0, 5.0, 7.0 and 10.0 liters (rain equivalent of 0.2 mm to 10 mm). Uniform artificial raindrops were produced over the 1 × 1 m study plot by a water sprinkler ([31]). Litter and duff samples were weighed immediately before and after wetting. After measurements, litter and duff samples were taken to the laboratory and oven-dried, and moisture content values determined on an oven-dry weight basis. A total of 94 fuel moisture content values were determined for litter and duff. These records were used to determine the maximum potential moisture increase in fuels.
Furthermore, litter and duff samples were taken from the study plots in Trabzon before, during and immediately after a rain event. As a result, a total of 13 rain events over 8 different days were documented throughout the study period.
Model parameterization
Parameter values for fuel moisture increase due to rain, condensation, timelag constant, wind effect on timelag were obtained by fitting the model by non-linear least squares regression ([38]) and calibrated using the test data sets from Mugla (M1) and Trabzon (Tab. 4). Results were evaluated statistically, and the model results (graphs) were compared with the calibration data visually. The parameter values yielding the best approximation of the observed values were accepted as the model parameters. The parameter values used in the simulations are given in Tab. 4.
Tab. 4 - Parameter values used in the model.
| Variable | Model Parameter |
Value | |
|---|---|---|---|
| Litter | Duff | ||
| Fuel moisture increase due to rain (FMIr), % | a 1 | 25 | 30 |
| a 2 | 2.8 | 3.5 | |
| Rain required for saturation (RRFS), mm | b 1 | 50 | 40 |
| b 2 | 1 | 1 | |
| Condensation effect (CE), mm | c 1 | 0.07 | 0.25 |
| c 2 | 15 | 20 | |
| c 3 | 1.4 | 2 | |
| Timelag (TLC), hour | d 1 | 50 | 75 |
| d 2 | 50 | 75 | |
| d 3 | 3 | 4 | |
| d 4 | 3 | 3 | |
| Wind effect on TLC (kw), km h-1 | e 1 | 0.3 | 0.1 |
| e 2 | 10 | 10 | |
After calibration, the model was further tested against the independent data sets from Mugla (M2) and Antalya study sites for validation.
Model validation and performance
To assess the accuracy of model predictions ([12]), an independent data set from Mugla (M2) and Antalya study areas was used. Model parameters were not adjusted for the validation runs. Model validation was assessed using both graphical and statistical methods ([8], [12]). Three statistical criteria obtained from the residuals were examined to test the accuracy and precision of the predicted moisture content: mean absolute error (MAE), mean absolute percentage error (MAPE) and adjusted coefficient of determination (R2adj) of the regression of predicted vs. observed values ([11]).
All statistical analyses were conducted using the software package SPSS® ver. 22.0 ([38]).
Results
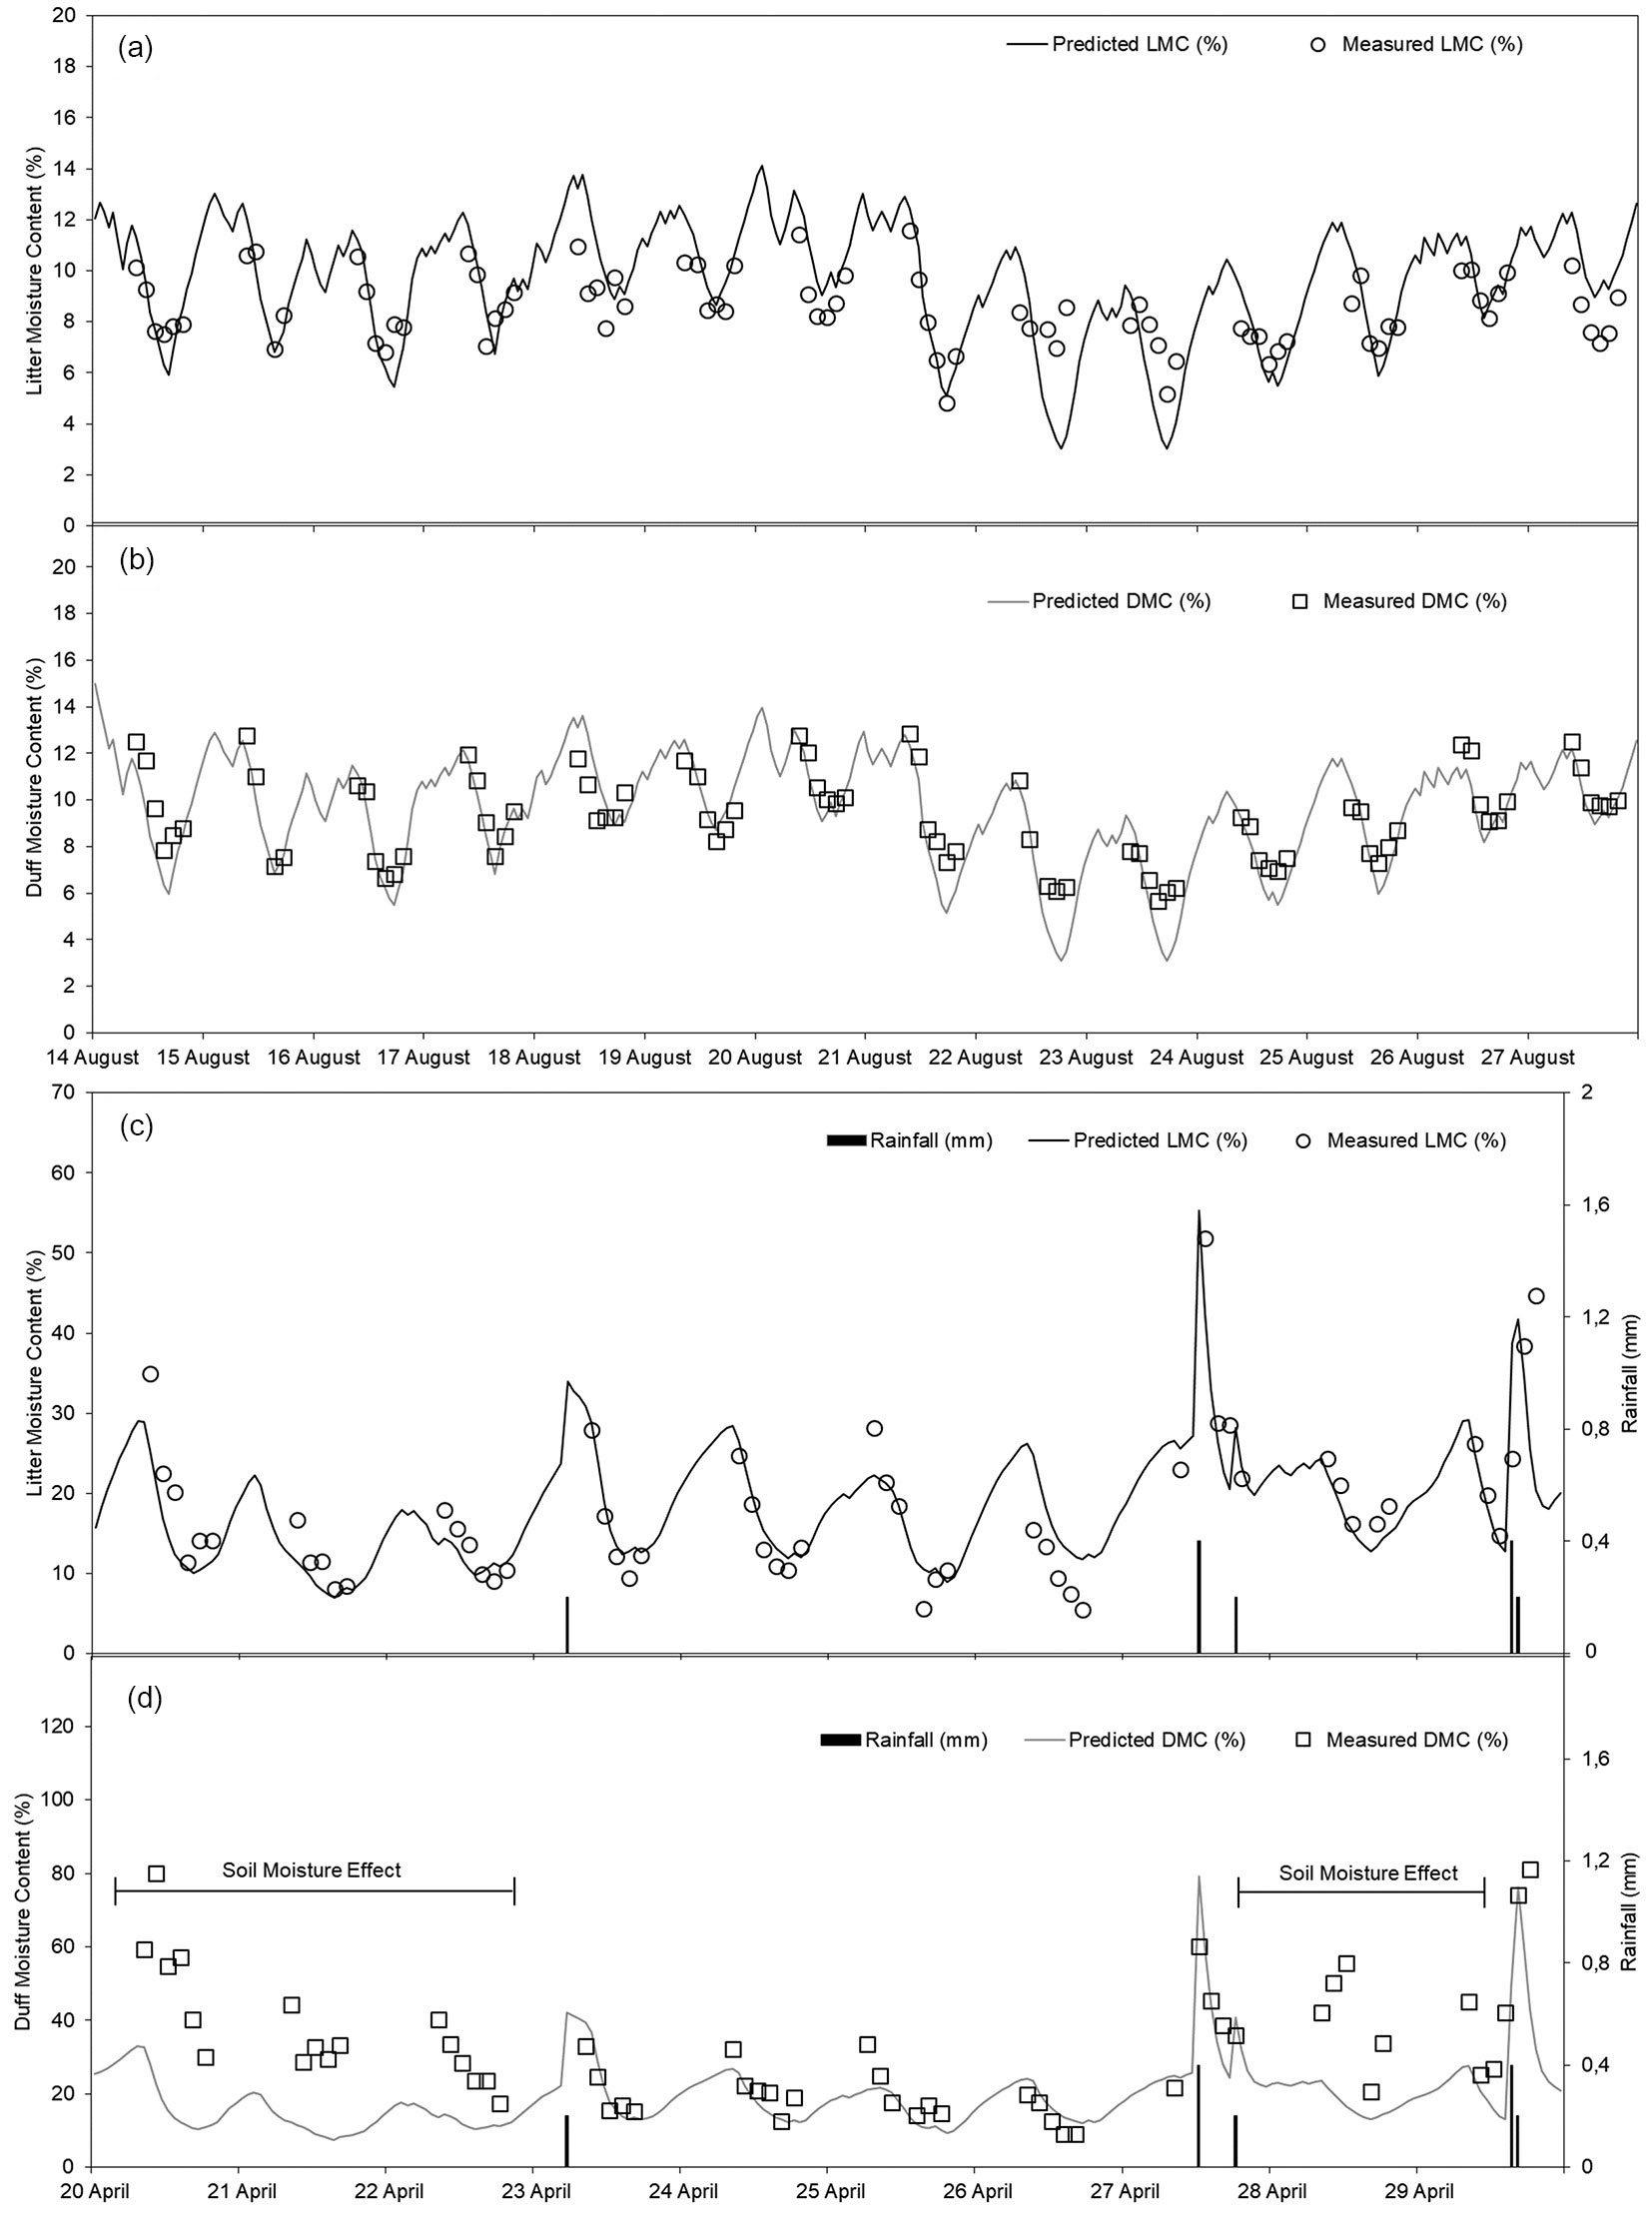
Data used for calibration and validation of the model covered a significant range of weather conditions (Tab. 3). Temperature, relative humidity, wind speed and rainfall ranged from 2.4 to 38.2 °C, 8 to 96%, 0.0 to 22.7 km h-1 and 0.0 to 2.8 mm, respectively. The time series of the observed fuel moisture contents plotted together with the predicted values from the model are shown in Fig. 4 for Mugla (Fig. 4a, Fig. 4b) and Antalya (Fig. 4c, Fig. 4d) sites.
Fig. 4 - Time series of hourly predicted and observed litter (a, c) and duff (b, d) moisture contents for the period of August 14-27, 2014 in Mugla (a, b) and April 20-29, 2014 in Antalya (c, d), respectively.
The relationships between measured and predicted litter and duff moisture contents for Mugla and Antalya sites are given in Fig. 5.
Fig. 5 - The relationships between measured and predicted litter (a, c) and duff (b, d) moisture contens for Mugla and Antalya.
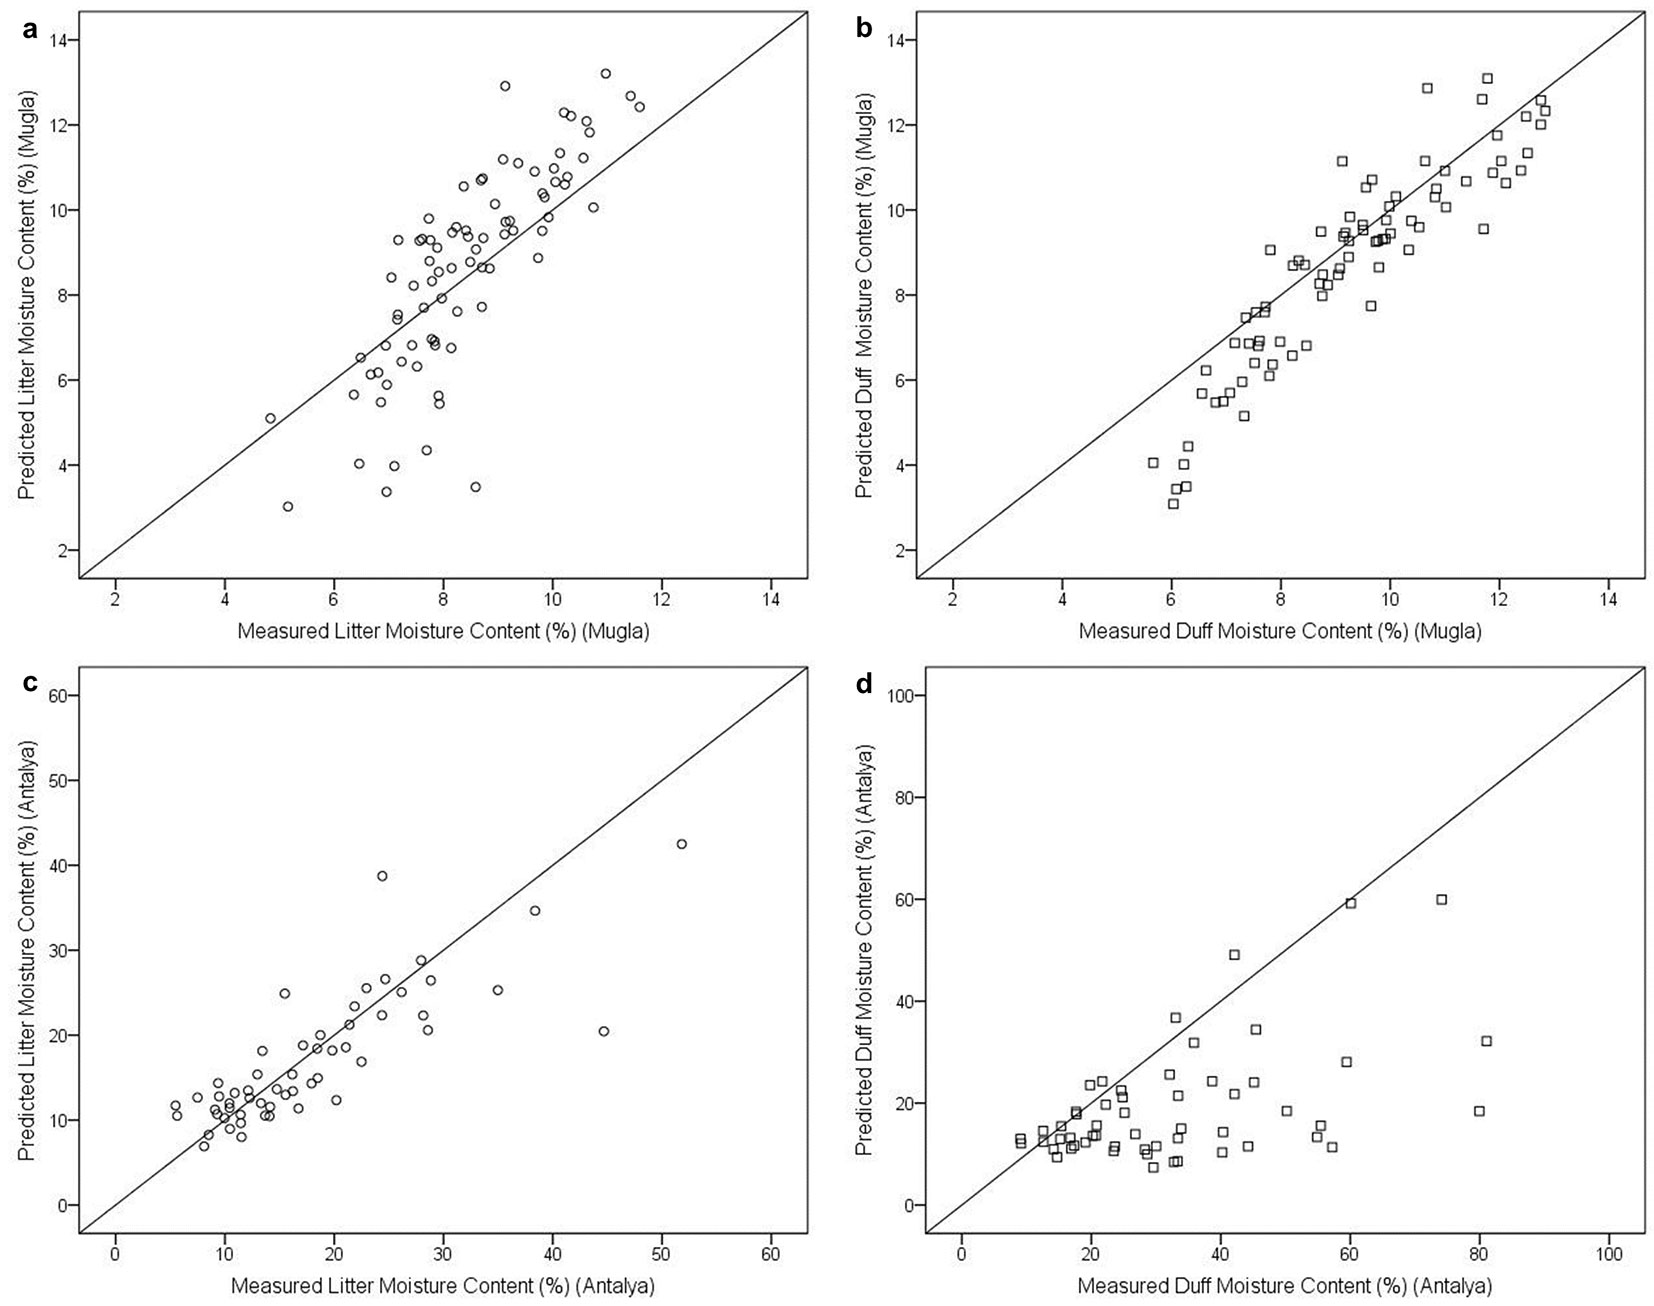
The visual and statistical evaluation of the results indicated that the accuracy of model predictions for both litter and duff moisture was satisfactory for Mugla and Antalya sites. However, we observed some discrepancies between the observed and predicted values of duff at the Antalya site, where the model systematically underestimated duff moisture contents during the period April 20-23 and April 28-29 (Fig. 4d, Fig. 5d). A revisit of the data indicated that while there was no precipitation recorded by the weather station during these periods, ground fuels and soil were somewhat saturated by occasional rain on the days preceding and continuous drizzle accompanied by high relative humidity on parts of these days.
The validation statistics of the comparison between predicted and observed fuel moisture content values for the two sites are given in Tab. 5. Observed fuel moisture contents in the validation data sets ranged from 4.83 to 11.59% for litter and 5.66 to 12.84% for duff at Mugla site, and from 5.48 to 51.81% for litter and 9.07 to 81.06% for duff at Antalya site. Model predictions yielded a MAE of 1.19 for litter and 0.90% for duff at Mugla and 3.62% for litter and 14.38% for duff at Antalya. When the periods of April 20-23, 2014 and April 28-29, 2014 were excluded from the validation data at Antalya site, the MAE decreased from 14.38 to 4.29 and R2 increased from 0.25 to 0.83 for duff fuels with the corresponding standard errors (SE) from 15.06 to 4.93 (Tab. 5). The validation statistics (MAE, MAPE and R2) of model predictions on validation data from Mugla (M2) and Antalya (Tab. 5) also supported the conclusion reached by the visual evaluation.
Tab. 5 - Statistics of the comparison between observed litter (LMC) and duff (DMC) moisture content values with validation data. (MAE): mean absolute error; (MAPE): mean absolute percentage error; (R2adj): adjusted coefficient of determination; (SE): standard error. (*): DMC values were excluded from the validation data set at Antalya during the periods April, 20-23 and April, 28-29 when soil moisture was high.
| Area | Number of measures | MAE | MAPE | R2adj | SE | |||||
|---|---|---|---|---|---|---|---|---|---|---|
| LMC | DMC | LMC | DMC | LMC | DMC | LMC | DMC | LMC | DMC | |
| Mugla (M2) | 81 | 81 | 1.19 | 0.90 | 14.68 | 10.83 | 0.66 | 0.84 | 0.80 | 0.76 |
| Antalya | 55 | 55 | 3.62 | 14.38 | 22.19 | 38.73 | 0.67 | 0.25 | 5.41 | 15.06 |
| Antalya* | - | 27 | - | 4.29 | - | 19.55 | - | 0.83 | - | 4.93 |
As for the rainfall effect, despite there were only three rainfall occurrences with limited amount of precipitation, the response and performance of the model in case of a rain event was also satisfactory (Fig. 4c, Fig. 4d).
Discussion
The proposed model produced reasonable fits to the validation data. As expected, the accuracy of model predictions was higher during dry periods when moisture content is low, though litter moisture dynamics were predicted reasonably well under all weather conditions (Fig. 4a, Fig. 4c). However, there was a systematic underestimation of duff moisture contents at Antalya site during the period of April 20-23 and April 28-29, 2014 (Fig. 4d, Fig. 5d). These periods coincided with days immediately after rain events.
The accuracy of model predictions in Mugla was similar to other studies ([28], [11]). However, the accuracy of model predictions in Antalya was comparatively lower. This can be attributed to:
(i) the range of the moisture content predictions: the range of LMC was 5.48-51.81% and that of DMC 9.07-81.06% for the Antalya site, covering rainy and dry periods (Fig. 4c, Fig. 4d). The results of the study are consistent with many previous studies attributing reduced performance of models at higher moisture contents to greater variability in moisture contents of wet fuels ([7], [20], [26]).
(ii) Slight differences in stand structure and surface fuel characteristics (Tab. 2): it is known that stand structure and fuel bed properties might produce significant variations in the moisture content of fuels ([4]). Although the study sites in Mugla and Antalya were similar, stand density and canopy closure were relatively lower, and surface fuels were more heterogeneous at Antalya site. While the purpose of the model is to simulate fuel moisture content within fully grown and normally stocked tree stands, the effect of variable stand structure on the actual amount of water reaching the surface fuels under canopy becomes more pronounced, especially after rain events. In this study, the relationships concerning fuel moisture increases due to rain has been established using a limited precipitation dataset measured outside the stand. Therefore, further studies should involve two simultaneous measurements of fuel moisture contents (one under the canopy and one in the open) to establish a relationship between the precipitation measured outside the stand and the actual moisture content increase under tree canopies. The relationship thus developed may be substituted to the a2 coefficient of eqn. 2.
(iii) Potential soil moisture effect not accounted for: the effect of soil moisture on the moisture content of surface fuels has been clearly demonstrated ([29], [21]). The initial underestimation of duff moisture contents on April, 20-23 and later on April, 28-29 at Antalya site can thus be ascribed to the presence of relatively high soil moisture (Fig. 4d, Fig. 5d) resulted from rain events preceding these periods, and affecting the dynamics of water exchanges through the fuel layers ([27], [32]). This may also partly explain the comparatively lower model performance for the litter fuels during these periods (Fig. 4c). The model presented here was not constructed to include the effect of soil moisture on the moisture dynamics of surface fuels. During the dry periods, the mineral soil had minimal influence on the drying processes of the duff ([15], [13]) and litter. Although not substantiated, the effect of lengthy drizzles and fog may also contribute to and have a pronounced effect on the dynamics of water exchanges through the fuel layers. However, the model presented here does not account for either drizzle or fog. Given the limitations of the present study, it is highly suggested that future models consider the contribution of soil moisture to surface fuel moisture dynamics especially during damp periods, lengthy drizzles and fog. In this regard, existing models taking soil moisture into account ([49]) may be consulted.
Conclusions
In this study, an attempt was made to predict diurnal surface fuel moisture dynamics in Calabrian pine stands in Turkey by developing a deterministic dynamic model assembled from empirical relationships over a wide range of weather situations. Model inputs were hourly air temperature, relative humidity, wind speed and the amount of rain readily measured in the field. The performance of the model under varying weather conditions and different stand characteristics was reasonably accurate for dry periods or periods with occasional rain events. Lower performances of the model at the Antalya site was probably caused by the presence of high soil moisture affecting surface fuel during the first three days of observation.
The proposed model has been developed for fire danger rating predictions in fully grown (tree height: 15-20 m), normally stocked (basal area: 30-50 m2 ha-1; crown closure: 80-100%) pine stands. Its application to other Mediterranean stand types should be performed with caution, and only when specific model parameters (e.g., timelag, condensation and wind effect) are available.
More experimental research on the effects of soil moisture on surface fuel moisture content dynamics are needed for future model development. Moreover, future efforts should further improve model accuracy by testing the model over a wider range of stand characteristics and conditions.
Acknowledgements
We would like to extend our appreciation and thanks to Mugla and Antalya Regional Forest Directorate and its staff. This study was supported by The Scientific and Technological Research Council of Turkey, project no. TOVAG-112O809. We are grateful to two anonymous reviewers for their useful suggestions and comments that greatly improved the manuscript.
References
Gscholar
Gscholar
Gscholar
Gscholar
Gscholar
Gscholar
Gscholar
CrossRef | Gscholar
Gscholar
Gscholar
Gscholar
Gscholar
Gscholar
Gscholar
Gscholar
Gscholar
Gscholar
Gscholar
Gscholar
Authors’ Info
Authors’ Affiliation
Kadir Alperen Coskuner 0000-0001-5249-1604
Yetkin Usta 0000-0002-0504-6417
Karadeniz Technical University, Faculty of Forestry, 61080 Trabzon (Turkey)
Artvin Coruh University, Faculty of Forestry, 08000 Artvin (Turkey)
Karadeniz Technical University, Faculty of Science, 61080 Trabzon (Turkey)
Istanbul University, Faculty of Forestry, 34100 Istanbul (Turkey)
Corresponding author
Paper Info
Citation
Bilgili E, Coskuner KA, Usta Y, Saglam B, Kucuk O, Berber T, Goltas M (2019). Diurnal surface fuel moisture prediction model for Calabrian pine stands in Turkey. iForest 12: 262-271. - doi: 10.3832/ifor2870-012
Academic Editor
Davide Ascoli
Paper history
Received: May 29, 2018
Accepted: Feb 27, 2019
First online: May 03, 2019
Publication Date: Jun 30, 2019
Publication Time: 2.17 months
Copyright Information
© SISEF - The Italian Society of Silviculture and Forest Ecology 2019
Open Access
This article is distributed under the terms of the Creative Commons Attribution-Non Commercial 4.0 International (https://creativecommons.org/licenses/by-nc/4.0/), which permits unrestricted use, distribution, and reproduction in any medium, provided you give appropriate credit to the original author(s) and the source, provide a link to the Creative Commons license, and indicate if changes were made.

Web Metrics
Breakdown by View Type
Article Usage
Total Article Views: 46431
(from publication date up to now)
Breakdown by View Type
HTML Page Views: 38155
Abstract Page Views: 4130
PDF Downloads: 3228
Citation/Reference Downloads: 5
XML Downloads: 913
Web Metrics
Days since publication: 2602
Overall contacts: 46431
Avg. contacts per week: 124.91
Article Citations
Article citations are based on data periodically collected from the Clarivate Web of Science web site
(last update: Mar 2025)
Total number of cites (since 2019): 18
Average cites per year: 2.57
Publication Metrics
by Dimensions ©
Articles citing this article
List of the papers citing this article based on CrossRef Cited-by.
Related Contents
iForest Similar Articles
Research Articles
Relevance of terpenoids on flammability of Mediterranean species: an experimental approach at a low radiant heat flux
vol. 10, pp. 766-775 (online: 02 September 2017)
Research Articles
Fuel moisture sampling and modeling in Pinus elliottii Engelm. plantations based on weather conditions in Paraná - Brazil
vol. 2, pp. 99-103 (online: 10 June 2009)
Research Articles
Pilot-scale drying of southern pine (Pinus spp.) lumber in a heated tube dryer
vol. 18, pp. 10-15 (online: 02 February 2025)
Research Articles
Fuel characterization and crown fuel load prediction in non-treated Calabrian pine (Pinus brutia Ten.) plantation areas
vol. 15, pp. 458-464 (online: 03 November 2022)
Research Articles
Development and evaluation of generalized fuel models for predicting fire behaviour in northern European heathlands
vol. 17, pp. 109-119 (online: 30 April 2024)
Short Communications
Upscaling the estimation of surface-fire rate of spread in maritime pine (Pinus pinaster Ait.) forest
vol. 7, pp. 123-125 (online: 13 January 2014)
Research Articles
Effect of microwave drying on drying kinetics, physico-mechanical properties, and microstructure of plantation-grown Hevea brasiliensis wood
vol. 19, pp. 77-84 (online: 08 March 2026)
Research Articles
Historical fire ecology and its effect on vegetation dynamics of the Lagunas de Montebello National Park, Chiapas, México
vol. 14, pp. 548-559 (online: 01 December 2021)
Research Articles
Harmonized dataset of surface fuels under Alpine, temperate and Mediterranean conditions in Italy. A synthesis supporting fire management
vol. 13, pp. 513-522 (online: 13 November 2020)
Research Articles
Fuel consumption comparison of two forwarders in lowland forests of pedunculate oak
vol. 12, pp. 125-131 (online: 11 February 2019)
iForest Database Search
Search By Author
Search By Keyword
Google Scholar Search
Citing Articles
Search By Author
Search By Keywords
PubMed Search
Search By Author
Search By Keyword


