Site quality assessment of degraded Quercus frainetto stands in central Greece
iForest - Biogeosciences and Forestry, Volume 8, Issue 1, Pages 53-58 (2015)
doi: https://doi.org/10.3832/ifor1069-007
Published: May 12, 2014 - Copyright © 2015 SISEF
Research Articles
Abstract
The potential yield of a site is measured by site index, which is defined as the dominant height of a stand at a base age. A site index model for site quality assessment of Quercus frainetto (Hungarian oak) stands in central Greece was developed using a base age of 50 years. Data were collected from 39 temporary sample plots of 10 x 10 m. Linear regression models widely used in site index studies were fitted to height-age data. The adjusted coefficient of determination (R2adj), root mean square error (RMSE), bias, coefficient of determination for the prediction (R2pr) and residual plots were used for the choice of the best-fitting model. The best model was H = -0.231+0.251A-0.001A2, where H is the predicted height at age A. The guide curve method was adopted in constructing the sites curves, with the chosen model as the guide curve. Based on this curve, the study area was divided into three site quality classes (I to III), with class I representing the best and class III the poorest. Also, the presence of a Simpson’s paradox in these analyses is discussed. The results showed that a 50-year-old stand in the study area attained an average dominant height of about 11, 8 and 6 m on site quality classes I, II and III, respectively. The Hungarian oak stands of the present study can be considered very low productivity stands.
Keywords
Guide Curve Method, Hungarian Oak, Simpson’s Paradox, Site Quality
Introduction
Site quality assessment is the evaluation of the natural productive capacity of a forest site for a tree species. Site quality assessment is very important in forest management, because a site could support one species excellently while supporting poorly other species. The oldest and most widely used technique for evaluating site quality or productivity is the site index.
Site index is the average total height of dominant and co-dominant trees at a specified reference or base age ([7]). It is scarcely affected by various densities and species composition, relatively stable under various thinning intensities and is strongly correlated with volume. The principal uses of site index are: (1) to estimate the height at any given age from site index; (2) to estimate site index from height at any given age; (3) to stratify forest land into productive classes; and (4) to provide entry to yield tables ([31]). However, the most common objective of site index investigations is to determine the height development pattern that the stand is expected to follow throughout its life-cycle ([7]).
Site index models are essential quantitative tools in forest management ([25]). Most of the techniques used to fit site index curves could be considered as special cases of three general development models, namely: (i) the guide curve; (ii) the difference model; and (iii) the parameter prediction method ([7]). Among the various techniques for developing site index curves, the guide curve method has become popular in those cases where repeated measures through time on the same permanent plots are unavailable ([7], [17]).
Oak forests covers 22.6% of the total forested area in Greece ([15]). According to Christensen ([6]), Hungarian oak (Quercus frainetto Ten. syn. Q. conferta Kit.) is an important timber species in most mainland Greece, but not in the drier low elevation area in the southern part of the country. Moreover, Bergmeier & Dimopoulos ([4]) refer that in mainland Greece Q. frainetto is the species that most frequently dominates in comparison with the other deciduous oaks.
The aim of this work was to obtain site index curves for site quality assessment of degraded Hungarian oak stands in central Greece to be used in the management of current and future Hungarian oak stands.
Materials and Methods
Study area
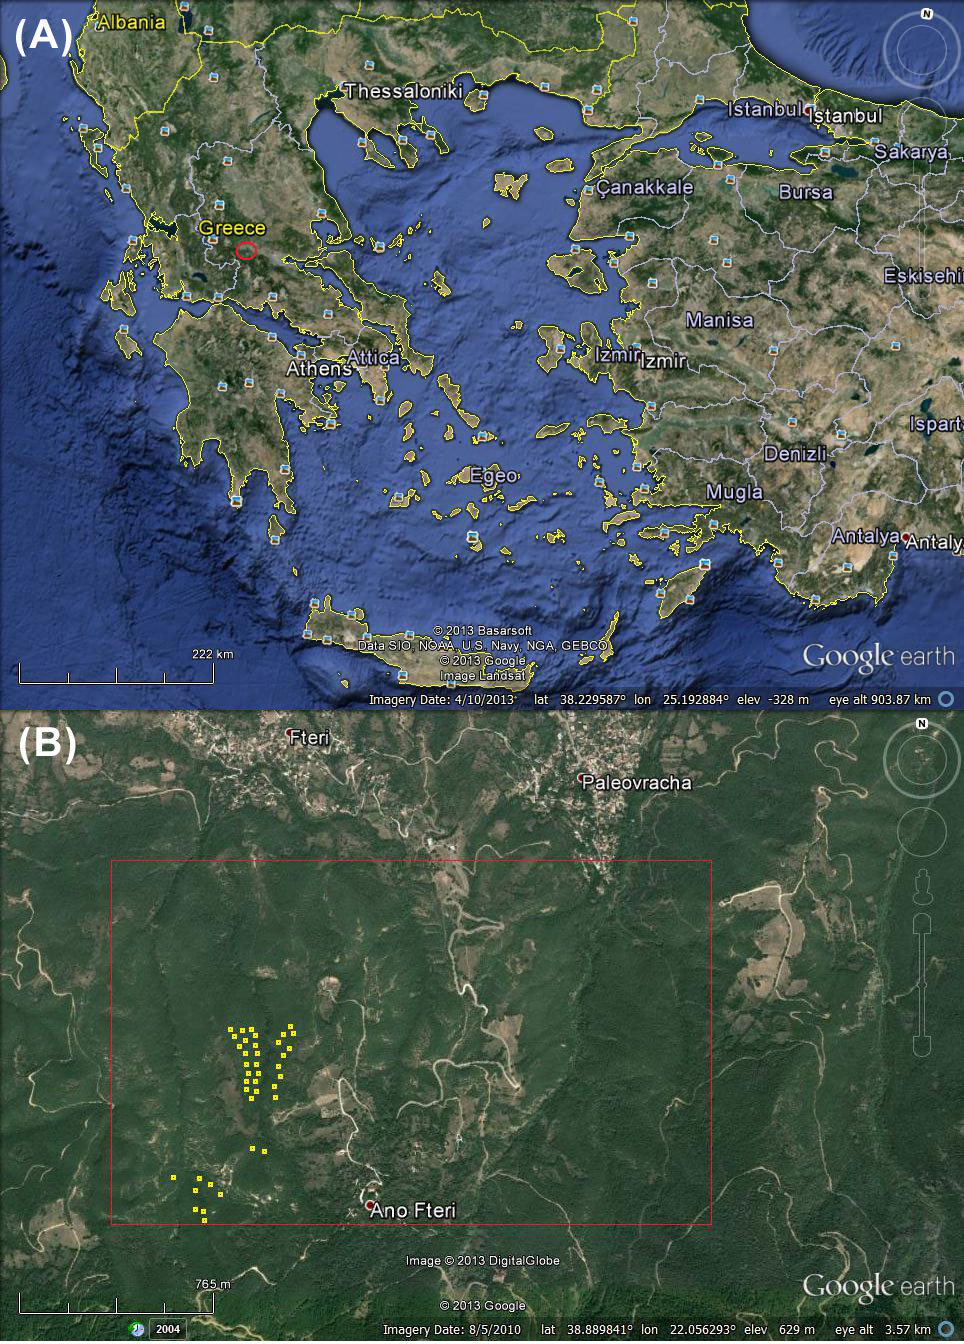
The study was conducted in degraded Hungarian oak stands located in an area of approximately 290 ha (of which 260 are forested) in central Greece (38° 53’ N, 22° 03’ E - Fig. 1). Data were collected at an elevation ranging from 650 to 750 m a.s.l. The substratum is flysch and the soil texture is loamy sand, clay-loam to loam ([32]). According to the closest meteorological station (390 m a.s.l.), the mean annual rainfall is 873 mm and the mean annual air temperature is 15.16 °C ([32]).
Fig. 1 - (A) Location of the study area (red circle). (B) Wider study area (red rectangle) and approximate location of the experimental plots (yellow squares).
In the past, tree branches in some locations of the area were being cut by residents of nearby villages for livestock feeding, while other places were under agricultural cultivation. Nowadays, the main disturbance is grazing; degree of grazing is low to absent, and only in a small part of the area is severe. Silvicultural treatments have not been applied in the area, mainly because of the lack of adequate forest roads in most of the study area.
Experimental design
Thirty-nine plots 10 x 10 m were established randomly in the forested part of the study area, where the degree of grazing is low to absent, and the main canopy trees were considered approximately even-aged (Fig. 1a, Fig. 1b). In each plot, the height of all trees was measured. The tallest dominant tree was cut in each plot. As a result, the 39 sample trees were among the 100 tallest trees per hectare (100 x plot area = 1 ha), so they can be used for the site index estimation ([3]). Many of the sample trees are possibly sprout origin. Cross sectional discs were cut from each felled tree at the ground level (≈0 m), at the breast height (1.3 m) and at 1 m intervals. The last disc was collected from the 4-cm bole diameter. Annual growth rings were measured along the mean radius on each cross-sectional disc using the LINTAB® system (RinnTech, Heidelgerg, Germany) and the sofware package TSAP-Win® ([20]). As for stem analysis, tree height at each age was calculated using a modified version of Carmeans’ algorithm ([5], [18]).
Development of growth equations
Little information is available in the scientific literature on site index for degraded Hungarian oak stands in central Greece; thus the first step was the choice of the appropriate base age. As recommended by several authors ([9], [27], [25]), the appropriate base age for site index determination was set to 50 years based on the culmination age of mean annual increment. Among the various techniques for developing site index equations, the guide curve method was adopted in this study since data was obtained from temporary sample plots ([7], [17]). Three linear equations commonly used in site index studies were selected from the forestry literature ([5], [7], [25]) and used for data fitting (eqn. 1 , eqn. 2, eqn. 3):
where H is the tree height at the age A, b0, b1, b2 are the regression coefficients to be estimated, and e is the error. The above equations were then compared and the best fitting model was chosen. Numerous criteria for selecting the best model are available; however, since the dependent variable in the above equations was the same, the highest adjusted coefficient of determination (R2adj) and the lowest absolute and relative root mean square error (RMSE) were considered appropriate criteria for the selection of the best model. Examination of the residuals was also carried out for assessing the best models by calculating absolute and relative biases ([28], [24], [11]). Selection criteria were (eqn. 4, eqn. 5, eqn. 6, eqn. 7, eqn. 8):
where Hi is the observed height value for the i-th observation, Hi is the estimated height value, H is the mean of the observed values, n is the number of observations, and p is the number of regression coefficients to be estimated.
The predictive performances of the studied models were also evaluated using prediction errors or PRESS (PREdiction Sum of Squares) residuals. These residuals were calculated by omitting each observation in turn from the dataset, fitting the model to the remaining observations, predicting the response without the omitted observation and comparing the prediction with the observed value (eqn. 9):
where Hi is the observed height value and Hi,-i is the prediction value obtained by omitting the i-th observation (i = 1, 2, ..., n). Each candidate equation has n PRESS residuals associated with it and the PRESS statistics is defined as ([16] - eqn. 10):
The accuracy of the predictions obtained with the different candidate equations was assessed by computing the coefficient of determination for the prediction (eqn. 11):
The interpretation of this coefficient of determination is similar to that described for other similar coefficient, i.e., a value close to 1 indicates high predictive performances for the model considered.
Stands were stratified into three site quality classes, with site quality decreasing from class I to III. Using the predicted height growth trend described by the chosen model (guide curve), anamorphic site index curves were fitted to pass through three different site index classes of I to III. This was accomplished by holding the shape parameters constant and varying the asymptote parameter as necessary to achieve the required dominant height when stand age (A) equals the base age (A0 = 50 years). This approach has been successfully used in previous studies ([7], [25]).
Results and Discussion
A summary of the height characteristics of the 39 sample trees used for site index modeling are reported in Tab. 1. Mean total height ranged from 7.2 m at 38 years to 10.86 m at 59 years.
Tab. 1 - Summary statistics of the sample trees (dominant trees) used in site index modeling. (SE): standard error of the mean.
| Trees | Total height (m) | ||||
|---|---|---|---|---|---|
| Age (years) | Count | Min | Max | Mean | SE |
| 35 | 1 | 9.5 | 9.5 | 9.5 | - |
| 38 | 1 | 7.2 | 7.2 | 7.2 | - |
| 43 | 1 | 7.5 | 7.5 | 7.5 | - |
| 47 | 1 | 8.7 | 8.7 | 8.7 | - |
| 50 | 3 | 9.2 | 10 | 9.5 | 0.252 |
| 51 | 1 | 7.2 | 7.2 | 7.2 | - |
| 52 | 1 | 7.7 | 7.7 | 7.7 | - |
| 54 | 7 | 7.2 | 11.5 | 9.31 | 0.489 |
| 55 | 1 | 9 | 9 | 9 | - |
| 57 | 7 | 6.8 | 10.5 | 8.8 | 0.492 |
| 58 | 3 | 6.5 | 10.5 | 7.97 | 1.272 |
| 59 | 5 | 7 | 12.5 | 10.86 | 1.002 |
| 60 | 1 | 10 | 10 | 10 | - |
| 63 | 1 | 9.2 | 9.2 | 9.2 | - |
| 64 | 2 | 10.2 | 10.5 | 10.35 | 0.15 |
| 66 | 3 | 9.6 | 11.5 | 10.33 | 0.59 |
The parameters and statistics of the regression models considered (eqn. 1 to 3) are presented in Tab. 2. The initial observation was that all the models had high R2adj and low RMSE and bias. All parameters included in the models were statistically significant, indicating that none of the models was over-parametrized. As expected, residuals did not display any significant departure from the normal distribution (Fig. 2). A comparison of the three linear models revealed similar fitting performances, though the model of eqn. 1 showed the lowest RMSE and bias (Tab. 2) and therefore it was selected for the construction of the site index curves for Hungarian oak stands in the study area. The predicting curve from eqn. 1 was within the observed variation of the dominant height-age data (Fig. 3). The site index curves for the study area showed that a 50-years-old Hungarian oak stand attained an average dominant height of about 11, 8 and 6 m on site classes I, II and III, respectively (Fig. 4).
Tab. 2 - Estimated parameters and statistics for the three models fitted to temporary plot data for Hungarian oak stands.
| Model | Coeff. | Parameter estimates | R 2 adj | RMSE | RMSE % |
bias | bias % |
R 2 pr |
|---|---|---|---|---|---|---|---|---|
| 1 | b 0 | -0.231 | 0.799 | 1.414 | 26.093 | -2.94E-13 | -5.43E-12 | 0.799 |
| b 1 | 0.251 | |||||||
| b 2 | -0.001 | |||||||
| 2 | b 0 | 0.919 | 0.788 | 1.451 | 26.784 | 1.77E-12 | 3.27E-11 | 0.788 |
| b 1 | 0.161 | |||||||
| b 2 | -1.404 | |||||||
| 3 | b 0 | -3.656 | 0.700 | 1.727 | 31.874 | 1.32E-12 | 2.43E-11 | 0.700 |
| b 1 | 2.949 |
Fig. 2 - Residual Q-Q plots for the three regression models considered in this study.
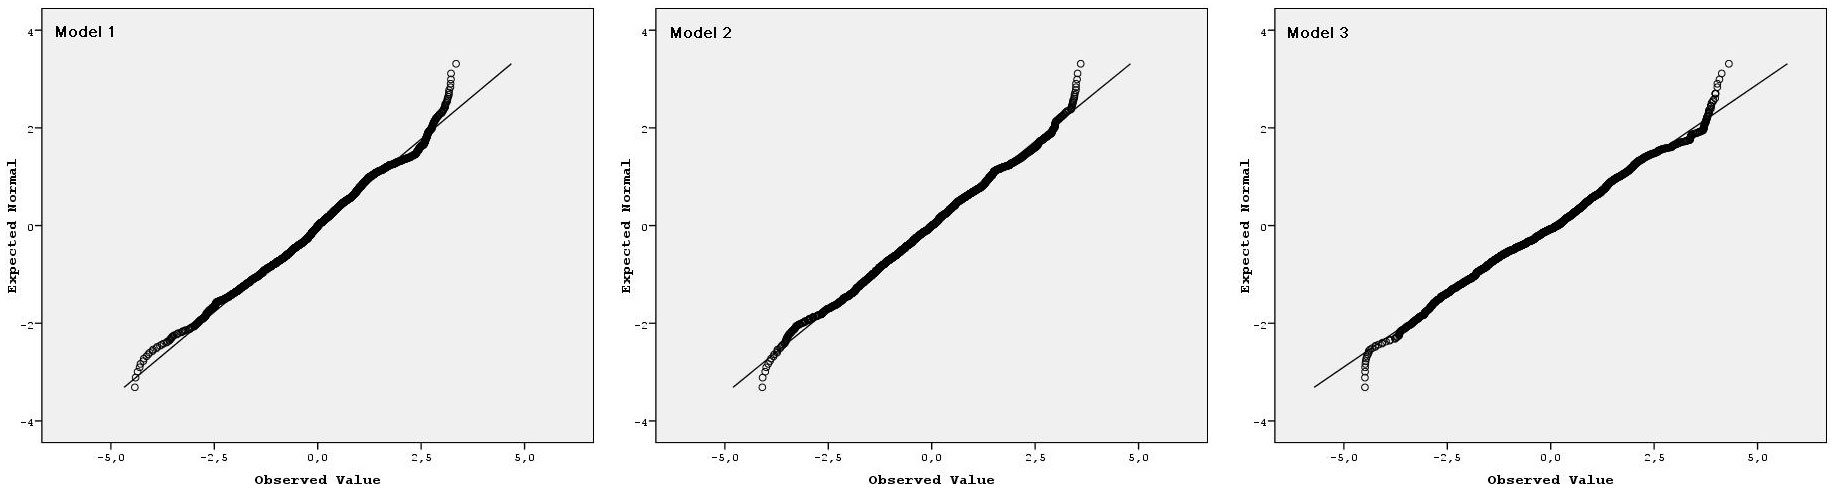
Fig. 3 - Comparison of the observed dominant height-age data and the predicted values obtained using the model from eqn. 1.
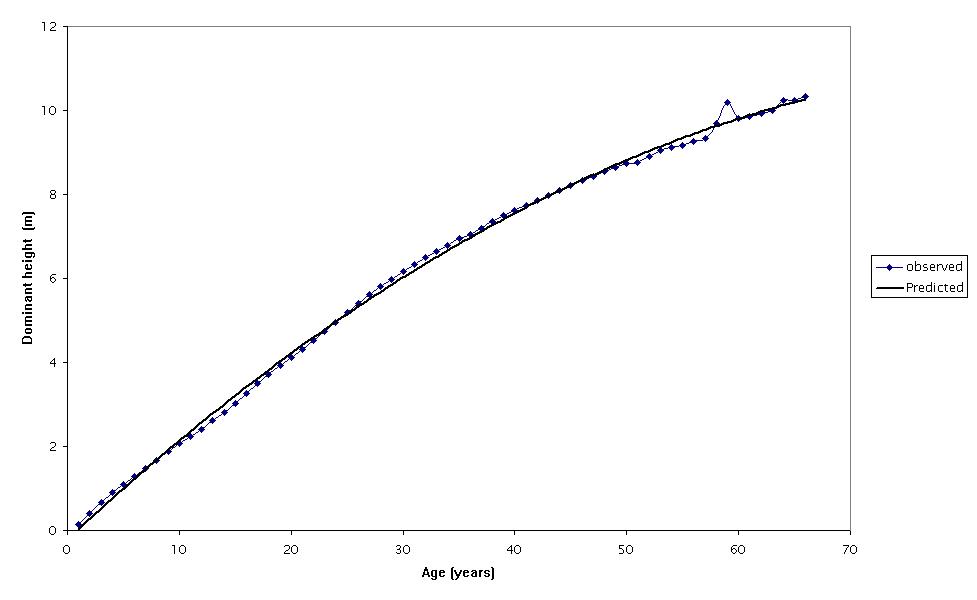
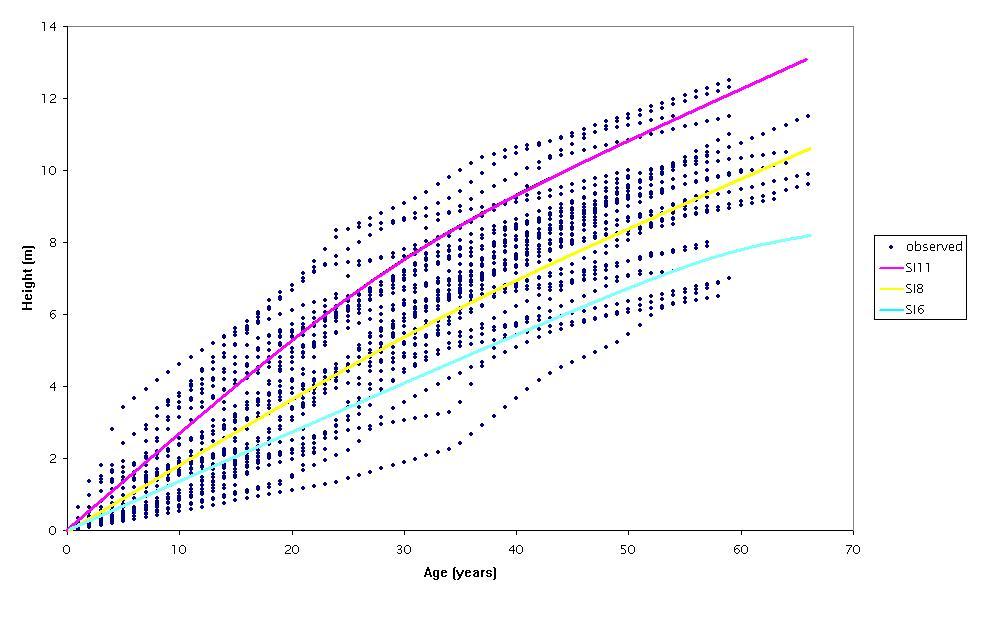
Fig. 4 - Site index curves for Hungarian oak stands constructed using the model of eqn. 1. (SI): Site Index. (SI6), (SI8), (SI11): average height of dominant trees at the age of 50 years on the sites III, II, and I, was 6, 8 and 11 m, respectively.
Simpson’s paradox (known also as the Yule-Simpson effect, the reversal paradox, or the amalgamation paradox) is an apparent paradox in which the results of separate groups seem reversed when the groups are combined ([8]). This paradox is primarily an issue of aggregated statistical analysis where separate groups are analyzed together. In other words, it occurs when a variable has an effect in the same direction within subsets of the data, but when the subsets are combined, the effect vanishes or reverses in direction. The variable used to separate these groups/subsets is called “confounder” ([29], [1]). Cohen ([8]) describes the uncertainty principle associated with Simpson’s paradox arising when two populations are stratified. The stratification process is undertaken to increase homogeneity among the strata. However, stratification may reverse the apparent rank ordering of the two population means.
In our study, the confounder is the site index, and the Simpson’s paradox concerns the total height estimated in contrast to the base age (50 years). Even though models’ parameters are correctly estimated, it seems that the estimated height at the age of 50 is lower than the true height measured at an age below 50, and higher than the true height measured at an age above 50.
Such apparent paradox may also be attributable to a King Kong effect ([13]). The King Kong effect was named from a theoretical study on the relationship of weight to height in a sample of gorillas in which one extreme value (i.e., King Kong) is added. The addition of such extreme value to the sample of gorillas skews the height and weight data and affects their correlation. As a result, a weight/height relationship greater than that existing before adding the extreme value is obtained ([13]). In our study, the site (arbitrarily defined from the general tree development) could be the King Kong value. Adding this variable a smoother height growth potential of the tree is obtained, i.e., a tree with an estimated height at base age which classifies it in a higher site quality, actually belongs to a lower site quality.
The absence of permanent plots necessitated the use of temporary plot data of different ages. This limitation permitted only the use of the guide curve method for the development of site index models. Therefore, it was assumed that the distribution of plots with respect to site quality was the same across all ages ([2]). The failure of this assumption would lead to the fitted guide curve being biased away from the true average height growth trend ([30]). It appears in Fig. 3 that the assumption was not violated, as the fitted guide curve did not appear to be biased away from the true average height growth trend of the species under investigation.
The guide curve method was used to generate anamorphic site index curves. These curves are a family of lines with constant slope but various intercepts, achieved by holding the shape parameters constant and varying the asymptote parameter to obtain the required dominant height value when stand age (A) equals the index age (A0). The base age of 50 years used for the development of site index curves in the present study seems appropriate, since base age corresponds to the period of completion of rapid growth, i.e., when mean annual increment is culminated ([27]).
Fig. 4 presents the site index curves developed for the species under investigation. Areas of good site quality are those characterized by a high height growth ([7]). The best site quality class was site class I, while the medium and the poorest site quality classes were II and III respectively. This implies that a stand with height development pattern similar to curve SI11 is growing on a better site than a stand with height development pattern similar to curve SI8. A stand with a mean dominant height of about 4 m at age 15 years is expected to follow the height development pattern exhibited by class I, while a stand with a mean dominant height of about 3 m at the age of 15 years is expected to follow the height development pattern exhibited by class II. However, there could be a shift in the site index, caused by climatic variation, measurement error, damage to dominant height by diseases and fire, as well as removal of dominant trees through thinning ([25]).
Even though there are more productive sites in adjacent areas, the Hungarian oak stands of the present study are not productive. Tree height growth, even in the best site quality, is very low. Matis ([14]), using dominant and codominant trees, presented site index curves for Hungarian oak derived from coppice stands in the University forest of Taxiarchis in Chalkidiki (northern Greece). Tree growth rates were significantly higher as compared with the results of the present study. In particular, he distinguished five site qualities, noting that the tree height is up to 11.72 m in the V site quality at the breast height age of 50 years, while in the best (I) site quality trees showed a height of at least 21.68 m. On the other hand, when he distinguished three site qualities, trees of the third (III) site quality at the same breast height age had a height up to 13.93 m, and trees of the best (I) site quality were at least 19.47 m tall. In Hungarian oak stands from approximately the same area, Smiris et al. ([23]), using stem analyses of 15 trees that had the dimensions of the mean bole, noted that the height of the “mean bole” tree was 19.17 m at the age of 49 years. Smiris et al. ([22]), in experimental plots in sprout origin Hungarian oak stands, where different intensity thinnings had been applied, notice that, at the age of 52 years, the mean height of trees was ranging between 14.18 (control plot) and 16.19 m (light thinning plot). In north-eastern Chalkidiki, Dafis ([10]) distinguished six site qualities for coppice Hungarian oak stands. Average height of trees of the main stand in the V site quality, at the age of 40 years, was the same as the height of trees, at the age of 50 years, in the best site quality of the present study.
Collecting data for a longer period of time from permanent sample plots may allow site index curves to be validated. Indeed, a good knowledge of growth and yield is necessary for sound forest management plans, especially silvicultural decision-making processes such as time of first and subsequent thinnings. The site index curves developed in this study may be useful in quantifying Hungarian oak growth and yield on various low productivity site conditions. Site index curves may also help as a guide in making thinning decisions for stands of species in analogous low productivity conditions. Among the various methods used to determine the time of first and subsequent thinnings, the dominant height approach is preferred because it reflects site effect more than other methods (e.g., age, basal area and volume methods - [25]).
As for Simpson’s paradox, it has been mentioned in several forestry researches ([26], [21], [12], [19]). This can happen due to a shift in the distribution of the stands from a previous survey to a more recent survey, and not from a fundamental decline in tree growth, in case of successive forest inventories. In such a case, we can assume that the shift is due to the cutting in saw timber stands that removed the large mature trees, resulting in a reclassification of the stands in the next inventory ([26]).
In our study, Simpson’s paradox can be a key to understanding the apparent inconsistency between height growth rate per tree and the performance of stand level statistics. Measurements of per tree growth rates over time, when used as a whole for site index curve fitting, may give misleading estimates. Actually, foresters must always recognize the effect that each felled tree may have on the forest level growth. Interpretation of our site index curves development, with the awareness of Simpson’s paradox, indicates that results from one region should not be extrapolated to another one too far apart on the basis of equations or graphs showing height growth rate by age class. Analysis of growth data for large areas can be risky, considering that the tree-stand interaction over time is quite composite.
Conclusions
From the analysis of degraded Quercus frainetto stands in central Greece, we obtained site index curves showing the height development pattern that the stands are expected to follow. These site index curves can be used to quantify the production potential of Hungarian oak in low productivity sites. However, before their application outside the study area, the model must be validated using data from permanent sample plots. Lastly, the comprehension of the Simpson’s paradox and a cautious analysis of data can increase our understanding of forest growth rates and stand processes.
Acknowledgements
We would like to thank the Bodossaki Foundation for the financial support of A. Stampoulidis. We also want to thank the Forest Service of Spercheiada (Greece) for their kind cooperation.
References
Gscholar
Gscholar
Gscholar
Gscholar
Gscholar
Gscholar
Gscholar
Gscholar
Gscholar
Gscholar
Gscholar
Gscholar
Gscholar
Gscholar
Gscholar
Gscholar
Gscholar
Gscholar
Authors’ Info
Authors’ Affiliation
Elias Milios
Elias Tsirekis
Athanasios Stampoulidis
Department of Forestry and Management of the Environment and Natural Resources, Democritus University of Thrace, Pandazidou 193, GR-68200 Orestiada (Greece)
Laboratory of Silviculture, Faculty of Forestry and Natural Environment, Aristotle University of Thessaloniki, GR-54124 Thessaloniki (Greece)
Corresponding author
Paper Info
Citation
Kitikidou K, Milios E, Tsirekis E, Pipinis E, Stampoulidis A (2015). Site quality assessment of degraded Quercus frainetto stands in central Greece. iForest 8: 53-58. - doi: 10.3832/ifor1069-007
Academic Editor
Raffaele Lafortezza
Paper history
Received: Jul 11, 2013
Accepted: Jan 26, 2014
First online: May 12, 2014
Publication Date: Feb 02, 2015
Publication Time: 3.53 months
Copyright Information
© SISEF - The Italian Society of Silviculture and Forest Ecology 2015
Open Access
This article is distributed under the terms of the Creative Commons Attribution-Non Commercial 4.0 International (https://creativecommons.org/licenses/by-nc/4.0/), which permits unrestricted use, distribution, and reproduction in any medium, provided you give appropriate credit to the original author(s) and the source, provide a link to the Creative Commons license, and indicate if changes were made.

Web Metrics
Breakdown by View Type
Article Usage
Total Article Views: 53531
(from publication date up to now)
Breakdown by View Type
HTML Page Views: 44171
Abstract Page Views: 3596
PDF Downloads: 4391
Citation/Reference Downloads: 28
XML Downloads: 1345
Web Metrics
Days since publication: 4387
Overall contacts: 53531
Avg. contacts per week: 85.42
Article Citations
Article citations are based on data periodically collected from the Clarivate Web of Science web site
(last update: Mar 2025)
Total number of cites (since 2015): 6
Average cites per year: 0.55
Publication Metrics
by Dimensions ©
Articles citing this article
List of the papers citing this article based on CrossRef Cited-by.
Related Contents
iForest Similar Articles
Research Articles
Standing tree assessment for the maintenance of historic wooden buildings: a case study of a World Heritage site in China
vol. 6, pp. 169-174 (online: 08 May 2013)
Research Articles
Relationship between environmental parameters and Pinus sylvestris L. site index in forest plantations in northern Spain acidic plateau
vol. 9, pp. 394-401 (online: 16 January 2016)
Research Articles
Testing Hungarian oak (Quercus frainetto Ten.) provenances in Romania
vol. 13, pp. 9-15 (online: 08 January 2020)
Research Articles
Simplified methods to inventory the current annual increment of forest standing volume
vol. 5, pp. 276-282 (online: 17 December 2012)
Research Articles
Assessment of age bias in site index equations
vol. 9, pp. 402-408 (online: 11 January 2016)
Research Articles
Seedling quality and short-term field performance of three Amazonian forest species as affected by site conditions
vol. 17, pp. 80-89 (online: 21 March 2024)
Research Articles
Environmental Kuznets curve for deforestation: evidence using GMM estimation for OECD and non-OECD regions
vol. 10, pp. 196-203 (online: 13 December 2016)
Review Papers
Integration of forest mapping and inventory to support forest management
vol. 3, pp. 59-64 (online: 17 May 2010)
Research Articles
Evaluation of methods to improve the direct estimation of standing trees volume
vol. 18, pp. 87-92 (online: 17 April 2025)
Research Articles
The effect of the calculation method, plot size, and stand density on the accuracy of top height estimation in Norway spruce stands
vol. 10, pp. 498-505 (online: 12 April 2017)
iForest Database Search
Search By Author
Search By Keyword
Google Scholar Search
Citing Articles
Search By Author
Search By Keywords
PubMed Search
Search By Author
Search By Keyword


