
Environmental Kuznets curve for deforestation: evidence using GMM estimation for OECD and non-OECD regions
iForest - Biogeosciences and Forestry, Volume 10, Issue 1, Pages 196-203 (2016)
doi: https://doi.org/10.3832/ifor2066-009
Published: Dec 13, 2016 - Copyright © 2016 SISEF
Research Articles
Abstract
The depletion of the world’s forests in both tropical and temperate regions threatens to cause considerable environmental problems and hamper future economic development. However, some research has suggested that this deforestation might slow or reverse, exhibiting an Environmental Kuznets Curve (EKC). Yet previous studies investigating such an EKC have found mixed results. We therefore test for a deforestation EKC using an improved dataset from the World Development Indicators and an enhanced econometric technique Arellano-Bover/Blundell-Bond Generalized Method of Moments (GMM) estimator. We compare OECD countries with the non-OECD regions of Latin America, Asia, and Africa to determine how various factors like economic growth, population, trade, urbanization, agricultural land conversion, and cereal yield impact deforestation rates. The results show that the OECD countries have an N-shaped curve whereas only the African region experiences an income-based EKC pattern. Population growth tends to create more deforestation as does conversion to agricultural lands. More trade openness and greater urbanization impact the regions differently, but only the OECD countries have less deforestation due to better cereal yields.
Keywords
Environmental Kuznets Curve, Deforestation, GMM, OECD, Non-OECD
Introduction
Forests are valuable resources, not just in terms of their economic products but also for aesthetic and other reasons. Nevertheless, wide expanses of forests still disappear at rapid rates across the planet. While environmentalists generally blame economic development for such forest loss, some researchers have defended economic growth by arguing that an Environmental Kuznets Curve (EKC) might exist for deforestation. A deforestation EKC suggests that increases in per capita income initially raise deforestation rates until a country attains a high enough income to undergo a slowing or even reversal of forest loss. However, previous forest EKC studies have produced diverse results, with some researchers finding an EKC for deforestation but others discounting the EKC in favor of different patterns ([7], [33]).
Many of these prior studies have used some version of fixed and/or random effects but then experienced significant autocorrelation problems ([42]). Our contribution to the literature is to incorporate the more advanced econometric technique of dynamic modeling using Generalized Method of Moments (GMM) estimators that accounts for autocorrelation and country-specific effects ([3], [12]). We update previous work by using enhanced panel datasets from the World Development Indicators (WDI) that have more complete data from 1990 to 2007 ([47]).
We assess the forest patterns for OECD countries and the non-OECD regions of Latin America, Asia, and Africa by investigating the interactions among the following variables: percentage of forest land, per capita GDP, population, trade, urbanization, percentage of agricultural land, and cereal yield in kg per hectare. We find a variety of interesting results. The rest of the paper proceeds with a selected overview of the EKC literature, the data and empirical model, the estimation results, and finally some conclusions.
Selected literature review
Forests are important for maintaining a healthy environment. Both tropical and temperate forests improve land quality, particularly by preventing soil erosion and flooding ([10], [41]). Without these forests, land can degrade to the point where chemical change and nutrient loss prevent further growth of important plants ([6], [24]). Forests also help regulate the carbon cycle in the atmosphere by absorbing the potentially hazardous greenhouse gas (GHG) carbon dioxide, thus storing considerable amounts of carbon ([30], [40]). However, the burning of forests releases much of that sequestered carbon into the atmosphere, to the point where deforestation from the tropics alone accounts for around 17% of GHG emissions worldwide ([9]). In addition, most forests provide significant value in terms of biodiversity in plant and animal species ([39]), which helps create a vibrant ecosystem but also can have pharmaceutical or other uses ([34]). The loss of this forest cover, then, can lead to environmental desolation even as it harms further economic development as forest resources diminish.
Some natural causes of forest loss do occur, such as with forest fires; however, multiple studies have shown that a substantial amount of deforestation comes from direct human activity to generate wealth or create a basic standard of living ([8], [30]). Essentially, deforestation happens when land cleared of forests has greater value than keeping the forests intact ([6], [40]). Importantly, deforestation in this sense does not mean the literal destruction of entire forests completely but rather the decrease in forest cover that results from the removal of trees from forests due to a variety of causes ([42]). While most countries in the world with forests allow some degree of deforestation, those countries lacking significant resources other than forests and agricultural land often place substantial pressure on their forests to provide for their economic growth ([8], [7]).
For many countries, large-scale deforestation happens as a result of agricultural expansion into frontier areas or full forests ([16], [20], [31]). The constant clearing of forest land partly occurs to create more livestock ranches, which generally produce more money than do crops ([13], [38]). Ranching, though, can foster a negative cycle of deforestation; forest land is cleared for livestock that then overgrazes the land and causes it to degrade, thus forcing further expansion of the ranches into more forest area ([1]).
In addition, subsistence farming in developing countries at the forest frontier can cause considerable deforestation in the tropics ([6]). Tropical forest land retains few nutrients, which consequently limits the productivity of farms ([10]); farmers often cannot produce substantial quantities of crops initially and also experience declining yields over time. Farming then becomes a matter of “shifting cultivation” ([16]); once farmers have used up the land’s nutrients, they must then remove more forest to continue farming ([40]). It actually costs less for poverty-stricken small farmers to create new farms in the forest than to invest in the land they already use.
The timber industry further contributes to forest cover loss, often through unsustainable logging and frequently with the consent or help of governments ([1], [14]). The selling of forest products can enhance economic growth even as timber companies provide a considerable amount of jobs, thereby encouraging governments to stop protecting forests to take advantage of trade, as seen in countries like Brazil, Cameroon, and particularly in Southeast Asia ([13], [41]). The timber industry can choose to either clear-cut entire forest tracks or engage in selective harvesting. Both methods, though, are forms of deforestation that can cause substantial damage to the land, with clear-cutting often leading to considerable erosion and mud slides ([10]); selective logging can impair the remaining forest, changing its ability to sustain its ecology ([5]).
As logging companies expand into forests, they also construct new roads to transport their forest products. Governments also build roads to encourage development of natural resources ([30]). These roads then create more access to relatively untouched forest land ([6]), helping small farmers as well as developers to spread out into pristine areas to establish their new farms or settlements ([20], [38]). Infrastructure improvement itself thus causes considerable additional deforestation.
Two lines of study have emerged to help further explain the causes and implications of such deforestation as well as to investigate solutions to forest loss. The forest transition theory (FTT) literature has used more of a case study method to reveal trends between economic growth and forest cover. Based on forest change from the 19th and 20th centuries in developed countries ([32]), this theory argues that early economic development initially causes old-growth forests to decline but then a higher stage of economic growth stabilizes that forest loss and eventually leads to reforestation by secondary forests ([26]). Hence the FTT hypothesizes a U-shaped pattern where forests regrow due to such factors as land abandonment by farmers seeking better economic opportunities in cities ([32], [33]) and the personal or governmental decision to plant valuable trees as a source of future income ([41]).
Many researchers have sought to discover whether the FTT applies to developing countries as well, with some studies discovering forest transitions in Brazil ([38]), Ecuador ([40]), and Mexico ([26]) but other research failing to find the U-shaped curve for different areas of the world ([41]). These studies generally advocate for more governmental action to encourage the preservation and restoration of forests, arguing that these governments then can enhance the positive outcomes from economic growth.
While the FTT literature presents some interesting results, we focus instead on the second approach to forest loss that seeks to discover whether an Environmental Kuznets Curve exists for deforestation. The deforestation EKC literature has adopted a more econometric panel-based methodology to examine overall deforestation trends among various groupings of countries, with the hope that identifiable patterns might appear to help direct forest policy. Grossman & Krueger ([21]) and Grossman ([22]) first applied Kuznet’s ([28]) inverted U pattern of income inequality and economic growth to environmental problems, suggesting a similar pattern for the relationship between economic growth and environmental degradation that they then labeled the Environmental Kuznets Curve.
A deforestation EKC therefore starts at a country’s beginning stage of economic expansion, where the pristine old-growth forests remain mostly untouched beyond some basic subsistence, building, and energy uses. As the country develops economically, it experiences the scale effect ([17]); the country utilizes forests as an engine of economic development by cutting trees down at a rapid pace to harvest resources as well as to allow the expansion of farms or the timber industry. Eventually, the country reaches an income level where deforestation levels off and begins to decrease, thereby creating the inverted U scale. The deforestation EKC does not focus on reforestation trends as the FTT does. Yet as Perz & Skole ([38]) point out, this inverted-U pattern of the EKC is the inverse of the U-shaped curve of the FTT, indicating that the two approaches are related.
The EKC literature also places importance on technology, suggesting that it can influence the inverted-U pattern potentially by “flattening” the EKC without impeding a country’s economic growth ([37]). A more advanced technology generally allows for the substitution of forest products by other non-forest based equivalents. For example, coal or other sources of energy can replace the need for firewood for the home or wood combustion to generate electricity ([11], [14]). Similar patterns exist for other forest goods, such as substituting concrete for wood in buildings. As the demand for the forest products diminishes, remaining forests can persevere or even recover.
Better technological innovations in farming also can reduce the need for expansion into forests by allowing for crop intensification, which creates higher productivity on already existing farm land ([7], [16]). Such advances include natural and artificial fertilizers, farm machines, new crop practices, better irrigation, and so forth. Without access to this technology, farmers must rely on old patterns of subsistence farming that can cause more forest loss ([6]). Yet, often these innovations can prove expensive, especially for these subsistence farmers. As such, technology can enhance the chances for an EKC, but only if that technology can spread easily and affordably.
When it comes to discovering an actual EKC for deforestation, though, researchers have found varied results. Cropper & Griffiths ([14]) presented one of the first studies on deforestation and found evidence for an income-based EKC in the developing countries of Latin America and Africa but not in Asia. Overall, they suggested that forest loss will increase with economic activity but then will slow and possibly stabilize. Shafik ([43]), though, found no correlation between income and deforestation. Barbier & Burgess ([7]) reported an EKC for Asian countries where a higher income and better cereal yields led to less spread of agricultural land and hence lower deforestation rates; they furthermore found that additional forest loss occurred when countries exported more agricultural products.
Bhattarai & Hammig ([11]) also discovered a deforestation EKC for a sample of countries in Africa, Asia, and Latin America. While income growth did turn out significant with an inverted U pattern, political institutions were significant as well with stronger institutions leading to less deforestation. Better cereal yields did facilitate the retention of forests but just for the African region. Population growth in general led to less deforestation in Latin America and Africa but more deforestation in Asia. A higher rural population density, though, resulted in more forest loss in Latin America and Africa but less loss in Asia. Koop & Tole ([27]) focused their study on income inequality to determine how poverty could affect a potential EKC for deforestation. They found that rising income and population growth had little impact on forest loss in “countries with an average amount of inequality” (199) but that both variables actually worsened deforestation in countries with high levels of income inequality.
Ehrhardt-Martinez et al. ([18]) reported an EKC for deforestation, with high urbanization and a larger scope of government leading to less forest loss but rural population pressure creating more deforestation. Barbier ([8]) revisited deforestation but did not see an income-based EKC, although increasing cereal yields did help with slowing forest loss due to agriculture. Culas ([15]) focused on Latin America, Asia, and Africa but found an EKC just for Latin America and particularly if strong property rights existed. Scrieciu ([42]), though, criticized earlier studies for not taking into consideration autocorrelation problems. After running two separate regressions, one that ignored autocorrelation and another that corrected for it, Scrieciu discovered that the total population of a country had the most impact on deforestation by encouraging the expansion of agricultural lands into forests. As these studies show, consensus eludes researchers about the presence of an EKC for deforestation.
Material and methods
We take another look at this possible deforestation EKC by using the World Development Indicators to construct an improved panel dataset with more current data from 1990 to 2007 for OECD countries and the non-OECD regions of Latin America, Asia, and Africa ([47]). As with many other studies, our dataset excludes countries with less than 10% forest land overall, since this percentage represents very small forest area; these countries therefore would act as outliers and muddle the results. Nevertheless, the panel data remain balanced for both the OECD and non-OECD regions according to the GMM estimation results, meaning that any missing observations do not significantly impact the outcomes. Rather than attempt to discover general but unrealistic turning points that apply to every country, we instead seek to find correlations between different variables and forest cover.
Tab. 1 presents definitions of all the variables along with summary statistics for the OECD and non-OECD regions. It also provides each variable’s mean and standard deviations. Forest cover, FOR, is the dependent variable, measured by the percentage of total land area covered by forests. The decline in forest cover from year to year thus indicates that deforestation has occurred to some degree. However, such declines do not suggest the complete elimination of entire forests. The independent variables include the lagged dependent variable, per capita GDP, population growth, urbanization, trade, percentage of agricultural land of total land area, and cereal yield. We use FOR(1) to signify the lag of forest cover, with the expectation that high levels of deforestation in the past suggest high deforestation rates in the present and future.
Tab. 1 - Definition of variables and summary statistics for OECD and non-OECD region countries. The source of the database is World Development Indicators 2010 ([47]). The time period is from 1990 to 2007. (1): Australia, Canada, Denmark, Finland, France, Germany, Greece, Ireland, Italy, Japan, Netherlands, New Zealand, Norway, Poland, Portugal, Spain, Sweden, Switzerland, United Kingdom, United States. (2): Argentina, Brazil, Colombia, Dominican Republic, Ecuador, El Salvador, Honduras, Jamaica, Nicaragua, Panama, Paraguay, Peru, Trinidad and Tobago, and Venezuela, RB. (3): China, India, Indonesia, Malaysia, Philippines, Thailand, and Vietnam. (4): Benin, Cameroon, Congo, Rep., Ghana, Namibia, Nigeria, Senegal, Sudan, Togo, Zambia, and Zimbabwe.
| Group | Region | Variable | Description of the Variables | Mean | Std.Dev. | Obs. |
|---|---|---|---|---|---|---|
| OECD (1) | - | FOR | Forest area (% of land area) | 32.38 | 17.86 | 360 |
| PCI | GDP per capita (constant 2000 US$) | 22043.26 | 8976.48 | 360 | ||
| POPG | Population growth (annual %) | 0.60 | 0.47 | 360 | ||
| TOT | Net barter terms of trade index (2000 = 100) | 101.15 | 9.94 | 356 | ||
| URBAN | Urban population (% of total) | 73.20 | 10.35 | 360 | ||
| AGLAND | Agricultural land (% of land area) | 44.06 | 22.35 | 360 | ||
| CERYLD | Cereal yield (kg per hectare) | 4873.26 | 1794.06 | 360 | ||
| Non-OECD | Latin America (2) | FOR | Forest area (% of land area) | 43.43 | 15.10 | 252 |
| PCI | GDP per capita (constant 2000 US$) | 3133.68 | 2056.36 | 252 | ||
| POPG | Population growth (annual %) | 1.52 | 0.59 | 252 | ||
| TOT | Net barter terms of trade index (2000 = 100) | 99.42 | 17.84 | 233 | ||
| URBAN | Urban population (% of total) | 61.10 | 19.54 | 252 | ||
| AGLAND | Agricultural land (% of land area) | 36.95 | 15.26 | 252 | ||
| CERYLD | Cereal yield (kg per hectare) | 2506.63 | 855.02 | 252 | ||
| Asia (3) | FOR | Forest area (% of land area) | 36.64 | 16.59 | 126 | |
| PCI | GDP per capita (constant 2000 US$) | 1342.44 | 1180.00 | 126 | ||
| POPG | Population growth (annual %) | 1.55 | 0.55 | 126 | ||
| TOT | Net barter terms of trade index (2000 = 100) | 98.75 | 11.41 | 103 | ||
| URBAN | Urban population (% of total) | 39.10 | 13.88 | 126 | ||
| AGLAND | Agricultural land (% of land area) | 38.71 | 14.47 | 126 | ||
| CERYLD | Cereal yield (kg per hectare) | 3324.38 | 952.83 | 126 | ||
| Africa (4) | FOR | Forest area (% of land area) | 35.42 | 19.36 | 198 | |
| PCI | GDP per capita (constant 2000 US$) | 623.79 | 548.39 | 196 | ||
| POPG | Population growth (annual %) | 2.45 | 0.65 | 198 | ||
| TOT | Net barter terms of trade index (2000 = 100) | 103.23 | 32.57 | 196 | ||
| URBAN | Urban population (% of total) | 39.99 | 7.93 | 198 | ||
| AGLAND | Agricultural land (% of land area) | 45.50 | 17.71 | 198 | ||
| CERYLD | Cereal yield (kg per hectare) | 1005.26 | 396.82 | 198 |
PCI denotes per capita GDP in 2000 US$. The model utilizes GDP per capita in its quadratic form, PCI2, to verify the presence or lack of an EKC. Previous studies have suggested that a rising income does help reduce deforestation ([7], [32]), but that income growth also might encourage a greater opening of pristine forests due to the building of more roads ([30]). Economic development additionally can lead to better paying jobs in non-agricultural sectors, subsequently leading to less deforestation as workers and farmers abandon farming in favor of steadier paychecks ([26], [27]). Hence an inverted U-shaped EKC should show PCI as negative, meaning that increases in income lead to declines in forest area (greater deforestation); PCI2, though, would be positive, indicating that further income growth would result in more forest cover and less deforestation.
Total annual percentage population growth, POPG, should signify whether or not an increasing population impacts forest cover. Numerous studies have shown that a rising population demands more resources and land, usually then taken from forests ([14], [31]). Accordingly, POPG should have a negative sign, which would signify a decline in forest cover.
TOT denotes the net barter terms of trade index. The idea is that as trade becomes more open, a country would export more products than it would import ([11]). Some studies have reported that increased trade openness will cause the expansion of roads and agriculture as well as lead to elevated exports of forest goods ([19], [30]). As a consequence, these countries experience further deforestation ([24]). Yet more open trade also can allow for the importation of substitutes of forest resources, resulting in less forest loss.
The percent of urban population of the total, URBAN, measures the impacts of a growing urbanization on forest cover. Previous research has suggested that increasing urbanization can flatten the EKC ([13]); migration by farmers and workers to the cities can reduce the pressure on the forests from subsistence farming ([38], [41]). Additionally, urban areas tend to experience more substitution of wood products, both in terms of energy and building materials ([18]). Even so, further urbanization instead can result in a greater demand for forest products that would lead to more deforestation rather than less ([13]).
The percentage of agricultural land of total land area, AGLAND, shows the dynamics between agriculture and deforestation. While Mather & Needle ([31]) and Scrieciu ([42]) do make a valid point that not all land converted to agricultural use stems from forests, most studies have shown a fairly strong link between agricultural expansion and deforestation ([8], [15]). Consequently, the expectation is that an increase in land used for agriculture will come at the expense of forests.
The variable CERYLD represents cereal yield. Some researchers have used cereal yield as a proxy for technology, with the anticipation that greater technological advancement in such areas as fertilizer, machinery, and land usage would enhance crop yields on already existing farm land ([7], [11], [42]). Increases in cereal yield thus should equate to more investment in current farms and a decline in shifting cultivation, leading then to less deforestation.
Most studies on an EKC for deforestation have relied on regressions using random or fixed effects. However, these models often have autocorrelation and heteroscedasticity concerns that then call into question the accuracy of their results ([42], [45]). The more dynamic model of Generalized Method of Moments (GMM) provides an estimation technique that produces more accurate and sound results without suffering from autocorrelation in the error term. For a more detailed explanation, see Arellano & Bond ([2]), Arellano & Bover ([3]), Blundell & Bond ([12]), and Halkos ([23]). The GMM model helps fix for heteroscedasticity and corrects for endogeneity of the independent variables ([23]). It therefore produces efficient and unbiased results.
The model’s equation uses a modified Arellano-Bover/Blundell-Bond ([3], [12]) GMM dynamic panel-data estimation, specified as follows for OECD and non-OECD countries (eqn. 1):
where FOR is the forest cover; FORt-1 is the lagged dependent variable; PCI represents per capita GDP; PCI2 denotes the quadratic form of GDP per capita; POPG is the population growth; TOT signifies net barter terms of trade; URBAN represents the percent of urban population; AGLAND is the percent of agricultural land area; CERYLD denotes cereal yield; εit is the error term; subscript i equals the country and subscript t is the time period. The model assumes that first differences will remove country-specific effects such as climate and initial forest cover ([44]) and that all independent variables except the lagged dependent variable are exogenous. We further conduct the autocorrelation AR(1) and AR(2) tests to investigate if the error term exhibits evidence of serial correlation. All of the variables are in logarithmic form. We estimate the model using the STATA® statistical software (StataCorp LP, College Station, TX, USA).
Results and discussion
Tab. 2 gives the results of the GMM estimation for OECD countries as well as for the specific regions of Latin America, Asia, and Africa. A visual depiction of the curves are displayed in Fig. 1. The independent variables have both negative and positive statistically significant impacts. The second-order test AR(2) cannot reject the null hypothesis of no autocorrelation, which indicates that serial correlation does not exist.
Tab. 2 - GMM estimation results (dependent variable = log of FOR). Parentheses marks standard errors. (*): p<0.10; (**): p<0.05; (***): p<0.01. (1): Australia, Canada, Denmark, Finland, France, Germany, Greece, Ireland, Italy, Japan, Netherlands, New Zealand, Norway, Poland, Portugal, Spain, Sweden, Switzerland, United Kingdom, United States. (2): Argentina, Brazil, Colombia, Dominican Republic, Ecuador, El Salvador, Honduras, Jamaica, Nicaragua, Panama, Paraguay, Peru, Trinidad and Tobago, and Venezuela, RB. (3): China, India, Indonesia, Malaysia, Philippines, Thailand, and Vietnam. (4): Benin, Cameroon, Congo, Rep., Ghana, Namibia, Nigeria, Senegal, Sudan, Togo, Zambia, and Zimbabwe.
| Variables | Model 1 | Model 2 | Model 3 | Model 4 |
|---|---|---|---|---|
| OECD(1) | Latin America (2) | Asia (3) | Africa (4) | |
| FOR(L1) | 0.971*** (0.000) |
1.036*** (0.002) |
0.977*** (0.004) |
1.025*** (0.000) |
| PCI | 0.033*** (0.008) |
0.162*** (0.013) |
0.002 (0.019) |
-0.036*** (0.006) |
| PCI 2 | -0.001*** (0.000) |
-0.009*** (0.000) |
0.000 (0.001) |
0.003*** (0.000) |
| POPG | -0.000*** (0.000) |
-0.001 (0.000) |
-0.018*** (0.000) |
-0.001*** (0.000) |
| TOT | 0.001** (0.000) |
-0.005*** (0.001) |
-0.002 (0.002) |
0.001*** (0.000) |
| URBAN | -0.004 (0.003) |
0.005 (0.004) |
-0.053*** (0.006) |
-0.001 (0.001) |
| AGLAND | -0.003*** (0.000) |
-0.015*** (0.003) |
-0.004 (0.006) |
0.004*** (0.001) |
| CERYLD | 0.000*** (0.000) |
-0.001 (0.001) |
0.000 (0.002) |
0.000 (0.000) |
| Constant | -0.036 (0.041) |
-0.773*** (0.060) |
0.275*** (0.052) |
-0.011 (0.018) |
| Number of Observations | 321 | 220 | 98 | 180 |
| Number of Countries | 20 | 14 | 7 | 11 |
| Arellano-Bond Test for zero autocorrelation AR(1) | -1.794* | -0.916 | 0.787 | 2.028** |
| Arellano-Bond Test for zero autocorrelation AR(2) | -0.249 | 0.639 | 0.440 | 0.990 |
Fig. 1 - Plotted graphs showing the direction of the deforestation rates in OECD countries and specific regions of Latin America, Asia, and Africa. (lnfor): log of forest cover (% of land area); (lngdp): log of GDP per capita (constant 2000 US$).
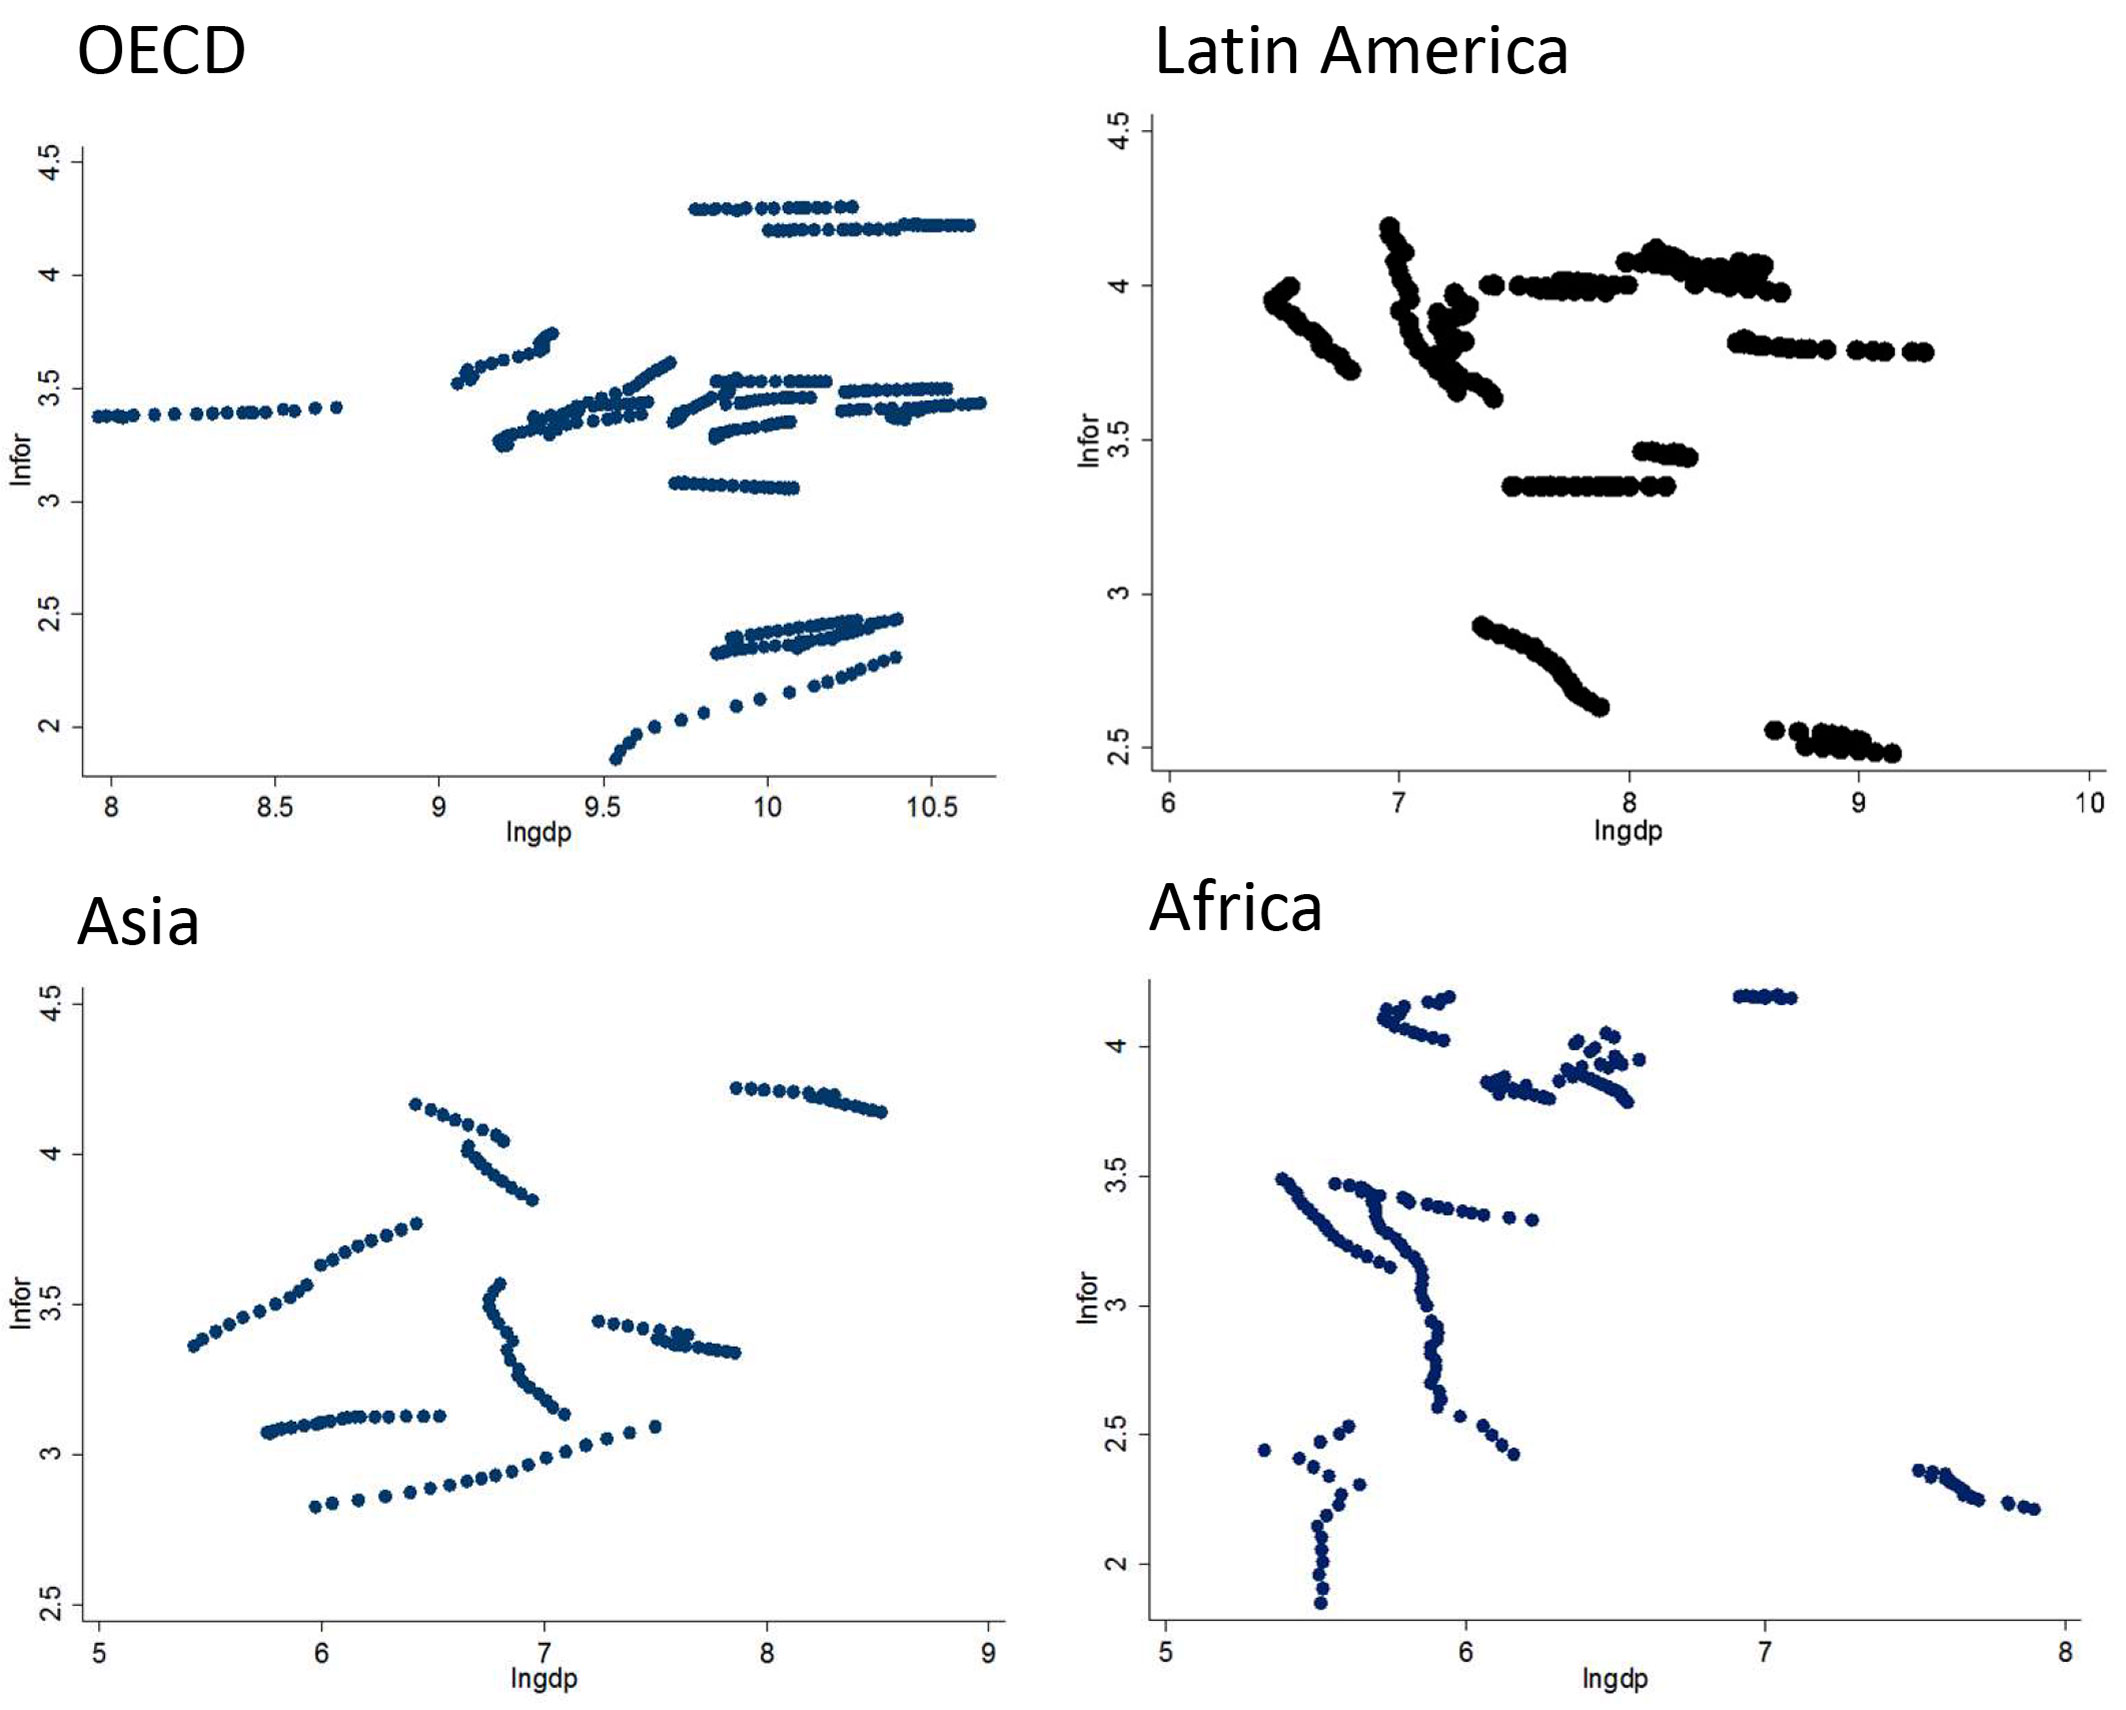
Examining 20 OECD countries has uncovered some important trends. In particular, the results show an unexpected N-shaped deforestation pattern for OECD countries, signifying that forests still play a key role in economic development. PCI has positive and significant signs, indicating that a growing economy in these developed countries generally leads to more forest cover and less deforestation. Such a result does not signify that all deforestation has ended but rather that forest cover as a whole has started to increase due to replanting policies, more substitution of forest products, less need for farm expansion into forests, etc. ([11], [31]).
However, the quadratic form PCI2 shows a negative and significant outcome, revealing the N-shaped curve for deforestation; forest cover decreases (i.e., deforestation increases) as these OECD countries develop even further economically. The N-shaped curve emerges when taking into consideration the historical record for OECD countries that shows that deforestation rates rose with economic development in the 19th and early 20th centuries. Deforestation then declined in the late 20th century due to pressure by environmentalists for better environmental policies such as selective logging as well as from the “forest transition” experienced by these countries ([32]). Since the time period of our model is from 1990 to 2007, our results capture the “tail-end” ([29], [43]) of the N-shaped progression where decreasing deforestation reverses to the point that deforestation begins to rise again.
Such additional deforestation can come from many different causes, but the key reason for this deforestation remains the harvesting of forest products for economic gain. Many OECD countries still cut down forests to create lumber or other products for export and domestic use, particularly as second-growth forests have matured ([36]). Even logging by-products such as sawdust and waste wood have become valuable as the technology to exploit these products has emerged ([48]). Forests also disappear due to infrastructure expansion such as the building of new roads as well as from the placement of industrial parks and subdivisions where forests once stood.
In addition, technological innovation frequently has created a greater need for forest products; for example, OECD countries have begun to rely more on wood chips and wood pellets for energy generation ([46]). The OECD countries also tend to use less substitution of wood products than that seen in developing countries, for example forgoing concrete in favor of wood as the preferred building material.
More critically, though, rising incomes also make possible a larger middle class that generally embraces the predominant attitude of overconsumption found in many developed countries ([4]). As people can afford more luxuries, they buy much more than they need and thus consume even more resources. For example, the higher standard of living that comes from rising incomes often encourages more people to move to the newly developed subdivisions so that they can have a house with a yard. Essentially, continued economic development and rising overconsumption creates an enhanced scale effect ([17]), where forest loss eventually supersedes any forest gains.
This outcome also has important implications for the forest transition theory in that the results imply that the conventional forest transition might not end at just the one stage of forest regrowth. For example, countries often replace natural forests with monoculture plantations of particularly useful trees such as pine ([7], [38]). Over time, these plantations can give rise to a secondary round of deforestation when the trees are harvested. Hence, rather than reveal the traditional U shape of the FTT, our results suggest that forest transitions by developed countries show a horizontal S shape as economic growth continues to rise and forests start to decline once more. So while many researchers devote considerable attention to investigating whether the FTT applies to developing countries, more research should continue to trace forest trends for developed countries as well.
POPG unsurprisingly is negative and significant, revealing that population increases tend to promote more forest loss; this result thereby corroborates the studies that show population helps drive deforestation ([31]). Population growth also has a link to consumption, where growing numbers of people need even more of a country’s limited resources and land ([1], [13]). Forests therefore decline because they have the essential resources that more and more people depend on for everyday living.
TOT, though, shows a positive and significant outcome, implying that trade benefits forests in OECD countries. It supports research suggesting that an open developed economy often leads to forest growth ([19]); such an economy can conserve resources by creating or importing better technologies and adopting more environmentally friendly practices. This result also indicates that increased trade allows these countries to conserve their forests by importing similar or substitute resources from other countries.
AGLAND is negative and significant, denoting that additional agricultural land in the OECD countries does indeed come from forests rather than other types of land. Many developed countries have converted most of their arable land into farms, forcing them to expand into the forests to create more farms when needed. CERYLD has the expected positive and significant signs, thereby verifying that investments in farming technologies and the use of innovative techniques can benefit forests considerably.
Tab. 2 also shows the outcomes of the GMM estimation for the non-OECD regions of Latin America, Asia, and Africa. Looking specifically at these regions rather than making a general evaluation of non-OECD countries should give more insight into the dynamics of a possible deforestation EKC and the influences of the other variables.
Some noticeable distinctions emerge when comparing the three regions in terms of income, with only the African region suggesting evidence for a forest EKC. PCI is significant and negative with PCI2 significant and positive for the African countries. Accordingly, as income rises and then doubles, forest cover in these African countries decreases due to more deforestation but then increases as deforestation rates decline, thereby following the general pattern of the EKC. Economic development therefore seems to have an important role in helping to preserve forests in these African countries, which other studies also have discovered ([11], [14]). However, the insignificant and positive results for both PCI and PCI2 with the Asian region shows that income has very little effect on forest cover for these countries; this outcome is perhaps due to the advanced forestry plans of many countries in Asia, such as China and Vietnam ([35], [39]). As for Latin America, PCI is significant and positive and PCI2 is significant and negative; income growth initially leads to an increase in forest cover, but then deforestation rises at even higher income levels. Latin American countries often experience substantial amounts of shifting cultivation and generally have extensive timber operations, possibly explaining these results.
The impact of population on forest cover loss, POPG, remains insignificant and negative for the Latin American region, but negative and significant for the African and Asian regions, with a rising population leading to decreasing forest cover as ever more people demand additional forest resources. These outcomes thus verify Allen & Barnes ([1]), Barbier ([6]), Carr et al. ([13]), and Cropper & Griffiths ([14]).
The results of trade, TOT, do show that trade openness impacts the three regions differently, with the Asian region having an insignificant and negative sign. The Latin American region shows a significant and negative sign, revealing declines in forest cover due to more trade openness. These results imply that forest products make up a substantial portion of the exports for these Latin American countries. The African region, though, has a significant and positive outcome, signifying gains in forest cover. The forests of these African countries thus appear to benefit from more open trade.
The Asian region shows a significant and negative sign for the effects of urbanization, URBAN, differing greatly from the Latin American and African regions that have insignificant results. This outcome suggests that these Asian countries lose forest cover as they become ever more urbanized, possibly from the spread of these cities into forest land or due to the desire for more forest resources to supply the needs of the growing cities ([13]). Such results counter Ehrhardt-Martinez et al. ([18]).
Interestingly, the three regions do have some differences in the impacts of agricultural land conversion, AGLAND, with positive and significant signs for the African region. The Latin American region displays negative and significant signs while the Asian region has negative and insignificant outcomes. These results show that these African countries do not always extend into forest land to create more farms, possibly converting grasslands instead. Since Latin America generally has less grassland, countries in this region must transform forest land into farm land to grow more food.
In terms of cereal yield improvements, CERYLD, none of the regions showed significant results, with the Latin American region negative and the African and Asian regions positive. The results suggest that crop intensification through new techniques and the added use of fertilizer does not frequently occur in these regions, potentially from the costs of these innovations.
The story of deforestation necessarily is complex, with intricate dynamics. Not every country or region approaches its forest resources the same way, although some variables do have similar impacts and lead to comparable outcomes. For example, population growth tends to decrease forest cover for many developed and developing countries, indicating a greater need to discuss limiting the effects of population growth in the present and near future. However, other variables influence the regions in different ways, even though the regions share in common the need to develop economically. The countries of the African region we studied in particular appear to follow their own path with forests that the countries in the Asian and Latin American regions do not duplicate. Additionally, many of the countries in the Latin American region seem to consider forests a particularly good resource for economic development.
Conclusion
A deforestation EKC would suggest that eventually income growth would lead to reduced forest loss. By using the more dynamic technique of GMM estimation, we found some intriguing results. OECD countries experienced an N-shaped curve where deforestation had reversed but then began to rise again. Such an outcome suggests that progressively more valuable forest products and land will lead to further forest loss as income growth continues. Population growth and increased conversion to agricultural land exacerbated that forest loss, fulfilling standard expectations about the impacts of these variables. However, enhanced trade and better cereal yields tended to improve forest cover, partially offsetting the deforestation.
For non-OECD countries, only the countries of the African region demonstrated an income-based EKC where deforestation increased at growing income levels but then declined at even higher income levels. These countries also experienced forest cover improvement with enhanced trade and greater agricultural land conversion even as population growth caused more forest loss. For the countries of the Asian region just population growth and higher urbanization impacted forest cover, with both contributing to forest loss. The countries of the Latin American region experienced a rise in forest cover with initial income growth, but had more forest loss with further economic development. This region’s results also showed forest cover declined due to increased trade and more conversion to agricultural land.
Overall, forest cover still continues to disappear. The solution to this deforestation itself is complicated, though. Countries experiencing substantial forest loss frequently see a greater benefit in continuing to exploit their forest resources than in safeguarding those forests ([10]). All too often, they take umbrage at any attempt by some developed countries to slow that deforestation, making it more difficult to establish forest preservation policies worldwide. Although treaties and agreements like the Kyoto Accords and REDD+ (Reducing Emissions from Deforestation and Forest Degradation) attempt to limit the impact of deforestation ([25]), countries frequently fail to live up to those arrangements. The most likely way then to reduce forest loss would be to help developing countries through technology transfers and by encouraging sustainable income growth for all countries that would rely more heavily on substitution of forest products with materials like bamboo for building and solar power or natural gas for energy.
Such programs can be buttressed, however, by giving developing countries in particular money to expand national park reserves and enforce limits on deforestation in them; some of these funds could go to pay people to directly take care of the forests as well, thereby reducing subsistence farming as one of the main drivers of deforestation. While mutually beneficial agreements with pharmaceutical drug companies or ecotourism can provide other ways to generate revenue, the best way to protect forest remains government action. Governments should encourage the planting of new forests, especially of native species, and enact regulations to end exploitative clear-cut logging.
References
Online | Gscholar
Authors’ Info
Authors’ Affiliation
Gordon State College, Department of Business and Public Service, 419 College Drive, Barnesville, GA 30204 (USA)
Gordon State College, Department of History and Political Science, 419 College Drive, Barnesville, GA 30204 (USA)
Corresponding author
Paper Info
Citation
Joshi P, Beck K (2016). Environmental Kuznets curve for deforestation: evidence using GMM estimation for OECD and non-OECD regions. iForest 10: 196-203. - doi: 10.3832/ifor2066-009
Academic Editor
Agostino Ferrara
Paper history
Received: Mar 24, 2016
Accepted: Oct 06, 2016
First online: Dec 13, 2016
Publication Date: Feb 28, 2017
Publication Time: 2.27 months
Copyright Information
© SISEF - The Italian Society of Silviculture and Forest Ecology 2016
Open Access
This article is distributed under the terms of the Creative Commons Attribution-Non Commercial 4.0 International (https://creativecommons.org/licenses/by-nc/4.0/), which permits unrestricted use, distribution, and reproduction in any medium, provided you give appropriate credit to the original author(s) and the source, provide a link to the Creative Commons license, and indicate if changes were made.

Web Metrics
Breakdown by View Type
Article Usage
Total Article Views: 43868
(from publication date up to now)
Breakdown by View Type
HTML Page Views: 35178
Abstract Page Views: 3181
PDF Downloads: 4169
Citation/Reference Downloads: 44
XML Downloads: 1296
Web Metrics
Days since publication: 2690
Overall contacts: 43868
Avg. contacts per week: 114.15
Article Citations
Article citations are based on data periodically collected from the Clarivate Web of Science web site
(last update: Feb 2023)
Total number of cites (since 2017): 23
Average cites per year: 3.29
Publication Metrics
by Dimensions ©
Articles citing this article
List of the papers citing this article based on CrossRef Cited-by.
Related Contents
iForest Similar Articles
Review Papers
A review of the environmental Kuznets curve hypothesis for deforestation policy in Bangladesh
vol. 4, pp. 16-24 (online: 27 January 2011)
Technical Reports
Deforestation, land conversion and illegal logging in Bangladesh: the case of the Sal (Shorea robusta) forests
vol. 5, pp. 171-178 (online: 25 June 2012)
Research Articles
Identifying priority conservation areas for above-ground carbon sequestration in Central Mexico
vol. 10, pp. 923-929 (online: 07 December 2017)
Research Articles
Seeing, believing, acting: climate change attitudes and adaptation of Hungarian forest managers
vol. 15, pp. 509-518 (online: 14 December 2022)
Research Articles
Potential impacts of regional climate change on site productivity of Larix olgensis plantations in northeast China
vol. 8, pp. 642-651 (online: 02 March 2015)
Research Articles
Predicting the effect of climate change on tree species abundance and distribution at a regional scale
vol. 1, pp. 132-139 (online: 27 August 2008)
Research Articles
Impact of climate change on radial growth of Siberian spruce and Scots pine in North-western Russia
vol. 1, pp. 13-21 (online: 28 February 2008)
Review Papers
Impacts of climate change on the establishment, distribution, growth and mortality of Swiss stone pine (Pinus cembra L.)
vol. 3, pp. 82-85 (online: 15 July 2010)
Commentaries & Perspectives
What happened to forests in Copenhagen?
vol. 3, pp. 30-32 (online: 02 March 2010)
Research Articles
Impact of deforestation on the soil physical and chemical attributes, and humic fraction of organic matter in dry environments in Brazil
vol. 15, pp. 465-475 (online: 18 November 2022)
iForest Database Search
Search By Author
Search By Keyword
Google Scholar Search
Citing Articles
Search By Author
Search By Keywords
PubMed Search
Search By Author
Search By Keyword


