The effect of the calculation method, plot size, and stand density on the accuracy of top height estimation in Norway spruce stands
iForest - Biogeosciences and Forestry, Volume 10, Issue 2, Pages 498-505 (2017)
doi: https://doi.org/10.3832/ifor2108-010
Published: Apr 12, 2017 - Copyright © 2017 SISEF
Research Articles
Abstract
The aim of this study was to evaluate top height (TH) estimates for Norway spruce stands calculated according to different computational methods, and to assess the effects of stand density and plot size on TH estimation accuracy. Field data were collected from twelve 1 ha research plots located in even-aged spruce stands. Conventional estimates were found to generally overstate TH. The accuracy of TH estimation was dependent on sample plot size. TH estimation error decreased rapidly with increasing sample plot area, but only up to a certain cut-off point. Errors in TH estimation were also related to local stand density, with low and very high density levels leading to decreased accuracy. The most reliable TH estimates were obtained using the U-estimator method, which is resistant to changes in sample plot size.
Keywords
Introduction
Measuring site productivity is critical for predicting forest growth and yield ([22]). The most common method of determining site index (SI) is estimation based on the height and age of a stand ([12], [25], [24]). Lorey mean height (HL), one of the oldest stand height definitions, is still occasionally employed by foresters for evaluating site index ([13], [22], [27]). However, HL is appreciably affected by thinnings and stand density and, therefore, top height (TH) is considered a better SI estimator. Although foresters use TH as a measure of site productivity, a universally accepted definition of TH or a standard method of its calculation have not been adopted. In the United States TH is defined as the average height of dominant and codominant trees ([22]). In Europe, TH is usually defined as the average height of either a fixed or relative number of the largest trees in a stand. Typically, TH is estimated based on the average height of 100 thickest (largest diameter at breast height - DBH) trees per hectare or the 20% thickest trees in the stand ([3], [2], [22], [23], [26]). The TH calculated pursuant to these conventional definitions is an order statistic, which means that estimation results depend both on the total number of trees per sample plot and on the number of thickest trees, and thus it is sensitive to sample plot size ([11]). In estimating TH from sample plot data, it is common practice to use a certain proportion of trees per plot area, e.g., 10 largest trees for 0.10 ha plots or 5 largest trees for 0.05 ha plots. Since the estimator of stand height is an order statistic, such a procedure leads to divergent TH estimates for sample plots of various sizes. The effect of plot size on TH estimation is widely ignored, even though it has been discussed in numerous papers ([5], [6], [11], [7]). Theoretical studies on this subject indicate that unbiased TH estimates can be obtained on the basis of small sample plots, with an area of 0.015 ha ([5]) or 0.0173 ha ([20]). Theoretical studies have led to a proposal to modify the TH definition, with TH being the expected height of the largest (by height or diameter) tree in a non-empty 0.01 ha plot that is randomly selected from the stand ([19]). The proposed change aims to eliminate the effect of plot size on TH estimates. However, in many cases the use of such small sample plots is impractical due to both the spatial diversity of stand composition and the objectives of forest inventory.
Spatial dependence among individual trees in a forest is typically positive and operates at a scale of microsite variation, but this is confounded by negative spatial dependence over small inter-tree distances caused by competition among immediate neighbors ([10], [9]). A positive correlation decreasing with distance may arise from the fact that soil conditions tend to be more similar at nearby points than at points further apart ([4], [8], [17]). The opposite phenomenon is caused by competition between trees due to increased tree size variability in small areas and decreased variability in large areas. This coincidence of spatial processes can result in complicated patterns of observed dependence, which evolve in the course of stand development ([4]). First, the results obtained from very small plots will generally exhibit high variability, and thus precise estimates of selected stand characteristics will require a large sample size and will be more labour- and cost-intensive. Second, sample plot measurements are frequently used not only to evaluate TH, but also to determine other characteristics of the stand, for example, volume, biomass, thinning intensity, etc. In practice, typical plot sizes greater than 0.01 ha (usually 0.04 to 0.10 ha) are employed.
Estimation of TH by simply selecting a certain number of the thickest trees appropriate to the size of the sample plot is inherently biased. An unbiased procedure must follow the guidelines of Rennolls ([19]), who argued that the thickest trees should be selected from each 0.01 ha sub-plot. Nevertheless, the demarcation of sub-plots or the determination of tree coordinates, which are required in this procedure, may be too time-consuming in many practical applications. Thus, to ensure the best estimates from field measurements, García ([6]) and García & Batho ([7]) proposed a U-estimator (UE) and an adjusted largest tree (ALT) method, which do not require information about the spatial distribution of trees. However, the proposed methods have not been subjected to validation on extensive research material, and in particular on large plots similar in size to the stand area.
The main objective of this study was to evaluate the effect of sample plot size on differences between TH estimates calculated according to the conventional method and methods involving the division of research plots into 0.01 ha sub-plots, as well as to verify to what extent the proposal by García ([6]) reduces the observed differences in TH estimation in young, middle-aged, and old Norway spruce stands. Another goal was to evaluate the effect of stand density and plot size on the accuracy of TH estimates for spruce stands.
Materials and methods
Materials
Field data were collected from twelve 1 ha research plots located in three even-aged spruce stands which were 58, 85, and 120 years old. The studied stands are situated in the Beskid Zywiecki Mountains, Western Carpathians (Fig. 1). The youngest stand (YS), aged 58 years, in the Glinka forestry area (19° 12′ 40″ E. 49° 27′ 28″ N, NE exposition) is characterized by the largest species diversity, having a distinctly two-storey structure in some places. The first storey consists of spruce with some fir and sporadic instances of Douglas fir. The second storey consists of beech and sycamore maple, which are found in moist areas near watercourses. The middle-aged stand (MS) and the old stand (OS), aged 85 and 120 years, respectively, are located in the Zlatna forestry area (19° 11′ 04″ E, 49° 29′ 00″ N, NE exposition; and 19° 11′ 18″ E, 49° 29′ 10″ N, W exposition, respectively). They have a single-storey structure with spruce accounting for 100% and 98.6% of the stand, respectively.
Fig. 1 - Location of the research area and the distribution of trees on individual 1 ha research plots.
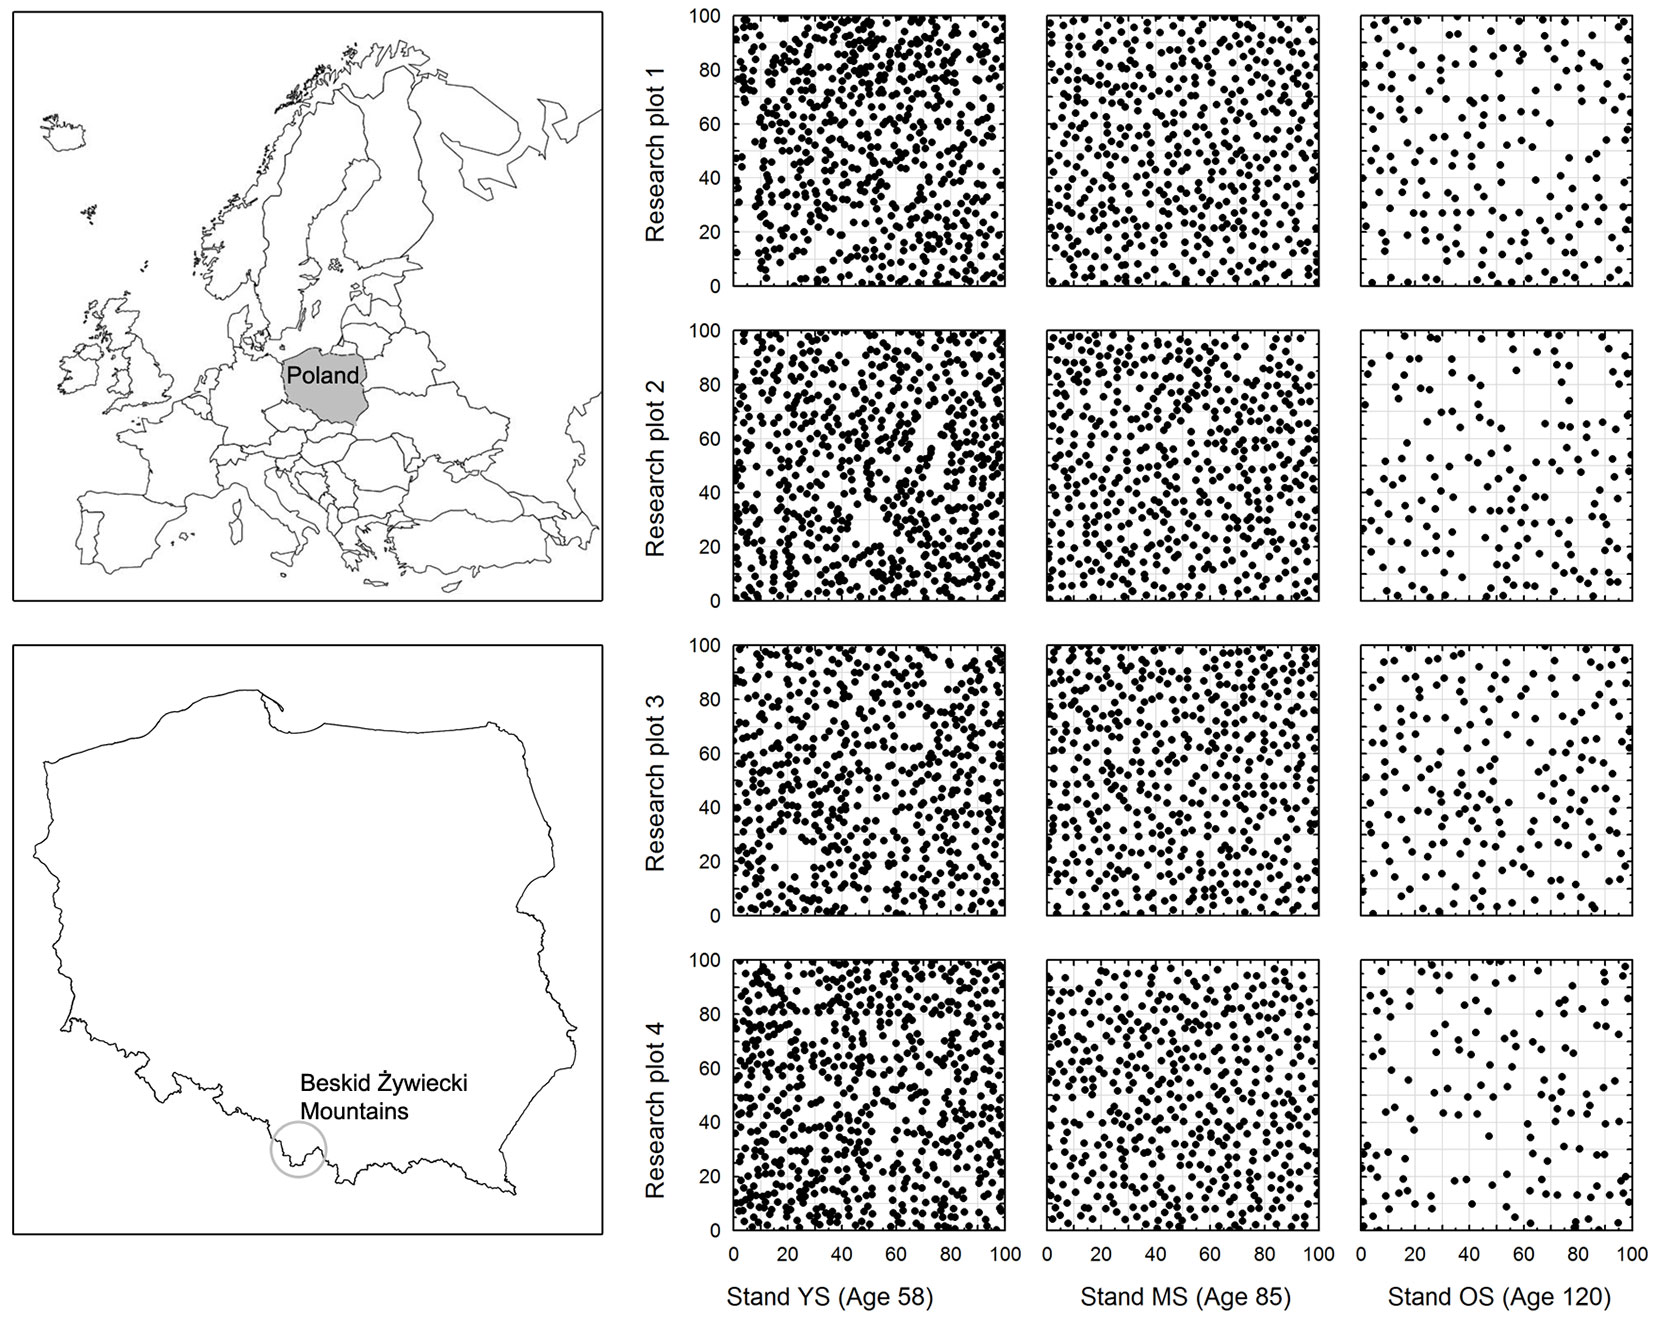
In each of the stands, four 1 ha research plots (100 × 100 m each) were marked out for examination (see Tab. 1). The diameter at breast height (DBH) and height (H) of all spruces was determined (Tab. 2). DBH was measured with an accuracy of 1 mm in two orthogonal directions, and tree height was determined to the nearest 0.1 m using a Vertex III hypsometer. In addition, a theodolite was used to establish the coordinates (xi, yi) of every tree on the plots.
Tab. 1 - Characteristics of the research plots. (N): trees ha-1; (G): basal area (m2 ha-1); (%N): spruce proportion in number of trees; (%G): spruce proportion in basal area; (YS): young stand - 58 years; (MS): middle-age stand - 85 years; (OS): old stand - 120 years.
| Plot | Altitude (m a.s.l.) |
N | G | %N | %G |
|---|---|---|---|---|---|
| YS1 | 750-780 | 634 | 43.2 | 68.8 | 82.2 |
| YS2 | 780-800 | 662 | 47.5 | 79.9 | 89.5 |
| YS3 | 755-775 | 563 | 45.8 | 89.3 | 93.1 |
| YS4 | 775-800 | 669 | 52.0 | 86.2 | 92.9 |
| MS1 | 695-740 | 478 | 54.5 | 100.0 | 100.0 |
| MS2 | 735-805 | 499 | 53.1 | 100.0 | 100.0 |
| MS3 | 690-735 | 478 | 55.4 | 100.0 | 100.0 |
| MS4 | 735-795 | 463 | 52.0 | 100.0 | 100.0 |
| OS1 | 700-745 | 193 | 45.4 | 98.4 | 99.0 |
| OS2 | 745-785 | 164 | 38.6 | 97.0 | 96.3 |
| OS3 | 700-745 | 199 | 46.8 | 100.0 | 100.0 |
| OS4 | 745-785 | 140 | 36.5 | 99.3 | 98.6 |
Tab. 2 - Characteristics of Norway spruces on individual research plots: number of spruces (n), mean, maximum (Max) and minimum (Min) values, standard deviations (SD); (DBH): diameter at breast height (cm); (H): height (m); (YS): young stand - 58 years; (MS): middle-age stand - 85 years; (OS): old stand - 120 years.
| Variable | Plot | n | Mean | Min | Max | SD |
|---|---|---|---|---|---|---|
| DBH | YS1 | 436 | 31.59 | 15.0 | 57.1 | 6.39 |
| YS2 | 530 | 31.27 | 13.8 | 52.7 | 6.62 | |
| YS3 | 503 | 32.28 | 14.4 | 52.7 | 6.24 | |
| YS4 | 577 | 31.89 | 13.0 | 51.2 | 6.94 | |
| MS1 | 478 | 37.44 | 22.3 | 63.8 | 7.06 | |
| MS2 | 499 | 36.17 | 21.6 | 56.8 | 6.88 | |
| MS3 | 478 | 37.65 | 24.0 | 62.9 | 7.57 | |
| MS4 | 463 | 37.11 | 22.2 | 59.5 | 7.30 | |
| OS1 | 190 | 54.22 | 35.3 | 81.5 | 8.36 | |
| OS2 | 159 | 53.87 | 31.0 | 76.7 | 8.59 | |
| OS3 | 199 | 54.10 | 33.9 | 77.7 | 8.42 | |
| OS4 | 139 | 56.59 | 26.1 | 84.0 | 9.87 | |
| H | YS1 | 436 | 29.08 | 17.9 | 36.3 | 2.85 |
| YS2 | 530 | 29.30 | 16.5 | 36.9 | 3.21 | |
| YS3 | 503 | 29.89 | 13.7 | 37.0 | 3.01 | |
| YS4 | 577 | 29.72 | 13.1 | 36.2 | 3.57 | |
| MS1 | 478 | 36.22 | 24.8 | 44.9 | 3.39 | |
| MS2 | 499 | 35.25 | 25.7 | 43.5 | 3.31 | |
| MS3 | 478 | 36.27 | 25.8 | 44.8 | 3.51 | |
| MS4 | 463 | 36.27 | 26.5 | 44.4 | 3.30 | |
| OS1 | 190 | 40.82 | 30.1 | 48.4 | 3.34 | |
| OS2 | 159 | 38.95 | 30.4 | 49.0 | 2.96 | |
| OS3 | 199 | 41.32 | 33.6 | 48.1 | 3.13 | |
| OS4 | 139 | 39.10 | 27.3 | 45.5 | 3.08 |
Randomization of sample plot localization and the method of top height determination
Tree coordinates were used to randomly select locations for square sample plots with area (A) of 0.01, 0.02, 0.03, ..., 0.25 ha using computer simulation. The length L (m) for the sides of a sample plot was calculated from its area (eqn. 1):
Next, a pseudo-random number generator was applied to make a random selection of coordinates for the center C(Xc, Yc) of sample plots located within the research plot (100 × 100 m - eqn. 2):
Trees with coordinates xi and yi were counted in the sample plot if they met the following condition (eqn. 3):
Random selection was repeated 200 times for each sample plot area.
The TH of trees in a randomly selected sample plot was calculated by the following four methods ([6], [7]):
- Conventional estimate (CE): TH for a sample plot with area A (ha) was calculated as the arithmetic mean of the height of A×100 thickest trees on the plot; for example, if the area of a plot was 0.04 ha, then the mean was calculated for the four thickest trees; for an area of 0.20 ha, the mean was taken from the 20 thickest trees, and so on.
- Adjusted largest trees (ALT): TH was calculated as the arithmetic mean of (1.6× A×100 - 0.6) thickest trees on the sample plot. As the resulting number of trees was usually a fraction, the calculations were rounded to the nearest two whole numbers and the final result was obtained by means of linear interpolation ([7]).
- U-estimator (UE): TH was calculated as a weighted mean for trees on the sample plot. The weight was defined as the frequency of occurrence of the thickest trees in a subset composed of n/(A×100) trees, where n is the number of trees on the sample plot. As the quotient n/(A×100) was usually a fraction, the calculations were rounded to the nearest two whole numbers and the final result was interpolated, as in the previous method. The calculations were carried out using the algorithm compiled by García & Batho ([7]).
- Sub-plot estimation (SUB): TH was calculated as the arithmetic mean of the height of the thickest trees, selected one from each non-empty 0.01 ha sub-plot; for example, if the area was 0.04 ha, then four trees were taken, one from each 0.01 ha sub-plot. The sample plots were divided into 0.01 ha transects (lanes), whose direction was consistent with the accepted system of rectangular coordinates. In order to reduce the effect of transect orientation on the results of the experiment, the transects were designated alternately in parallel to the y- or x-axis of the coordinate system.
Reineke ([18]) stand density index (SDI) was used to establish stand density for the sample plots (eqn. 4):
where N is the number of stems per 1 ha and Dg is the quadratic mean diameter.
The variation of DBH and H was expressed by variance and the coefficient of variation.
Accuracy of top height estimation for sample plots
The height determined using the SUB method was taken as the actual TH (THact) for the sample plot. Then, differences between the top heights (THcal) determined using the CE, ALT, and UE methods and the actual value were computed for each sample plot (eqn. 5):
The value of systematic error (bias) was determined for the evaluated methods as the arithmetic mean of the deviations observed in subsequent repetitions for particular sample plot sizes (eqn. 6):
Precision was expressed as the standard deviation of the observed errors (eqn. 7):
The null hypothesis that the average values of the observed deviations equaled zero was verified using the t-test at a significance level of α = 0.05.
The calculated indices, characterizing the accuracy of the various methods, were then listed and analyzed by sample plot size.
Accuracy of top height estimation
The TH of each 1 ha research plot (TH1ha) was calculated as the arithmetic mean of the heights of the thickest trees, selected one from each non-empty 0.01 ha (10 × 10 m) sub-plot. This TH was taken as a reference value. Subsequently, TH was estimated based on plots with area (A) of 0.01, 0.02, 0.03, …, 0.25 ha, which were randomly located within a given 1 ha research plot.
Absolute errors for individual estimates, as well as their mean values and standard deviations were calculated as measures of bias and precision.
Empirical error distributions obtained by random selection of various sample plot sizes and the application of four different calculation methods were compared with normal distribution using the Kolmogorov-Smirnov test at α = 0.05. Subsequently, relationships were studied between TH estimation errors and methods, plot sizes, number of trees on the plot, SDI, DBH, and height variability.
Results
Differences between the conventional and sub-plot methods of top height estimation for sample plots
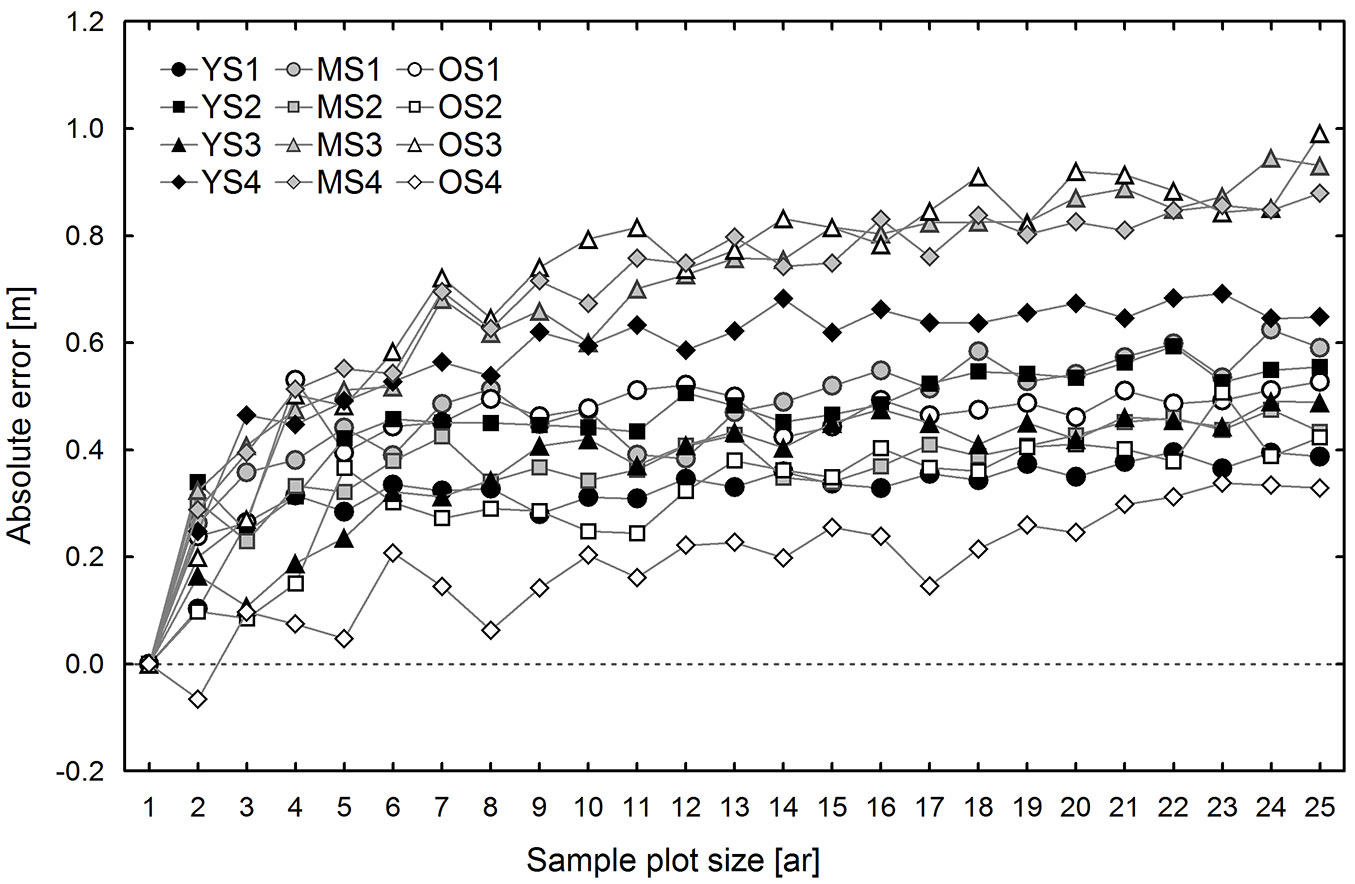
Differences between the conventional (CE) and sub-plot (SUB) methods generally result from different selection of trees used for TH calculation. Therefore, these differences are discussed first, both in terms of DBH and H on all research plots. Fig. 2 shows mean differences between the DBH of the “top height trees” selected according to the CE and SUB methods. In general, the values of observed differences are positive and increase with sample plot size (Fig. 2). An exception was found on one of the 1 ha research plots, which was located in the oldest stand (OS4). The average DBH of the trees selected according to the conventional method was lower than that of the trees selected from non-empty 0.01 ha sub-plots; moreover, these differences did not depend on sample plot size. These differences are attributable to the fact that OS4 had the lowest tree density (139 trees ha-1) among the research plots, and possibly also to the specific spatial distribution of the trees. These two factors may especially affect the number of trees selected for top height estimation using the compared methods. The conventional method, even in areas with low tree density and large irregularity in tree distribution, usually leads to the selection of a higher number of trees, typically equal to the size of the area expressed in ares, while in the case of small density the SUB method usually selects fewer trees as some 0.01 ha sub-plots are empty. This was true for all 1 ha research plots located in the oldest stand, but the effect was the most pronounced on research plot OS4. The mean height determined based on trees selected using the CE method was higher than that estimated by the SUB method (Fig. 3). The differences in mean height increased with sample plot size, ranging from -0.04 to 0.38 m for 0.02 ha sample plots, and from 0.33 to 1.00 m for 0.25 ha sample plots (Fig. 3).
Fig. 2 - Estimated differences (mean bias) in the mean diameters at breast height of trees selected according to the conventional and sub-plot methods, by sample plot size and research plot. (YS): young stand, plot 1-4; (MS): middle-age stand, plot 1-4; (OS): old stand, plot 1-4.
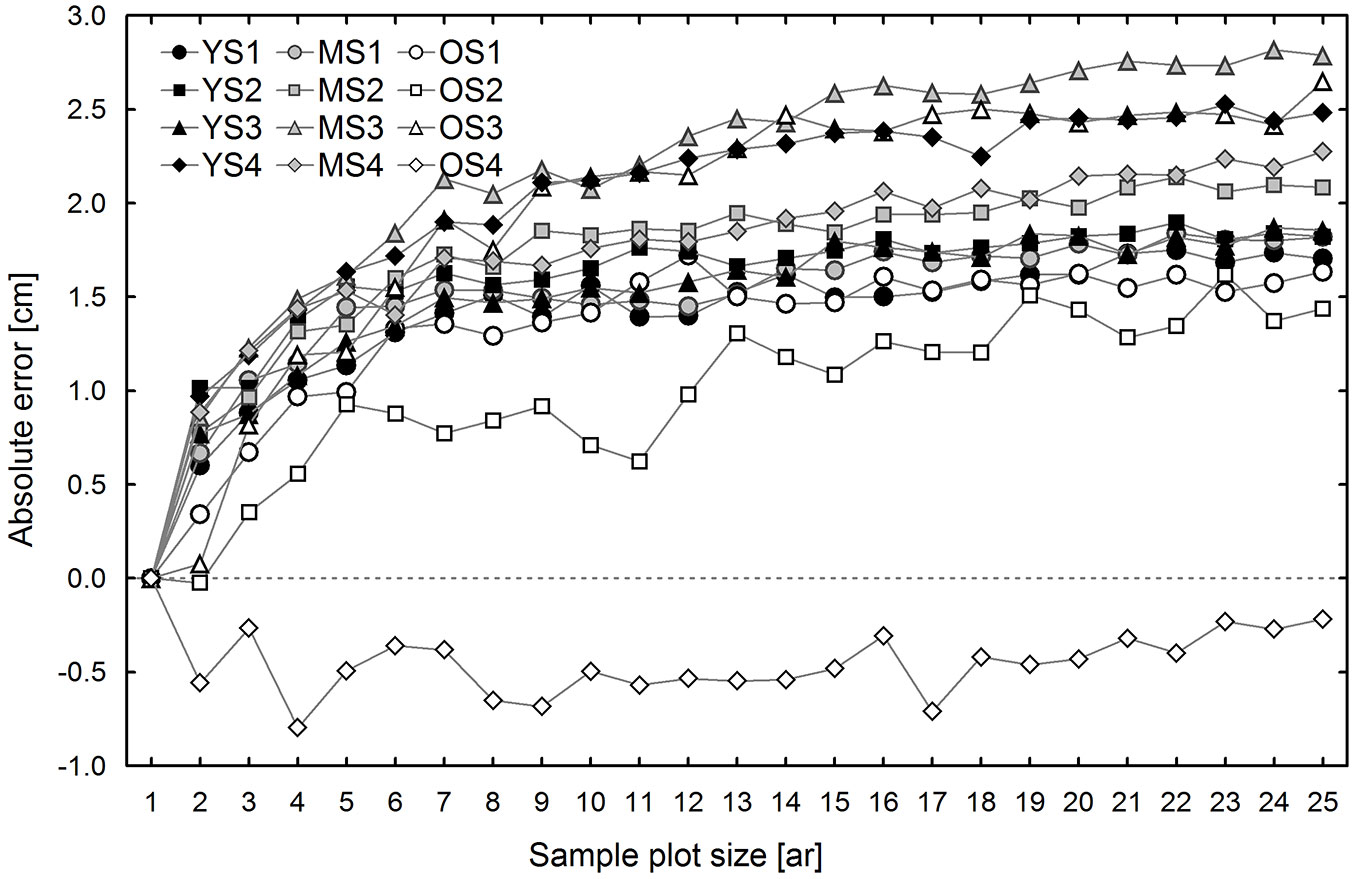
Fig. 3 - Estimated differences (mean bias) in the top heights determined using the conventional and sub-plot methods, by sample plot size and research plot. (YS): young stand, plot 1-4; (MS): middle-age stand, plot 1-4; (OS): old stand, plot 1-4).
The ALT and the UE methods have been developed in order to reduce the errors inherent in the CE method. Fig. 4 shows the estimated average errors (mean bias) of the ALT and UE methods applied in spruce stands as compared to CE errors. In most cases, the ALT and UE top height estimates resulted in some systematic errors, since they significantly differed from the SUB estimates. However, the UE method led to lower absolute error values than those obtained by means of the CE method in all research plots, except for OS2 and OS4. In the case of 0.02-0.04 ha sample plots, the UE method reduced the systematic error on average by 75-80% as compared to the CE method, and by over 80% for larger plots. On research plots OS2 and OS4 the UE method did not produce the desired effect, and for some plot sizes it even increased the systematic error (Fig. 4).
Fig. 4 - Observed effects of plot size on differences between top height estimates made using the CE, ALT, and UE methods and the SUB method in 4 groups of research plots: group 1 (YS: young stand, plot 1-4), group 2 (MS: middle-age stand, plot 1-4), group 3 (OS: old stand, plot 1 and 3), and group 4 (OS: old stand, plot 2 and 4).
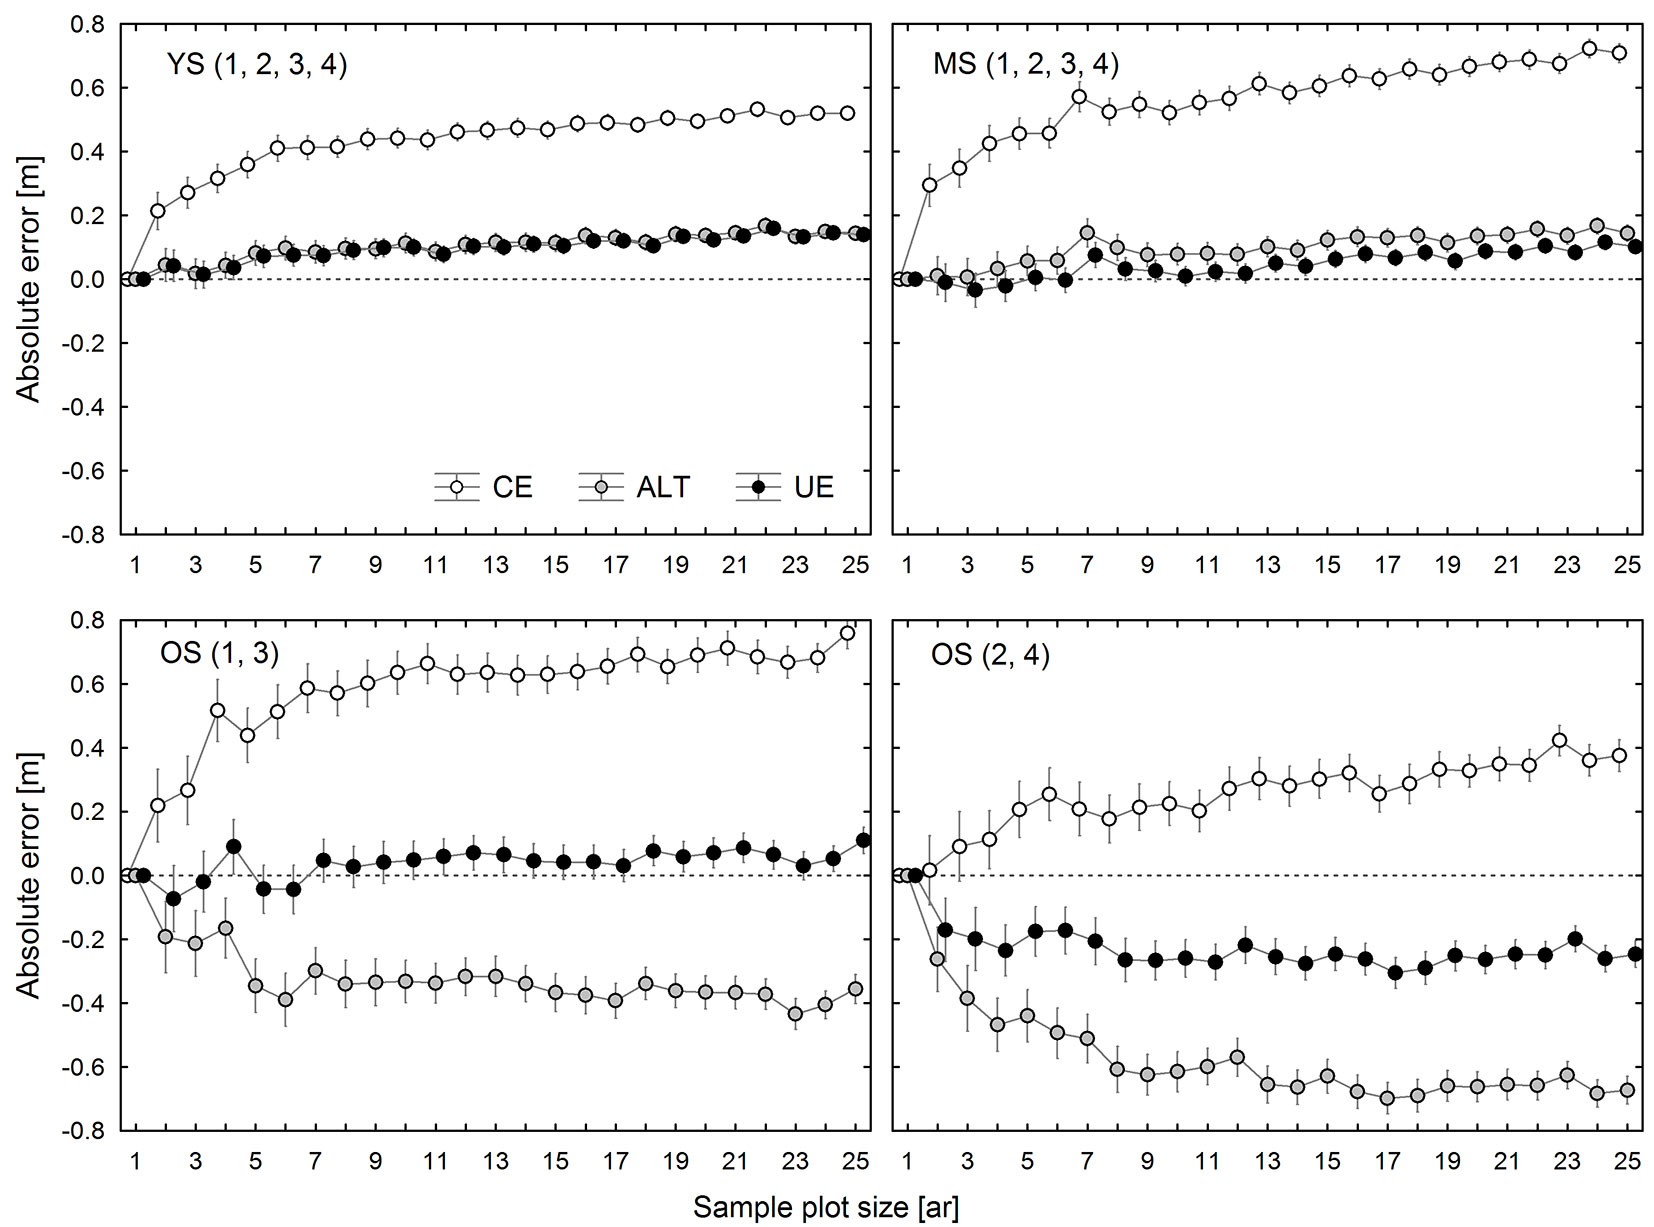
The ALT estimates of TH in two spruce stands (YS and MS) were similar to those obtained by the UE method, although in most cases there were some statistically significant differences between the two. In turn, in the oldest stand (OS), the ALT estimates were considerably lower than the UE ones. Therefore, in the case of the ALT estimates for YS and MS, the reduction in the absolute value of systematic error with respect to the CE method was similar to that of the UE estimates. However, the average ALT error reduction was lower than that achieved by the UE method, the former amounting to 70-75% for 0.02-0.05 ha sample plots and 75-80% for larger plots. The ALT method underestimated TH for all sample plot sizes on the research plots OS1 and OS3, but it was still more accurate than the CE method. While in the case of OS2 and OS4 the ALT method also underestimated TH for all sample plot sizes, the absolute error values were higher than those produced by the CE method (Fig. 4).
Effect of sample plot size and stand density on the accuracy of top height estimation by different methods
TH estimates obtained by the SUB, ALT, UE, and CE methods were compared with the TH1ha calculated for the set of the thickest trees selected one from each 0.01 ha (10 × 10 m) sub-plot. Fig. 5 shows the average bias values for the various stands.
Fig. 5 - Observed effects of plot size and estimation method (CE, ALT, UE, SUB) on top height estimation error in 4 groups of research plots: group 1 (YS: young stand, plot 1-4), group 2 (MS: middle-age stand, plot 1-4), group 3 (OS: old stand, plot 1 and 3), and group 4 (OS: old stand, plot 2 and 4).
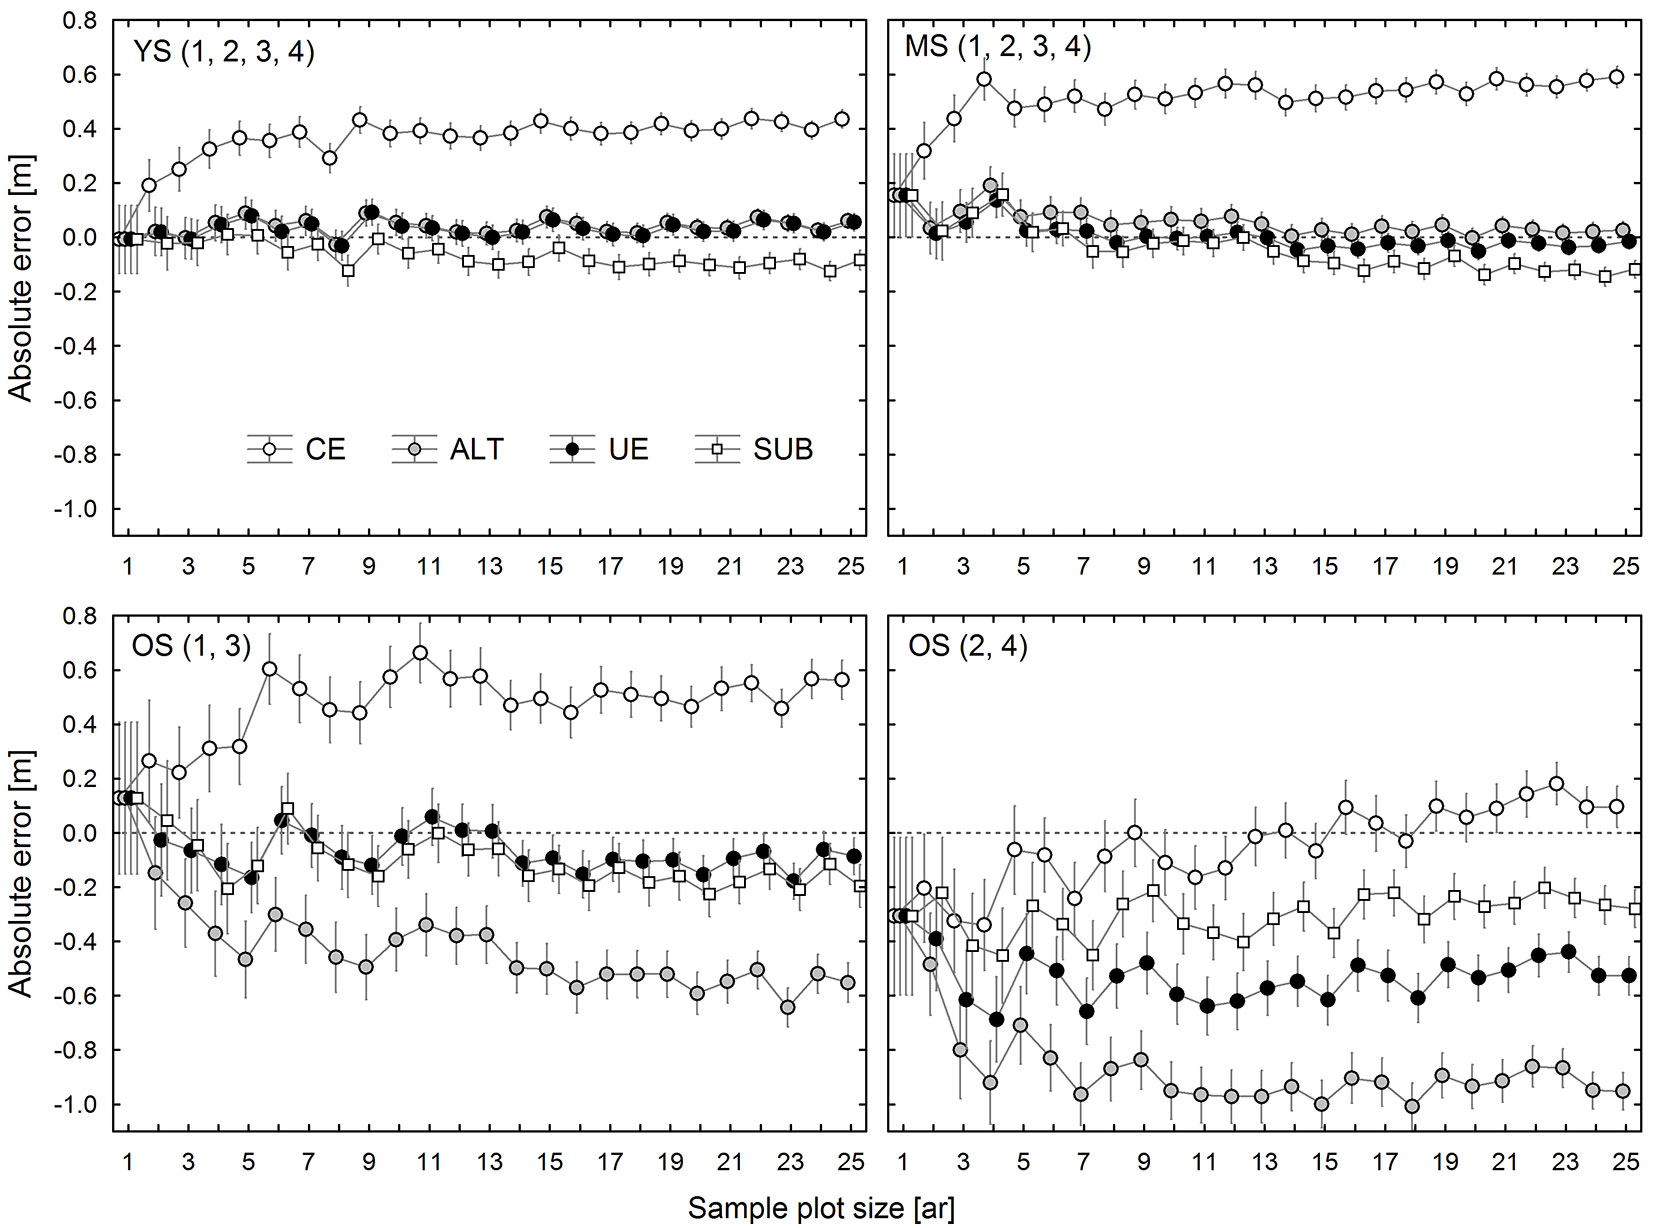
In YS and MS, TH estimates generated by the SUB, ALT, and UE methods, irrespective of sample plot size, were very similar to each other and only slightly differed from TH1ha. Among these methods, the smallest average bias (calculated for all sample plot sizes) was found for the UE method (0.031 m for YS and -0.004 m for MS), followed by ALT (0.040 m for YS and 0.050 m for MS), and SUB (-0.068 m for YS and -0.051 m for MS). The SUB and UE estimates of TH for OS1 and OS3 were similar, while the ALT method provided much lower results. In this case, just as in the younger stands, UE estimation was the most accurate method. In contrast, in OS2 and OS4, TH estimates produced by different methods were highly divergent (Fig. 5). The most accurate figures were obtained using the CE method, which was clearly the worst option for the other research plots.
It should be emphasized that in most cases the UE method yielded not only the least biased, but also the most precise TH estimates. SUB and ALT error variability for all sample plot sizes was on average higher by about 4% and 20%, respectively.
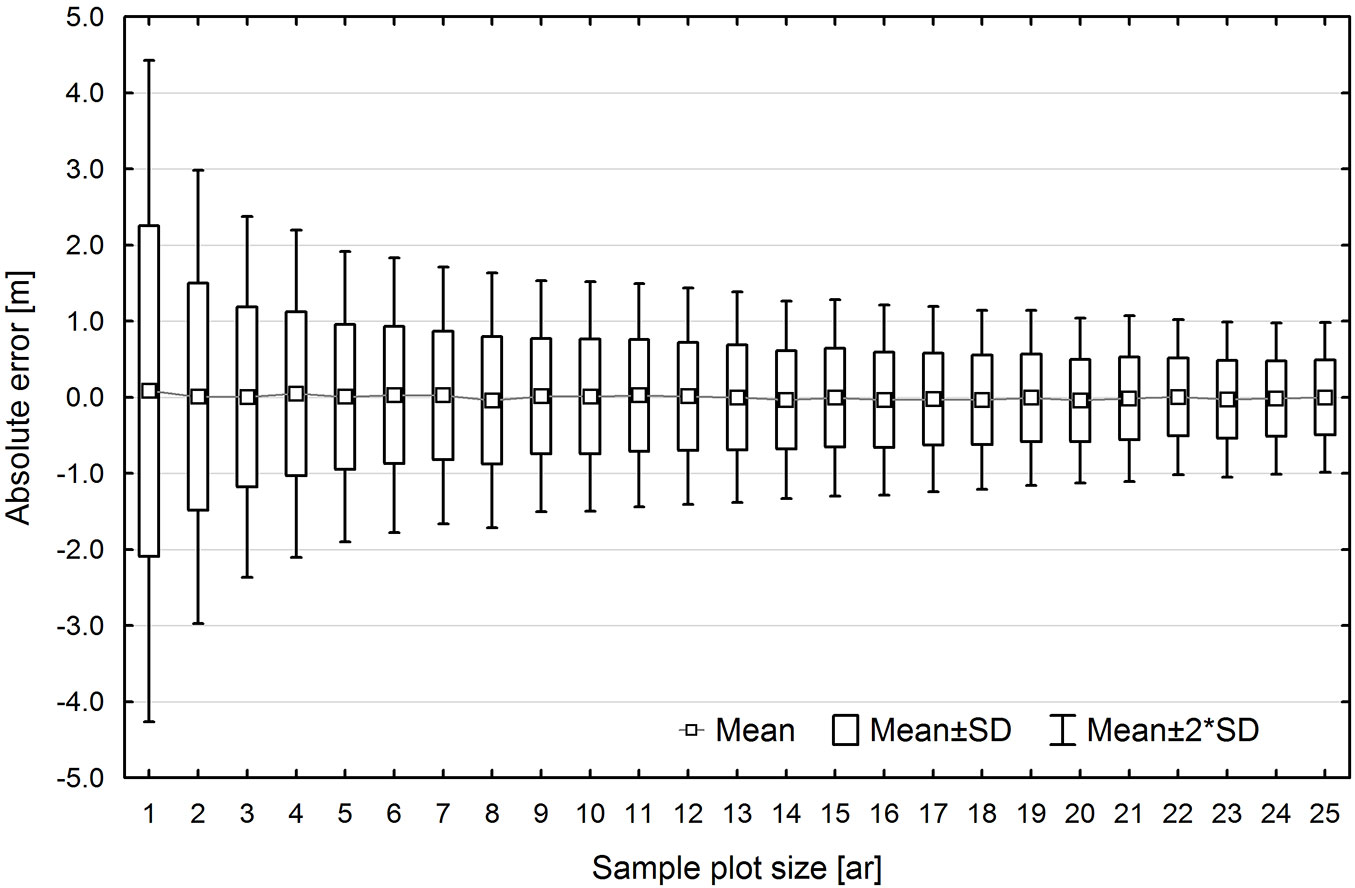
Error variation in TH estimation was found to be correlated with sample plot size. Initially, error variation fell sharply with increasing area, but after reaching a certain cut-off value, increasing plot area no longer caused a corresponding drop in error variation (Fig. 6). For example, in the UE method, the standard error for 0.01 ha sample plots was approx. ±2 m, and approx. ±1 m for 0.04 ha, while a further increase in sample plot size to 0.25 ha resulted in only a gradual and slight decrease in standard error to approx. ±0.6 m.
Fig. 6 - Dispersion of top height estimation errors using UE method, depending on the sample plot size.
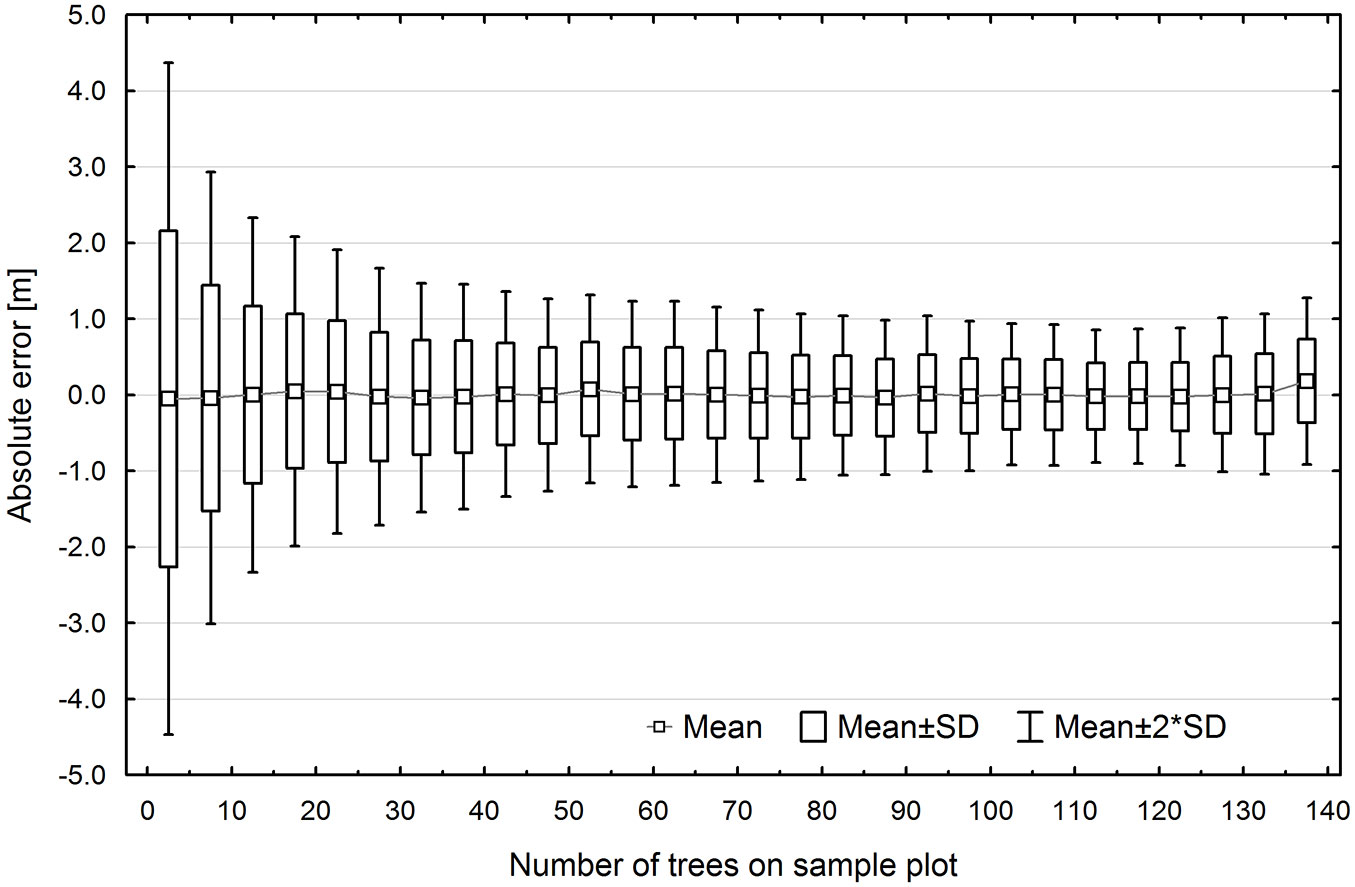
Error variation in TH estimation was also affected by the number of trees on the sample plot (Fig. 7). With a small number of trees (<5), standard error was approx. ±2 m, and then it rapidly decreased reaching ±1 m for an average of 20-25 trees. A further increase in the number of trees did not translate into such a sharp decline in standard error, which dropped to ±0.5 m for approx. 140 trees per plot (Fig. 7).
Fig. 7 - Dispersion of top height estimation errors arising from the UE method, by the number of trees on the sample plot.
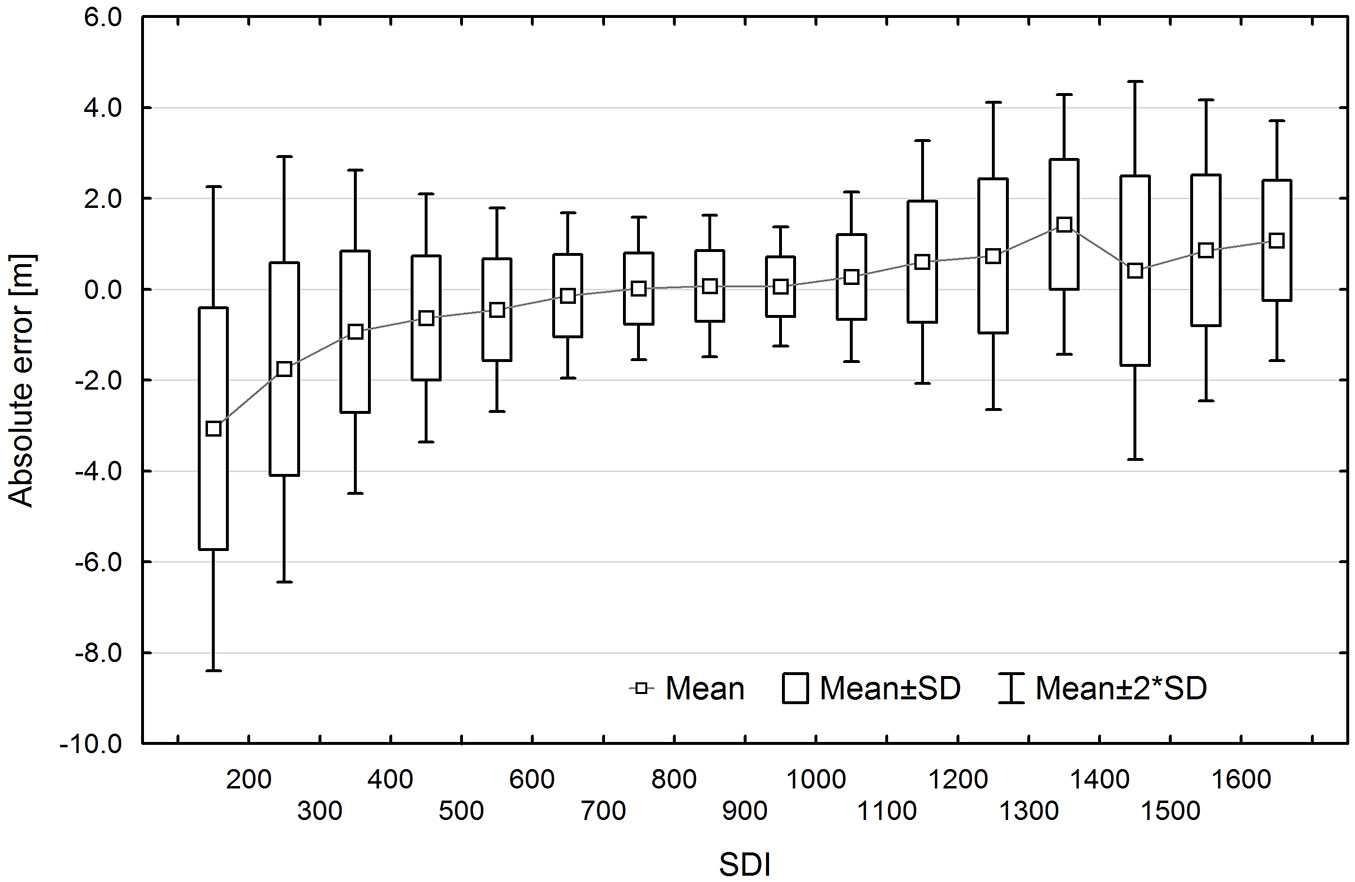
TH estimation errors were correlated with SDI (Fig. 8). In general, TH was underestimated for sample plots with low tree density (for SDI < 600) and overestimated for plots with high density (SDI > 1000). In the case of sample plots with moderate tree density (SDI 600-1000), estimates were unbiased and characterized by the lowest error variability.
Fig. 8 - Top height estimation errors depending on stand density index (SDI) for the UE method.
Discussion
The conventional method of estimating TH based on 100 thickest trees per 1 ha has the fundamental disadvantage of being sensitive to sample plot size ([19], [11], [7]). Indeed, in this study the CE estimates increased with plot area and were higher than the SUB measurements by 0.3-1.0 m in the case of the largest sample plots (0.25 ha). Disadvantages of the conventional approach to TH estimation have been discussed in some previous studies concerning different trees species. Fries ([5]), who used a sample plot size of 0.10 ha, reported errors of 0.47 m and 0.82 m for pine and spruce stands, respectively. Similar systematic errors (0.68 m and 0.81 m) were found by Magnussen ([11]) for Douglas fir stands with rather small sample plots (0.03 ha and 0.05 ha). In contrast to the above results, relatively low errors were obtained by García ([6]) on eucalyptus and Douglas fir plantations: 0.15 m and 0.20 m for Douglas fir measured on 0.04 and 0.16 ha plots, respectively, and 0.29 m for eucalyptus measured on 0.10 ha. Similarly, low systematic errors were reported by García & Batho ([7]) for lodgepole pine stands (0.12 m and 0.26 m for plot sizes of 0.04 ha and 0.08 ha).
The ALT and UE methods proposed by García ([6]) for TH estimation enable a significant reduction in the systematic errors arising from the CE method. In the analyzed spruce stands, estimation bias was diminished by over 80% for the UE method and 75% for the ALT method, for most sample plot sizes. Similar results were obtained by García & Batho ([7]) for lodgepole pine stands, where the systematic error obtained using 0.08 ha sample plots decreased by 76% and 72% for the UE and ALT methods, respectively, and by approx. 86% for both methods when 0.04 ha plots were used. In this study, the general rule described above did not hold for the 120 year old stand (OS), and especially for two research plots (OS2 and OS4) with a density of 159 trees ha-1 and 139 trees ha-1. On those research plots, both UE and ALT estimates exhibited higher systematic errors than the CE results. This is due to the low density of trees and therefore different intensities of tree selection (percentage of “top height trees” selected on the sample plot) by these methods ([21]). In the ALT method, the number of trees to be used for TH estimation is calculated according to the formula 1.6×(A×100) -0.6. Hence, if tree density on a sample plot is lower or equal to those values, the set of “top height trees” comprises of all trees on the sample plot. In OS, the average percentage of sample plots for which TH was calculated based on all trees was 47% (ranging from 37% to 57%, depending on the size of the sample plot). In contrast, in the younger stands, all trees were included only on 0.2% of sample plots. In the UE method, if the tree density equal to or less than one tree per 0.01 ha, all trees were assigned a weight of 1, and, similarly to the ALT method, the final result of TH estimation was the mean height of all trees on the plot. In the UE method, the mean percentage of plots on which tree density was ≤1 per 0.01 ha was 36% and ranged from 29% to 40%, depending on sample plot size. In the younger stands, the corresponding percentage was only 0.2%. At low tree density, and also duo to specific tree distribution, the SUB method resulted in many empty sub-plots, thus limiting the set of “top height trees”. Generally, SUB estimates based on a lower number of trees were higher than ALT and UE estimates, in which TH was calculated based on a larger number of trees. In the oldest tree stand, and especially on the research plots OS2 and OS4, the share of empty 0.01 ha sub-plots was the highest.
Previous studies examining the influence of sample plot size on TH estimation were usually based on data from small sample plots (less than 0.2 ha), established within a grid of permanent sample plots ([5], [20], [6], [11], [7]). In contrast, our study was performed on 1 ha research plots, which made it possible to analyze the effect of internal stand variability on the magnitude and variation of estimation errors. Magnussen ([11]) noted that it would be necessary to identify an optimum size of sample plots defined as the smallest area for which height estimates provide a sufficiently accurate measure of stand productivity, but at the same time large enough to avoid the adverse effects of micro-site variability and local density. In the present study, analysis of the relationship between standard error and sample plot size showed that the optimum sample plot size (in terms of accuracy and labor-intensity) ranged from 0.05 to 0.10 ha. Analogously, the effect of number of trees per plot on standard error indicated that optimum plots should contain 20-40 trees. Similar optimum sample plot sizes were also reported for basal area estimation by Bruchwald ([1]) and Ochal ([14]), for pine and beech stands.
The accuracy of TH estimation was also influenced by the local density of trees. Unbiased height estimates of the studied spruce stands were obtained at SDI of 600 to 1000. Lower or higher density values resulted in biased TH estimates.
Three issues are important when assessing site productivity based on stand height: sample plot size, definition of “top height trees”, and the method of selecting those trees. As far as sample plot size is concerned, the most important aspect is to select the best method of TH estimation, which would ensure consistent results regardless of plot area. The widely used conventional approach in which TH is calculated for 100 thickest trees per hectare without taking into account their spatial distribution is not sufficiently precise and leads to divergent results depending on sample plot size. Since TH is typically employed to estimate site productivity, its determination as the mean height of the thickest trees in the stand, selected one from each 0.01 ha sub-plot, appears to be the most reliable solution as those trees are representative of the site conditions over the entire area of the stand. An additional argument for this solution is the spatial diversification of micro-site conditions generally observed in forest ecosystems ([15], [16]). Finally, it has been found to produce reliable TH estimates using sample plots as well as with the application of the ALT method or, better still, the UE method.
Conclusions
The accuracy of TH estimates in the studied Norway spruce stands largely depended on the estimation method, sample plot size, and stand density. In all the methods analyzed (SUB, CE, ALT, and UE), TH estimates were influenced by sample plot size, with the strongest and weakest effects observed for CE and UE, respectively. Estimation results were also significantly affected by stand density. In the young- and medium-aged stands, characterized by relatively high tree density, the best results were obtained using the U-estimator and the adjusted largest trees method, while conventional estimation generally overstated TH. However, both the UE and ALT methods produced questionable TH results with a negative bias in stands with low tree density. Those two methods were found suitable for stands with tree density larger than approx. 160 per ha.
TH estimation precision was dependent on plot size. Initially, error variation fell rapidly with increasing plot area, but only up to a certain cut-off point. This suggests that an optimum sample plot size with relatively high accuracy can be obtained at reasonable labor intensity. In the analyzed stands, that size was determined to be approx. 0.05-0.10 ha in terms of area and 20-40 in terms of number of trees, as revealed by analysis of standard errors in TH estimation.
TH estimation errors were also linked to low and very high levels of local stand density. In general, relatively small errors were observed for SDI ranging from 600 to 1000. Given the fact that both forestry research and practice often employ variable sample plot sizes, the commonly accepted conventional approach should be verified in light of the results presented herein. Its uncritical application on plots of different sizes may lead to inaccurate results, and consequently to false conclusions concerning site productivity and other characteristics calculated with TH. Top height can be best determined using the UE method, which is not sensitive to sample plot size. UE estimates of TH are most reliable and recommend for forest site productivity measurement.
Acknowledgements
This paper was written as part of research project BZ/ZBiPL/14-17 “Actual and potential site productivity for main forest forming tree species in Poland” and statutory research (DS-3418/ZBiPL/15) carried out at the Department of Biometry and Forest Productivity, University of Agriculture in Krakow, Poland.
References
Gscholar
Gscholar
Gscholar
Gscholar
Gscholar
Gscholar
Gscholar
Authors’ Info
Authors’ Affiliation
Jaroslaw Socha
Marcin Pierzchalski
Department of Biometry and Forest Productivity, University of Agriculture in Cracow, Al. 29-Listopada 46, 31-425 Cracow (Poland)
Corresponding author
Paper Info
Citation
Ochal W, Socha J, Pierzchalski M (2017). The effect of the calculation method, plot size, and stand density on the accuracy of top height estimation in Norway spruce stands. iForest 10: 498-505. - doi: 10.3832/ifor2108-010
Academic Editor
Davide Travaglini
Paper history
Received: May 09, 2016
Accepted: Jan 24, 2017
First online: Apr 12, 2017
Publication Date: Apr 30, 2017
Publication Time: 2.60 months
Copyright Information
© SISEF - The Italian Society of Silviculture and Forest Ecology 2017
Open Access
This article is distributed under the terms of the Creative Commons Attribution-Non Commercial 4.0 International (https://creativecommons.org/licenses/by-nc/4.0/), which permits unrestricted use, distribution, and reproduction in any medium, provided you give appropriate credit to the original author(s) and the source, provide a link to the Creative Commons license, and indicate if changes were made.

Web Metrics
Breakdown by View Type
Article Usage
Total Article Views: 48495
(from publication date up to now)
Breakdown by View Type
HTML Page Views: 40896
Abstract Page Views: 2974
PDF Downloads: 3482
Citation/Reference Downloads: 25
XML Downloads: 1118
Web Metrics
Days since publication: 3227
Overall contacts: 48495
Avg. contacts per week: 105.20
Article Citations
Article citations are based on data periodically collected from the Clarivate Web of Science web site
(last update: Mar 2025)
Total number of cites (since 2017): 16
Average cites per year: 1.78
Publication Metrics
by Dimensions ©
Articles citing this article
List of the papers citing this article based on CrossRef Cited-by.
Related Contents
iForest Similar Articles
Research Articles
Assessment of age bias in site index equations
vol. 9, pp. 402-408 (online: 11 January 2016)
Review Papers
Integration of forest mapping and inventory to support forest management
vol. 3, pp. 59-64 (online: 17 May 2010)
Research Articles
Estimating the accuracy of smartphone app-based removal estimates against actual wood-harvesting data from clear cuttings
vol. 17, pp. 140-147 (online: 14 May 2024)
Commentaries & Perspectives
Benefits of a strategic national forest inventory to science and society: the USDA Forest Service Forest Inventory and Analysis program
vol. 1, pp. 81-85 (online: 28 February 2008)
Research Articles
Comparing land use registry and sample based inventory to estimate forest area in Podlaskie, Poland
vol. 10, pp. 315-321 (online: 23 February 2017)
Research Articles
Using self-organizing maps in the visualization and analysis of forest inventory
vol. 5, pp. 216-223 (online: 02 October 2012)
Research Articles
Site quality assessment of degraded Quercus frainetto stands in central Greece
vol. 8, pp. 53-58 (online: 12 May 2014)
Research Articles
Relationship between environmental parameters and Pinus sylvestris L. site index in forest plantations in northern Spain acidic plateau
vol. 9, pp. 394-401 (online: 16 January 2016)
Research Articles
Simplified methods to inventory the current annual increment of forest standing volume
vol. 5, pp. 276-282 (online: 17 December 2012)
Technical Advances
Improved estimates of per-plot basal area from angle count inventories
vol. 7, pp. 178-185 (online: 17 February 2014)
iForest Database Search
Search By Author
Search By Keyword
Google Scholar Search
Citing Articles
Search By Author
Search By Keywords
PubMed Search
Search By Author
Search By Keyword


