Bird response to forest structure and composition and implications for sustainable mountain forest management
iForest - Biogeosciences and Forestry, Volume 19, Issue 1, Pages 18-27 (2026)
doi: https://doi.org/10.3832/ifor4921-018
Published: Jan 11, 2026 - Copyright © 2026 SISEF
Research Articles
Abstract
Assessing how bird richness across ecological guilds of mountain-breeding birds responds to changes in forest attributes may inform the development of sustainable management strategies. In this study, we surveyed forest structure and bird communities across 148 sampling units in France and Italy to identify threshold values for stand variables that influence bird species richness. The sampling covered an altitudinal range from 805 to 1555 m a.s.l. and was mainly dominated by mountain beech and Alpine coniferous forests. We modelled species richness of overall bird communities and individual ecological guilds in response to structural and compositional attributes and topographic variables using generalized modelling. Bird species richness was negatively associated with stand-level total tree density. However, higher silver fir density was associated with greater species richness across most bird guilds, which preferred mixed woods and heterogeneous stand structure. An increase in deadwood volume had a significant positive effect on all guilds, confirming the importance of old-growth forest features for forest birds. Threshold values indicating a shift in species richness of bird guilds were identified only for some stand structural attributes (i.e., total basal area and deadwood volume). Our results suggest that the conservation of biodiversity in forest bird communities may benefit from management strategies that maintain mixed, relatively open canopies and promote deadwood retention to ensure the availability of associated habitats. Our approach lays the groundwork for further research, applying this methodology to additional variables and biodiversity metrics.
Keywords
Forest Biodiversity, Deadwood, Biodiversity Indicators, Woodland Birds, Forest Structure, Forest Composition, Bird Guilds
Introduction
European forests are multiple-use socio-ecosystems in which economic, social, and ecological goals are pursued within the same area. Integrative forest management accounts for biodiversity conservation alongside timber production and can lead to more resilient and productive habitats, with multiple long-term benefits ([26]).
A thorough understanding of biodiversity patterns in space and time could effectively drive a shift in forest management toward greater sustainability. However, for this process to occur, it is essential to reframe current indicators ([31]). Indeed, decision-makers in the forest sector have often been constrained by contradictory and confusing information about the state of forest biodiversity and its response to management ([31], [3]).
Forests provide sites for reproduction, roosting, and foraging, as well as cover for local and long-distance movements for many wildlife species and assemblages ([12]). Forest habitat conditions are therefore potentially related to the distribution and abundance of many animal species and populations ([12]). Forest stands have thus been used as a reference scale for collecting biodiversity data across taxa, which are differentially correlated with forest features and, consequently, with management practices. Birds respond to forest composition and structure, and the importance of forest structural attributes to birds has been thoroughly analyzed ([12], [45]), also with the aim of testing this taxon as an indicator of overall biodiversity ([29]). The analysis of links between bird species and forest habitats can benefit from classifying bird species into ecological guilds based on habitat use and species ecology, such as trophic level, ecological characteristics, specialization level, migration strategy, and elusiveness ([49]). The rationale for using bird ecological guilds instead of individual species is that species with similar ecological traits are expected to exhibit more consistent responses to changes in forest variables. Indeed, Korlan et al. ([35]) demonstrated that guild structures in forest bird assemblages largely reflect the similarities and differences in forest structure and the distribution and abundance of foraging resources. This approach can highlight differential responses among species guilds and enable a mechanistic understanding of the underlying links, thereby supporting conservation strategies. Additionally, when bird species show strong dependency on forest structure and conditions, they can be considered forest specialists ([45]) and, as is often the case, promoted as forest biodiversity indicators ([29]).
In general, forest structure encompasses a range of components, including tree height and diameter, canopy structure, deadwood abundance, shrub-layer cover, and gap fraction ([24]). Birds are highly influenced by the assemblage of these components. In particular, vertical and horizontal habitat structure affect the composition, abundance, density, and stability of bird communities ([24]). Bird communities thrive in structurally diverse woodland habitats, such as old, near-natural forests ([9]). Recently, forest specialist bird species have shown marked declines, especially those dependent on old-growth, structurally heterogeneous forests with large amounts of deadwood ([30], [47]). Based on this evidence, both production and biodiversity conservation would benefit from a quantitative assessment of the links among forest structure, tree species composition, and bird communities ([8], [15], [20]).
Our study examines how forest structure, tree species composition, and topographic context influence patterns of species richness across bird ecological guilds. We aim at: (i) identifying the forest stand attributes that support forest bird communities most effectively; and (ii) analyzing these links across ecological guilds. Given that ecological responses often exhibit nonlinear patterns, we also investigate whether changes in species richness occur around specific thresholds in forest attributes, or rather at values along the gradient of such attributes at which the effect on species richness changes markedly. We hypothesize that structure-related forest attributes exert a stronger influence (both positive and negative) than other attributes (i.e., tree species composition and topography) on bird species richness and that this influence varies across ecological guilds.
Materials and methods
Survey sites and plot selection
Our database merges several datasets collected for different research projects that sampled both forest structure and birds at the plot level ([13]). From this database, we selected 148 plots having information on forest structure and bird species data, located in mountain forests (elevation >800 m a.s.l., up to a maximum of 1555 m a.s.l.) across Italy (72 plots) and France (76 plots). Plot locations range from southern Italy, through the central Apennines and eastern Alps, to northeastern France, encompassing the French Alps, Massif Central, and Vosges Mountains (Fig. 1). Further plot-level details are provided in Tab. S1 (Supplementary material).
Fig. 1 - Distribution of the survey plots in France and Italy. Forest cover is indicated in green (from the “High Resolution Layer: Forest Type (FTY) 2018” of the EEA Copernicus Land Monitoring Service - https://land.copernicus.eu/pan-european/high-resolution-layers/forests/forest-type-1/status-maps/forest-type-2018). Dots represent the sites, with their size proportional to the number of survey plots per site.
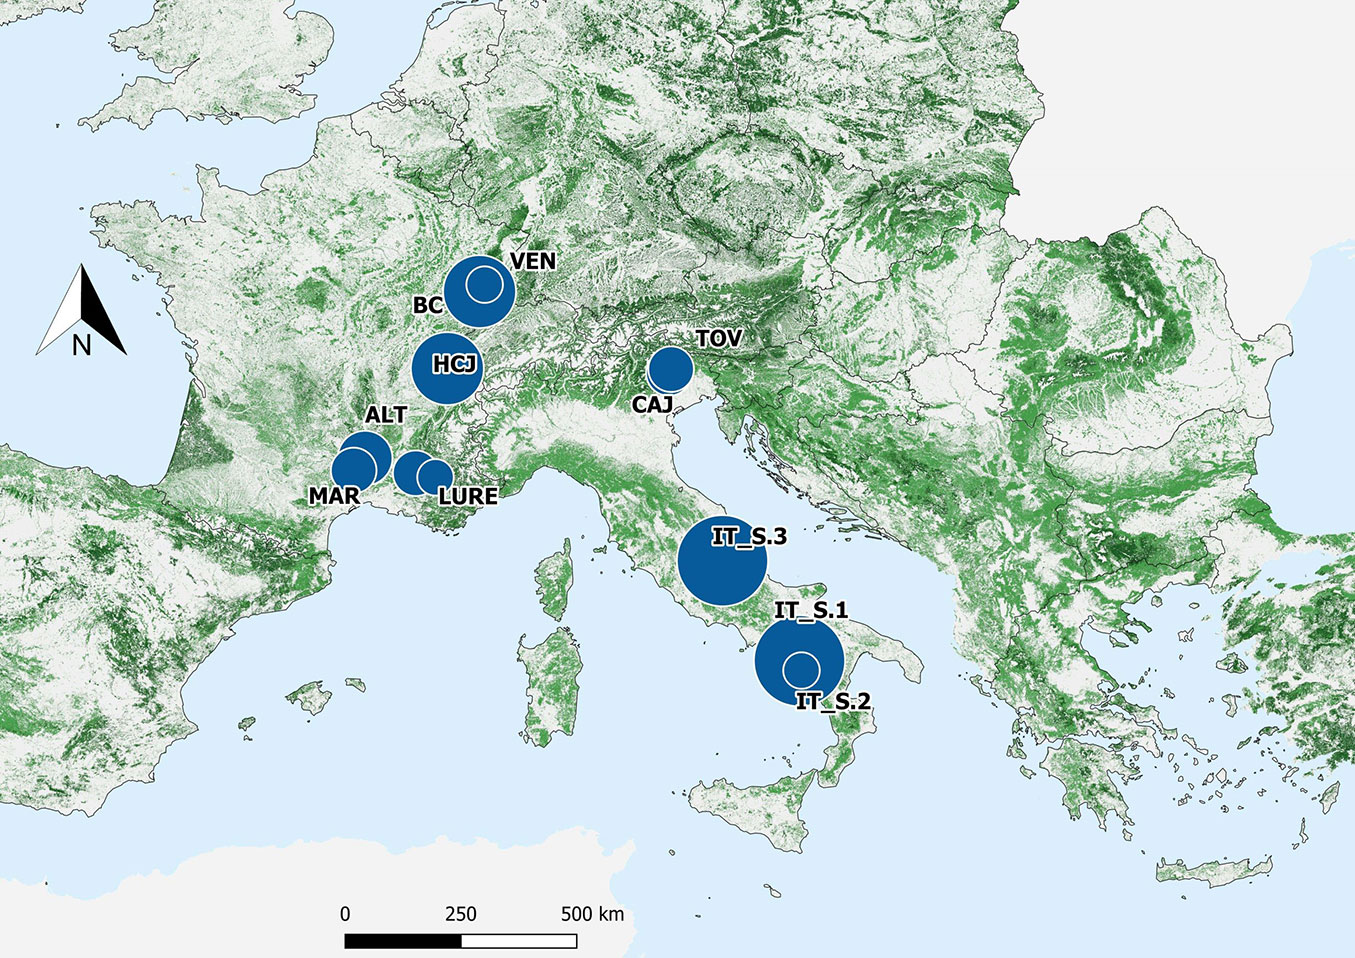
Survey plots were distributed across forest stands classified as mountainous beech (~67%, 96 plots), Alpine coniferous (~33%, 49 plots), and thermophilous deciduous forests (~0.2%, 3 plots). Most plots included habitats of conservation concern according to the European Habitats Directive (Directive 92/43/EEC). Forest types range from mesophytic deciduous forests, beech, and montane beech forests to thermophilous deciduous forests and silver fir woodlands on calcareous substrates. Most data were collected in forests dominated (90 plots) or co-dominated (6 plots) by European beech (Fagus sylvatica L., totaling 96 plots). Several sites were co-dominated (7 plots) or dominated by conifers (45 plots), particularly silver fir (Abies alba Mill., with 42 plots dominated by the species) and Norway spruce (Picea abies [L.] H. Karst., with 3 plots dominated by the species). The sampled forests varied structurally, comprising one-layer (~36%), two-layer (~5%), and multi-layer (~59%) stands. Management histories included coppice, shelterwood, and selection systems; 34% of plots were located in forests that had not been managed for at least 20 years.
For each plot, we extracted elevation and aspect from numerical surface models as synthetic topographic variables.
Despite some differences in sampling protocols across research projects (see the following subsections and Appendix 1 in Supplementary material), our database adds value because, unlike most breeding bird surveys, it links forest structure and bird data at the plot scale, enabling sensitive analyses of these relationships ([8]). All data were reported at the sample unit level to allow consistent comparisons across study areas. We also tested whether sampling effort influenced sample coverage by comparing coverage estimates across sampling intensities and plot sizes. No consistent differences were observed across sampling protocols, so we excluded sampling effort as a source of bias (Appendix 1).
Data collection and variable selection
Bird surveys
In each plot, all birds seen or heard were recorded using point counts during the breeding season ([28]). Survey duration ranged from 5 minutes (France) to 10 or 20 minutes (Italy). Plots in southern Italy were surveyed once in May, whereas others (in France and Northern Italy) were surveyed twice per year (typically before and after May 15th), ensuring comparable sampling effort across sites. Differences in survey protocols were accounted for in the statistical analyses (Appendix 1 in Supplementary material). Birds of prey and owls (Strigiformes), which accounted for <1% of all observations, were excluded because they are poorly detectable by point-count methods ([28]). We calculated total species richness and species richness within ecological guilds as the number of species observed per plot across all surveys. Since preliminary analyses revealed a high correlation between bird abundance and richness (Spearman’s correlations between species richness and abundance ranged from 0.74 to 0.97, depending on guild), we used species richness as a standard biodiversity index, assuming similar patterns of abundance.
Bird species were grouped into three guild types based on ecological characteristics: (i) forest habitat preference (generalists vs. specialists); (ii) foraging type (aerial, canopy, understory, ground foragers); and (iii) nesting type (canopy, understory, ground, cavity nesters). Additionally, we considered a guild encompassing the entire bird assemblage, or rather the set of species occurring in the same community ([21]). Species with flexible ecological traits were assigned to multiple guilds within a given category (habitat preference, foraging, or nesting type - see Tab. S4 and Tab. S5 in Supplementary material). Classification followed an a priori approach, using information from Mikusinski et al. ([40]).
Forest structure and tree species richness
Forest structural attributes were derived from measurements of living and dead trees within plots of varying size (Tab. S3, Fig. S1 in Supplementary material). Across all datasets, only trees with a diameter at breast height (DBH) ≥ 7.5 cm were included, and values were standardized to per-hectare units.
We considered total deadwood volume (m3 ha-1), and volumes of its components (m3 ha-1): logs, snags (height >1.3 m), and stumps (height <1.3 m). We calculated both average basal area (m2 ha-1) and tree density (n ha-1) for all living trees, as well as separately for the main species - beech, fir, and spruce. In addition, we considered tree species richness, expressed as the total number of species per plot. These metrics are commonly used in forest management and are part of the pan-European indicators of sustainable forest management ([23]).
Statistical analyses
We modelled bird species richness (overall and by ecological guild) as a function of forest structural attributes (basal area, tree density, number of tree species, and deadwood volume) and topographic variables (elevation and slope), using generalized modelling in R v. 3.5.2 ([46]).
As richness is count data, we initially used a Poisson error distribution with a log link. Still, we observed underdispersion (variance-to-mean ratio < 1 across guilds), which indicated a risk of type I error. Dispersion was assessed using both mean-variance ratios and the function “dispersiontest” from the “AER” package ([34]). All guild-level response variables displayed underdispersion (variance-to-mean ratio = 0.53-0.92), further supported by significant results of the formal dispersion test for several guilds. Therefore, we applied a generalized Poisson distribution with log link, which accommodates both over- and underdispersed data ([4], [16]). To account for differences in survey effort, we added an offset equal to the total survey time (individual survey multiplied by the number of visits to the same survey plot). This approach was preferred over individual-based standardization because we found no effect of sampling effort on coverage (Tab. S3 and Fig. S1 in Supplementary material). Although the sampling design was nested, we did not include site random effects to account for this source of variability because the generalized Poisson distribution model already adjusts for variance, and adding both generalized Poisson error and site random effects yielded inconsistent variance estimates. The sampled forests shared relatively similar ecological conditions - or rather mature montane forests within a comparable elevation belt - and were distributed across latitudinal and longitudinal gradients with balanced plot numbers per site. Thus, we prioritized a coherent variance estimate and correction for underdispersion over the inclusion of a random effect.
Model selection was based on an ascending Akaike Information Criterion corrected for small samples (AICc). We first fitted single-variable models for each explanatory variable. We then constructed multivariable models by adding predictors sequentially using a forward stepwise approach. Selection stopped when AICc improvement was <2 points, or when seven variables had been included to avoid overfitting ([58], [57]). This procedure identifies the most parsimonious model explaining species richness, which was our response variable. At each round of variable selection, we checked for correlations among explanatory variables and excluded variables with Spearman’s correlation coefficients > 0.7 from the same model ([58]). All explanatory variables were scaled to improve model convergence and facilitate comparability of magnitudes. Models were fitted using the “glmmTMB” function in the “glmmTMB” R package ([10]). AICc model comparisons were performed with the “AICcmodavg” package ([38]).
Threshold values in forest explanatory variables were subsequently identified in the best model to detect potential discontinuities in the relationship trajectories between the response variable (bird species richness) and the selected independent variables (structural attributes). This analysis was conducted using the “chngptm” function of the “chgpt” package ([22]). Threshold detection followed the method of Fong et al. ([22]). This technique allows the detection of a change in the regression coefficient beyond which further changes do not affect bird species richness. Each model was fitted using the Poisson error distribution, since the generalized Poisson error distribution was not available in this package. We also used the “segmented” threshold model type, as it most closely corresponded to our approach (continuous explanatory variables and the slope of the relationship that can vary along the explanatory variable gradient).
Results
A total of 56 bird species were recorded across the study sites (Tab. S4 in Supplementary material). Mean bird species richness per plot was 11.2 ± 4.52 (mean ± standard deviation), ranging from 3 to 23 species. The most observed species were the common chaffinch (Fringilla coelebs L.), European robin (Erithacus rubecula L.), coal tit (Periparus ater L.), blackbird (Turdus merula L.), wren (Troglodytes troglodytes L.), and song thrush (Turdus philomelos B.). Rare species recorded as singletons included goldfinch (Carduelis carduelis L.), greenfinch (Chloris chloris L.), ring ouzel (Turdus torquatus L.), Cetti’s warbler (Cettia cetti T.), and common quail (Coturnix coturnix L.). The number of plots in which each species was recorded is reported in Tab. S4. Total bird species richness decreased with increasing total basal area but increased in response to higher silver fir density and greater volumes of deadwood. Among the ecological guilds, significant responses were most often detected in relation to total basal area (9 out of 11 guilds), silver fir density (9 out of 11 guilds), and total deadwood volume (7 out of 11 guilds) (Tab. 1, Fig. 2).
Tab. 1 - Results of the generalized linear mixed models fitted with a generalized Poisson error distribution. We used the Akaike Information Criterion corrected for small samples (AICc) to select the best model. Species richness (SR) was modelled for the total bird community and the following ecological guilds: forest generalists, forest specialists, canopy foragers, aerial foragers, ground foragers, understory foragers, canopy nesters, understory nesters, ground nesters, and cavity nesters. Standard errors are reported in parentheses. (***): p < 0.001; (**): p < 0.01; (*): p < 0.05
| Group | Response | Intercept | Elevation | Interaction: elevation-logs volume |
Total basal area |
Spruce basal area |
Total tree density |
Silver fir density |
Interaction: silver fir density- total basal area |
Spruce density |
Tree species richness |
Logs volume |
Snags volume |
Total deadwood |
|---|---|---|---|---|---|---|---|---|---|---|---|---|---|---|
| - | Bird total SR | 0.09 (0.042) * |
-0.284 (0.041) *** |
- | -0.194 (0.039) *** |
- | - | 0.18 (0.04) *** |
0.051 (0.022) * |
- | - | - | - | 0.142 (0.036) *** |
| Specialisation level |
Forest generalists SR | -1.436 (0.062) *** |
-0.187 (0.064) ** |
- | -0.175 (0.058) ** |
- | - | 0.223 (0.058) *** |
- | - | - | - | - | 0.171 (0.055) ** |
| Forest specialists SR | -1.437 (0.061) *** |
-0.253 (0.066) *** |
- | -0.164 (0.056) ** |
- | - | 0.225 (0.057) *** |
- | - | -0.169 (0.067) * |
- | - | 0.203 (0.057) *** |
|
| Foraging habits | Canopy foragers SR | -0.086 (0.044) * |
-0.296 (0.044) *** |
- | -0.157 (0.038) *** |
- | - | 0.202 (0.04) *** |
- | - | - | - | - | 0.135 (0.038) *** |
| Aerial foragers SR | -2.471 (0.103) *** |
-0.356 (0.102) *** |
- | - | - | - | - | - | -0.535 (0.214) * |
-0.266 (0.113) * |
- | 0.273 (0.096) ** |
- | |
| Ground foragers SR | -0.061 (0.045) ns |
-0.309 (0.045) *** |
- | -0.166 (0.039) *** |
- | - | 0.197 (0.041) *** |
- | - | - | - | - | 0.143 (0.039) *** |
|
| Understory foragers SR | -0.07 (0.043) |
-0.299 (0.043) *** |
- | -0.173 (0.038) *** |
- | - | 0.211 (0.039) *** |
- | - | - | - | - | 0.149 (0.037) *** |
|
| Nesting habits | Canopy nesters SR | -1.01 (0.056) *** |
-0.275 (0.056) *** |
- | -0.138 (0.049) ** |
- | - | 0.264 (0.048) *** |
- | - | - | 0.148 (0.05) ** |
- | - |
| Understory nesters SR | -1.427 (0.058) *** |
-0.341 (0.058) *** |
- | -0.22 (0.055) *** |
- | - | 0.191 (0.057) ** |
- | - | - | - | - | 0.168 (0.052) * |
|
| Ground nesters SR | -2.262 (0.084) *** |
-0.424 (0.079) *** |
0.142 (0.067) * |
- | -0.187 (0.089) * |
-0.468 (0.104) *** |
- | - | - | - | 0.338 (0.07) *** |
- | - | |
| Cavity nesters SR | -1.072 (0.056) *** |
-0.338 (0.061) *** |
- | -0.128 (0.049) ** |
- | - | 0.146 (0.054) ** |
- | - | -0.224 (0.061) *** |
- | 0.181 (0.05) *** |
- |
Fig. 2 - Relationships between bird species richness and key forest variables. Relationships between total bird assemblage species richness (left: a, c, e, g) and that of forest generalists and specialists (right: b, d, f, h) with the variables to which most of the ecological bird guilds responded significantly: elevation (a, b), total basal area (c, d), silver fir density (e, f), and total deadwood volume (g, h). Only responses of three guilds are shown for clarity, as trend lines overlapped across guilds. Lines represent GLMs with Poisson error distribution; shaded areas indicate 95% confidence intervals. Note: graphics are illustrative, complementary visualizations of the overall relationships, rather than as direct representations of the model coefficients reported in Tab. 1.
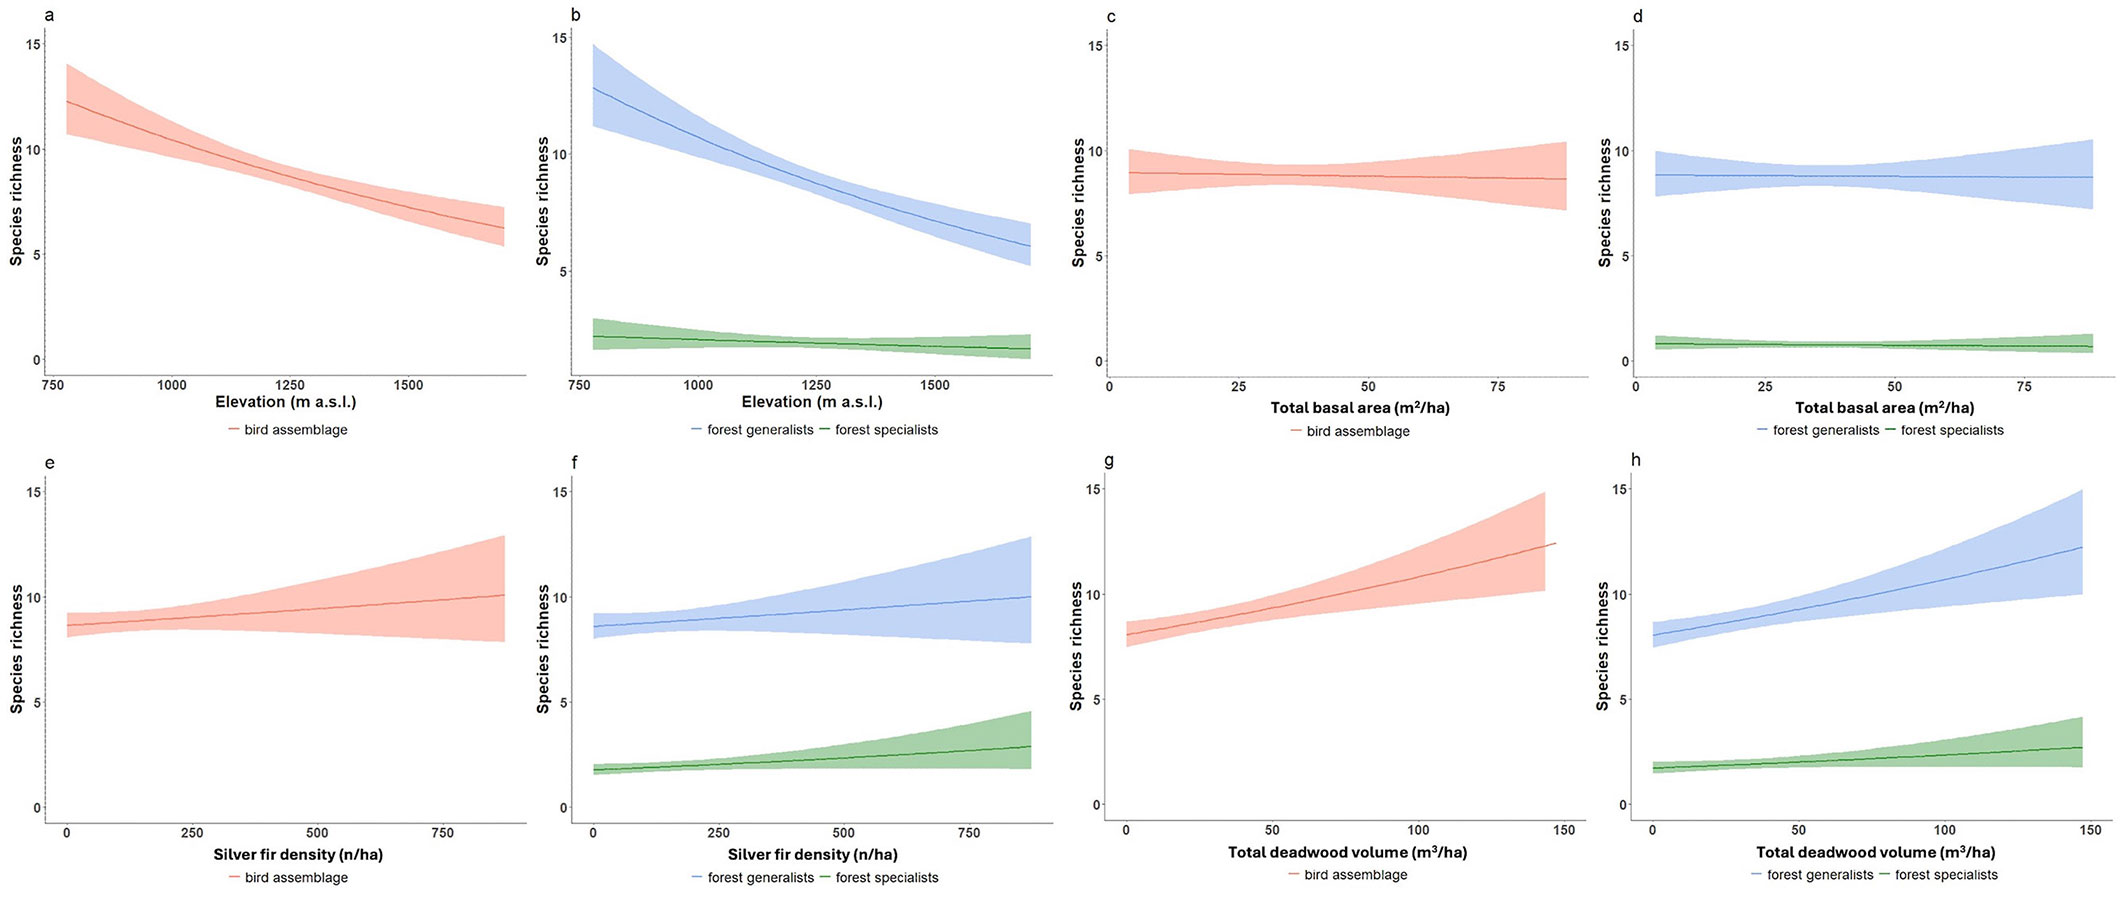
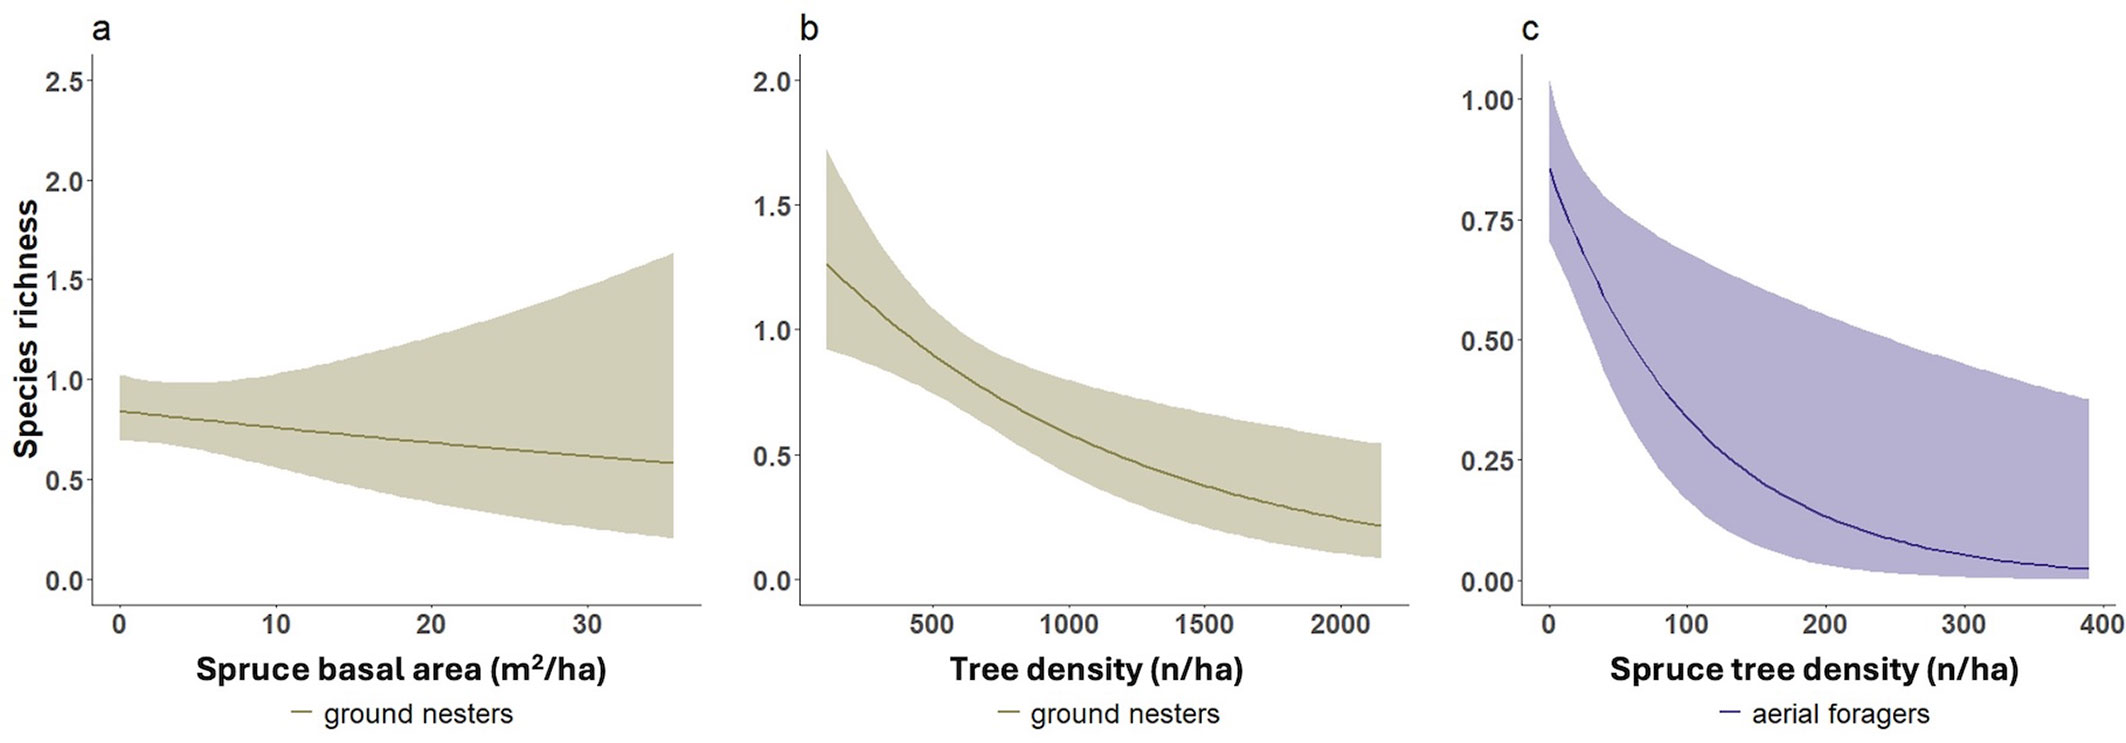
Among the topographic variables, only elevation significantly affected species richness across all ecological guilds, with a generally negative effect (Tab. 1); species richness decreased with increasing elevation. Nearly all ecological guilds (except aerial foragers and ground nesters) showed significantly decreasing species richness with increasing basal area. In contrast, ground nesters were negatively influenced by increasing values of spruce basal area and total tree density (Fig. 3a, Fig. 3b). These responses were substantial: an increase in spruce basal area from 0 to 17 m2 ha-1 was associated with a mean decrease of ~38% (-0.4 species) in the number of ground-nesting species per plot. In comparison, an increase in total tree density from 0 to 634 trees ha-1 led to a ~54% decrease (-1 species). Aerial foragers also strongly responded to spruce tree density, with a ~98% decline in species richness, from 0 to 390 trees ha-1 (maximum observed value - Fig. 3c). All other guilds exhibited significantly positive relationships with silver fir density (Tab. 1).
Fig. 3 - Guild-specific exceptions to forest structure effects on bird richness. Exceptions to general trends: relationships between ground nesters and (a) spruce basal area (m2 ha-1); (b) total tree density (N ha-1); and (c) between aerial foragers and spruce tree density (N/ha). Lines represent GLMs with Poisson error distribution; shaded areas indicate 95% confidence intervals. Graphics are illustrative only (see end of caption of Fig. 2).
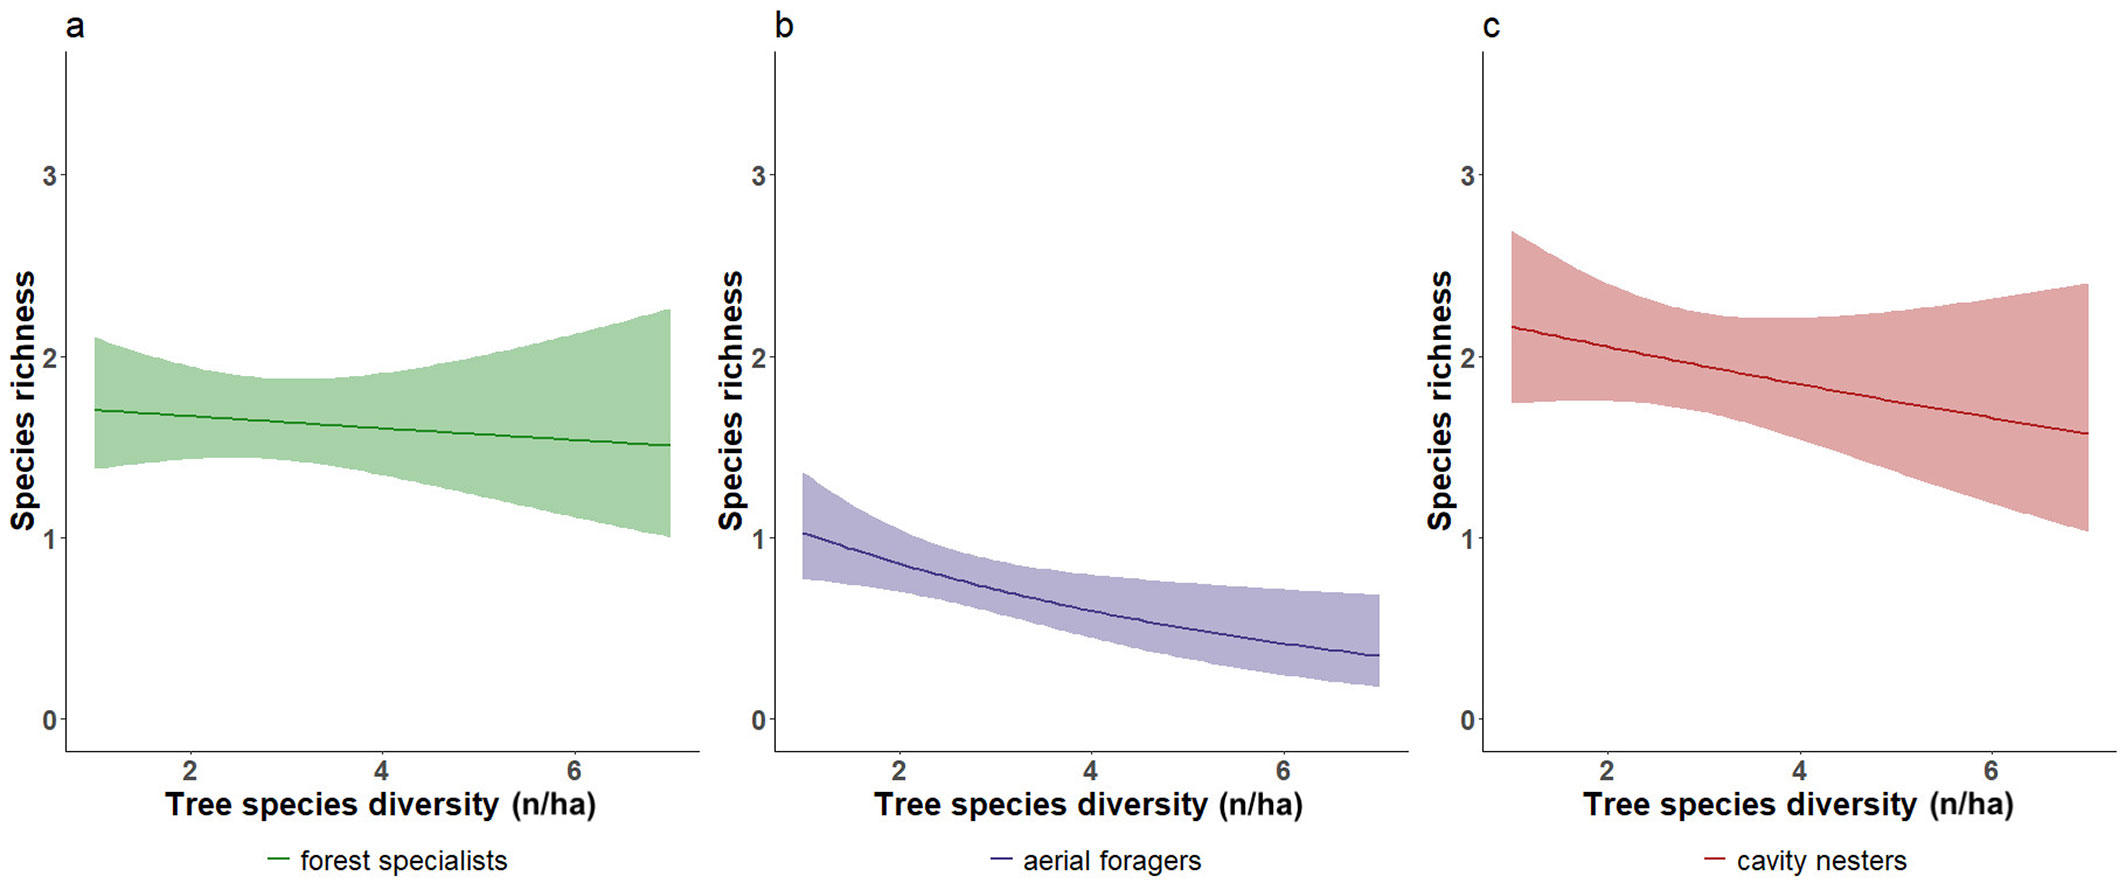
Unexpectedly, forest specialists (Fig. 4a), aerial foragers (Fig. 4b), and cavity nesters (Fig. 4c) showed significant declines in species richness with increasing tree species richness. Increasing from 0 to 3 tree species led to richness reductions of -37% for cavity nesters, -29% for forest specialists (-0.8 species), and -71% for aerial foragers (-0.5 species).
Fig. 4 - Negative effects of tree species richness on selected bird guilds. Negative effect of tree species richness on (a) forest specialists, (b) aerial foragers, and (c) cavity nesters. Lines represent GLMs with Poisson error distribution; shaded areas indicate 95% confidence intervals. Graphics are illustrative only (see end of caption of Fig. 2).
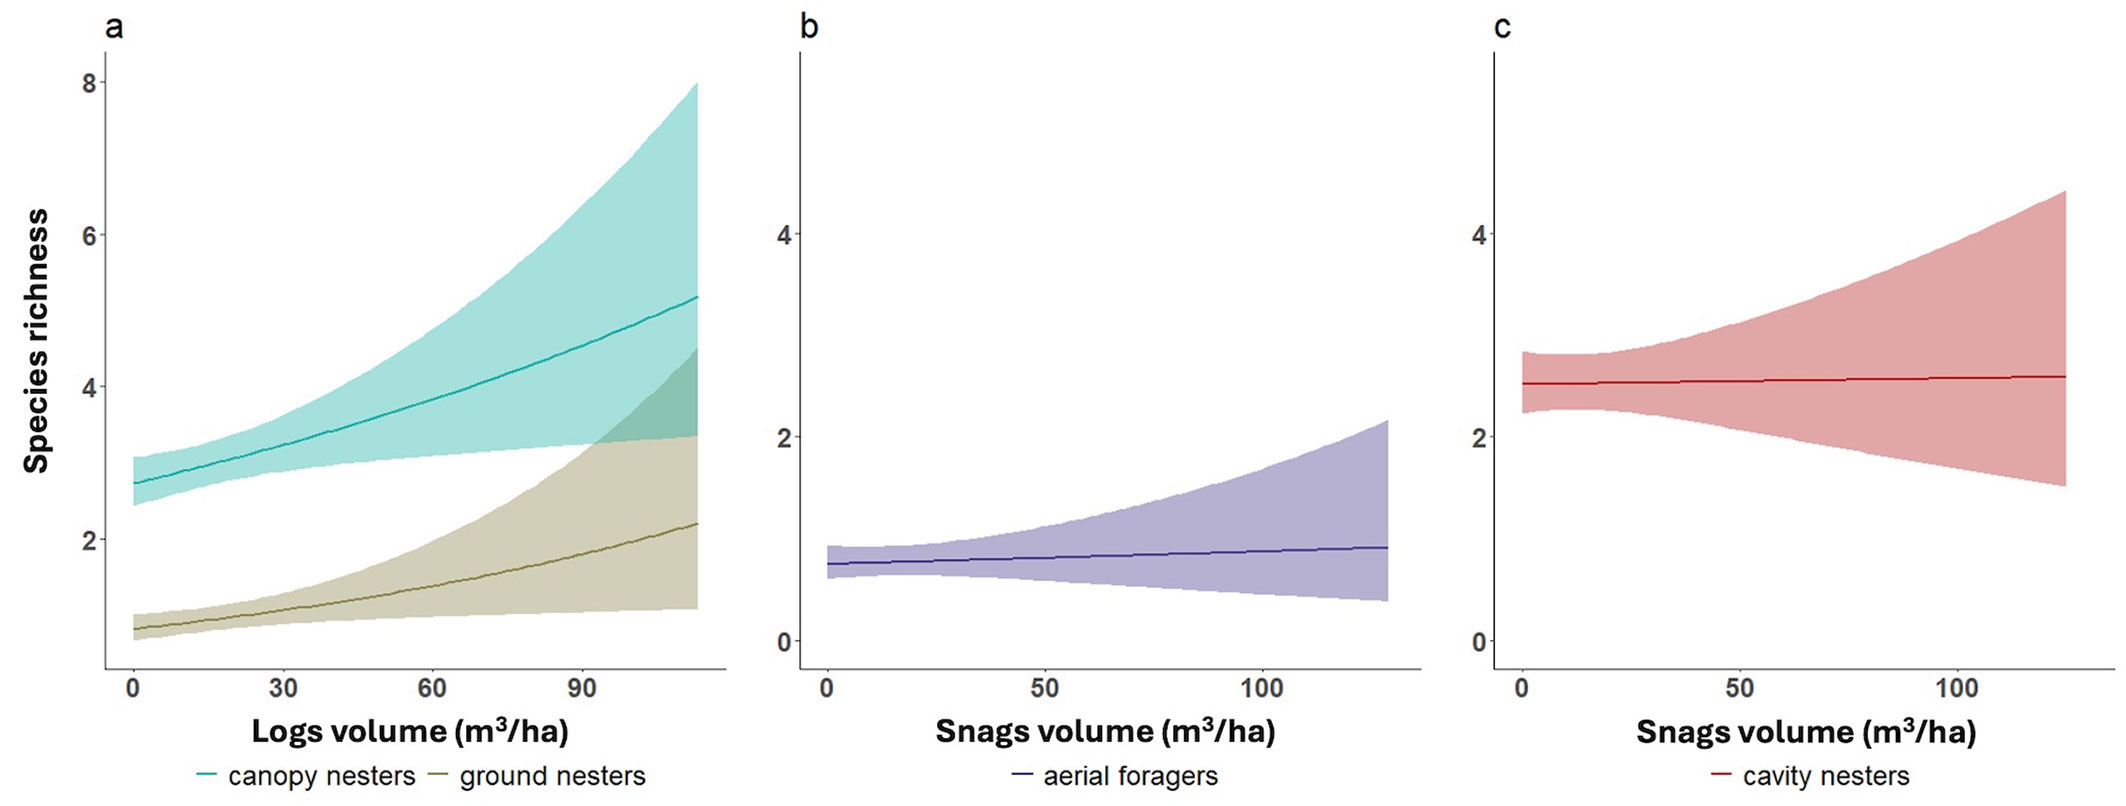
Most ecological guilds showed significant increases in species richness with total deadwood volume. However, ground and canopy nesters responded more specifically to log volume, while aerial foragers and cavity nesters responded to snag volume (Fig. 5). For an increase of 13 m3 ha-1 in logs (corresponding to the mean value of logs volume in our sample), the species richness of ground nesters increased by ~25% (+0.2 species), and that of canopy nesters by ~11% (+0.3 species). An increase of 13.5 m3 ha-1 in snag volume led to a 14% increase in aerial foragers (+0.8 species) and 9% in cavity nesters (+0.1 species) species richness.
Fig. 5 - Positive responses of bird guilds to deadwood components. Guild-specific responses to deadwood components: positive relationships between (a) log volume and richness of canopy and ground nesters, and snag volume and richness of aerial foragers (b) and cavity nesters (c). Lines represent GLMs with Poisson error; shaded areas represent 95% confidence intervals. Graphics are illustrative only (see end of caption of Fig. 2).
Significant thresholds were found mainly for two structural variables: (i) total deadwood volume was significant for total bird community richness, forest generalists, canopy foragers, and ground foragers (Tab. 2). A threshold at 17.8 m3 ha-1 (except the value of 0.2 m3 ha-1 for canopy foragers) marked a shift: below this value, richness increased with deadwood volume; above it, the effect was null or negative. (ii) Total basal area of living trees showed thresholds (~39 m2 ha-1 with very few variations) for forest generalists, forest specialists, canopy foragers, understory foragers, and cavity nesters. The pattern was the inverse of that for deadwood: the slope declined more strongly below the threshold.
Tab. 2 - Results of the continuous two-phase regression model applied to the selected explanatory variables. Models were fitted using a Poisson error distribution and the “segmented” threshold type implemented in the chngptm function of the chngpt R package ([22]). The “change of slope” column reports the change in the slope at the estimated threshold changepoint. The adjacent columns indicate the lower and upper bounds of the 95% confidence intervals for both the threshold and slope change estimates.
| Response | Explanatory | Threshold | Lower CI |
Upper CI |
Slope change |
Lower CI |
Upper CI |
P value |
|---|---|---|---|---|---|---|---|---|
| Bird assemblage SR | Total deadwood | 17.8 | 17.3 | 18.3 | -0.010 | -0.01 | -0.009 | <0.001 |
| Elevation | 1027.0 | 608.0 | 1446.0 | -0.001 | -0.004 | 0.003 | 0.681 | |
| Total basal area | 38.9 | 23.2 | 54.7 | -0.008 | -0.026 | 0.009 | 0.334 | |
| Forest generalists SR | Total deadwood | 17.8 | 5.3 | 30.3 | -0.009 | -0.015 | -0.003 | 0.002 |
| Elevation | 1027.0 | 600.0 | 1454.0 | -0.001 | -0.004 | 0.002 | 0.727 | |
| Total basal area | 38.9 | 38.1 | 39.8 | -0.009 | -0.013 | -0.005 | <0.001 | |
| Forest specialists SR | Total deadwood | 5.4 | 1.2 | 9.6 | 0.067 | -0.478 | 0.612 | 0.810 |
| Elevation | 1265.0 | 1060.0 | 1470.0 | -0.002 | -0.004 | 0.001 | 0.198 | |
| Total basal area | 40.4 | 39.8 | 41.1 | -0.033 | -0.036 | -0.03 | <0.001 | |
| Aerial foragers SR | Elevation | 1056.0 | 1042.0 | 1070.0 | -0.005 | -0.008 | -0.002 | 0.001 |
| Canopy foragers SR | Total deadwood | 0.2 | -0.1 | 0.5 | 0.809 | 0.304 | 1.313 | 0.002 |
| Elevation | 1027.0 | 600.0 | 1454.0 | -0.001 | -0.004 | 0.003 | 0.767 | |
| Total basal area | 40.4 | 39.8 | 41.1 | -0.007 | -0.009 | -0.005 | <0.001 | |
| Understory foragers SR | Total deadwood | 14.0 | 0.3 | 27.8 | -0.011 | -0.491 | 0.47 | 0.965 |
| Elevation | 1000.0 | 546.0 | 1454.0 | -0.001 | -0.004 | 0.003 | 0.690 | |
| Total basal area | 39.1 | 38.9 | 39.3 | -0.007 | -0.008 | -0.006 | <0.001 | |
| Ground foragers SR | Total deadwood | 17.8 | 10.7 | 24.9 | -0.012 | -0.018 | -0.006 | <0.001 |
| Elevation | 1014.0 | 574.0 | 1454.0 | 0.000 | -0.003 | 0.002 | 0.731 | |
| Total basal area | 39.1 | 19.6 | 58.6 | -0.006 | -0.041 | 0.03 | 0.760 | |
| Cavity nesters SR | Elevation | 1334.0 | 1214.0 | 1454.0 | -0.001 | -0.007 | 0.004 | 0.669 |
| Total basal area | 40.7 | 31.7 | 49.7 | -0.015 | -0.024 | -0.006 | 0.001 | |
| Canopy nesters SR | Elevation | 1462.0 | 1060.0 | 1864.0 | -0.002 | -0.002 | -0.001 | <0.001 |
| Total basal area | 37.5 | 19.6 | 55.4 | -0.013 | -0.071 | 0.045 | 0.661 | |
| Understory nesters SR | Elevation | 1228.0 | 1002.0 | 1454.0 | 0.000 | -0.003 | 0.004 | 0.808 |
| Total basal area | 41.8 | 20.2 | 63.5 | -0.010 | -0.062 | 0.043 | 0.720 | |
| Ground nesters SR | Total tree density | 1244.7 | 879.5 | 1609.8 | 0.001 | -0.001 | 0.003 | 0.375 |
| Elevation | 1385.0 | 1316.0 | 1454.0 | 0.003 | 0.002 | 0.004 | <0.001 |
Only ground nesters exhibited a threshold for total tree density (1245 trees ha-1). Thresholds related to elevation were found for aerial foragers, canopy nesters, and ground nesters. All other tested variables were either not significant or yielded non-convergent models, particularly those involving living spruce or fir basal area.
Discussion
We assessed the relative importance of topographic variables and forest structural attributes on bird species richness. Among the former, elevation was the only variable that significantly affected all the bird guilds analyzed. Among structural attributes, most guilds showed increased species richness with greater volumes of deadwood and higher densities of silver fir, whereas basal area had a generally negative effect. Some guilds exhibited distinct responses to specific structural or compositional forest variables.
Regarding threshold values, some structural attributes showed consistent effects across guilds, providing potentially valuable information for forest management.
Elevation
As expected, species richness declined with increasing elevation across all ecological guilds ([24], [39]). High-elevation forests typically offer fewer ecological niches due to lower net primary productivity, a consequent reduction in trophic complexity, and harsher climatic conditions ([24]). Nevertheless, alpine forest ecosystems host specialized bird communities ([42]), which are increasingly threatened by land-use changes and the climate crisis ([14]). However, several environmental drivers - particularly vegetation structure - change concurrently with elevation ([53]). In our case, the negative effect of elevation on species richness was inverted by higher volumes of logs for ground-nesting birds, which may exploit coarse woody debris and log piles as suitable breeding substrates, which are attributes likely associated with longer harvesting rotations or reduced deadwood removal ([17]).
Living trees
We found that increasing basal area negatively affected species richness in most bird guilds. This effect appeared weak below ~40 m2 ha-1 but became stronger above that value. Notably, the observed threshold was slightly above the mean basal area in our dataset (35.7 m2 ha-1), and its confidence interval included the threshold. In general, bird species richness tends to increase with forest stand age and tree size ([2]). However, very dense stands - common during intermediate successional stages dominated by biomass accumulation processes - often exhibit very closed canopies ([25]) that support a limited number of bird species ([41], [27]). Given that similar basal area values may reflect structurally distinct stand types (e.g., dense coppices vs. open high forests with large trees), additional structural variables should be examined to confirm this pattern.
Ground-nesters, a group showing marked declines in European forests ([30]), were negatively affected by increasing spruce basal area. Although these species require canopy cover for nesting ([32]), dense spruce stands generate microclimatic and edaphic conditions that may limit biodiversity. These include low light intensity, colder air and soil temperatures, high acidity, and reduced nutrient availability, all of which suppress understory vegetation and associated spatial niches and trophic resources, with consequences on ground-dwelling wildlife ([51], [32], [1], [42]).
Spruce density also negatively affected aerial foragers, likely because they rely on more open canopy structures or the presence of broadleaved species ([50]). Conversely, our results confirmed that a greater proportion of silver fir in broadleaved-dominated forests supports higher avian richness ([27], [41], [52]).
Although silver fir and spruce are both conifers, they may differ in their ecological effects. Spruce-dominated stands typically exhibit dense, shaded canopies, limited understory development, colder microclimates, and reduced trophic resources ([33]). Silver fir, by contrast, is more frequently associated with mixed stands containing broadleaves, which generally promote greater structural heterogeneity and more favorable conditions for foraging and nesting ([7]). Our results should therefore be interpreted in light of the characteristics of the sampled stands. The plots where spruce occurred (30 plots) were often, and in many cases entirely, dominated by conifers. In such stands, an increase in spruce density is likely to lead to greater canopy closure and, consequently, reduced light availability at the forest floor, along with harsher microclimatic conditions ([33]). Conversely, in most plots where silver fir was present (67 out of 97), fir was the only conifer species recorded, and the overall conifer share represented less than half of the total basal area represented by beech. In these stands, an increase in fir density thus corresponds to an increase in species mixture, with potential positive effects on forest structure, resource availability, and habitat diversity ([54]). Mixed forests typically offer more heterogeneous stands with a greater array of features than pure stands, enhancing both foraging and nesting opportunities ([32], [24], [5], [56]).
Interestingly, we observed a negative effect of tree species richness on forest specialists, aerial foragers, and cavity nesters. This finding may relate to increased predation risk, as more diverse stands are often associated with higher density of mammalian predators ([5]). These may particularly affect cavity-nesting birds, which are frequently targeted by mammalian predators ([56]). Forest specialists, as well as those species having specific habitat requirements (i.e., presence of cavities, structure of canopy layers), may have strict preferences for specific tree species; therefore, increasing tree species richness could reduce the relative availability of these preferred species ([41], [24], [27]). In the sampled forest stands, most of which were dominated by beech, an increase in tree species richness is associated with a higher proportion of conifers. This typically entails denser mid-storey or upper-canopy layers, reducing open flight space and visibility, both of which are essential for aerial foragers ([50]). Moreover, as noted by Birčák & Reif ([6]), if increased tree-species heterogeneity is not accompanied by a parallel enhancement of trophic resources capable of supporting larger numbers of individuals, a corresponding enrichment of the local bird community is unlikely to occur. According to Hobson & Bayne ([32]), the benefits of an increased tree species richness may depend on which species dominate the stand; added diversity may either enhance or reduce niche availability. Consistent with previous studies ([27]), our results confirm that tree species richness exerts a weaker influence on bird communities than forest structure overall ([24]).
Deadwood
Species richness in all bird guilds was positively associated with increased deadwood volume or specific deadwood components. Deadwood indeed provides nesting and foraging substrates critical for many forest bird species ([24], [27], [25]). Interestingly, the detected threshold for deadwood was lower than the observed mean in our dataset (31.5 m3 ha-1) and lower than previously reported thresholds in montane ecosystems (30-40 m3 ha-1 - [43]). This suggests that although overall deadwood availability may not be a limiting factor in our montane study areas, local shortages could still constrain certain species ([8]). Snags, in particular, are key resources that enhance habitat quality for saproxylic insects and many other invertebrates, and consequently for the insectivorous birds that feed on them ([2], [18], [55]). They also serve as nesting sites for both primary excavators (e.g., woodpeckers) and secondary cavity users (also called weak or non-wood excavators, such as nuthatches, tits, stock doves, robins, thrushes - [56]). Snags may additionally benefit aerial foragers by contributing to an open forest canopy structure ([50]). Log volume also emerged as a key structural component, providing shelter and nesting sites for wildlife ([37]). Díaz et al. ([17]), for instance, found that some ground-nesting bird species were associated with piles of logs in the forest. In our study, log volume positively influenced canopy nesters, possibly because it is a proxy for old-growth conditions and structural maturity, as its value increases with tree size and is higher in late-successional stands ([11], [44]). Indeed, relatively mature trees are critical to provide breeding habitat for canopy nesters ([32], [41]). Overall, deadwood and its components are crucial for many bird guilds, and their occurrence is heavily influenced by forest management practices ([24]). As suggested by Ausden ([2]), standing and fallen dead trees should be retained unless they pose safety risks. Management plans should ensure the retention of suitable trees and species to support the future availability of deadwood-associated habitats ([36], [56], [19]).
Limitations and opportunities
The threshold values reported here should be interpreted with caution, as they were calibrated only for birds and for montane, beech-dominated forest stands selected for relatively similar conditions. Different taxa may respond to different thresholds, depending on conservation goals and environmental gradients, and such an approach could probably be generalized to other taxa on a wider range of ecological and forest conditions ([43]).
Our study aimed to support the use of selected forest-structure indicators to inform forest management. To maintain replicability and applicability, we used a simple approach that could be extended to other variables at the stand or landscape scale (e.g., understory, litter, abiotic factors) or to explore interactions among different stand structural attributes. Further research could also explore alternative biodiversity metrics, such as beta diversity, functional diversity, and phylogenetic diversity. For instance, bird-related response variables could include traits such as diet preferences and requirements or migratory strategies. For example, Rigal et al. ([48]) showed that forest cover generally exerts a positive influence on long-distance migrants.
Conclusion
Our results, based on an innovative threshold-based methodology, confirmed the importance of specific forest stand attributes for bird conservation. These include a suitable mixture of tree species ([32]), relatively open canopy structures, and deadwood ([27], [25]). As such, this study contributes to a shift in forest management toward greater sustainability, although the quantitative threshold values identified here may not yet be sufficient to inform operational management directly. The use of birds as indicators for forest management planning and assessment should be promoted, as bird monitoring relies on relatively simple survey methods but provides valuable information on habitat conditions and other forest specialist taxa ([13]). Traditionally, management strategies have focused on maintaining or enhancing plant species richness or specific tree species, which are not always relevant to habitat suitability for birds and other wildlife ([2]). Conversely, when bird-based strategies have been implemented, they have often been reactive, targeting a single, frequently threatened, species through “crisis management” approaches ([2]).
Future forest management should aim to support the structure and function of entire bird communities, addressing both short- and long-term perspectives ([2], [41]). In addition, incorporating landscape-scale variables will be essential for better explaining patterns in bird presence, absence, and species richness ([41]).
Acknowledgements
AP conceived the study, developed the methodology, curated the data, managed the project, and prepared the original draft; YP contributed to conceptualization, methodology, formal analysis, and draft preparation; LC performed formal analysis and contributed to review and editing; GT and TC curated data and participated in review and editing; SB curated data, acquired funding, supervised the project, and contributed to review and editing; TS curated data, supervised the project, and contributed to review and editing. All authors read and approved the final manuscript.
We are grateful to Rafael De Andrade for contributing to data collection and elaboration. We thank the numerous birders and foresters who contributed to data acquisition. French data were partly granted by the French Ministry of Ecology (convention Cemagref-DEB / MEEDDAT, Action GNB through the “Biodiversité et Gestion Forestière” program (convention GNB no. 2100214651) and the National Forestry Board (“Office National des Forêts”, convention ONF-Cemagref, Action 5, 2008).
AP was supported by a PhD grant supervised by TS from the Fondazione Cariparo and by the Short-Term Scientific Mission Grant provided by the COST Action 18207 Bottoms-Up. This article was funded by the EU Framework Programme Horizon 2020 through the COST Association (⇒ https://www.cost.eu/): COST Action CA18207: BOTTOMS-UP - Biodiversity of Temperate forest Taxa Orienting Management Sustainability by Unifying Perspectives. SB, TC and TS acknowledge the support of the National Biodiversity Future Center (NBFC) to the Sapienza University of Rome and University of Padova, funded under the National Recovery and Resilience Plan (NRRP), Mission 4 Component 2 Investment 1.4 - Call for tender No. 3138 of 16 December 2021, rectified by Decree n.3175 of 18 December 2021 of Italian Ministry of University and Research funded by the European Union - NextGenerationEU; Project code CN_00000033, Concession Decree No. 1034 of 17 June 2022 adopted by the Italian Ministry of University and Research, CUP: B83C22002950007 and C93C220028 10006, Project title “National Biodiversity Future Center - NBFC”.
References
Gscholar
Gscholar
CrossRef | Gscholar
CrossRef | Gscholar
Gscholar
Gscholar
Gscholar
Gscholar
Gscholar
CrossRef | Gscholar
Gscholar
CrossRef | Gscholar
Gscholar
CrossRef | Gscholar
CrossRef | Gscholar
Gscholar
Authors’ Info
Authors’ Affiliation
Thomas Campagnaro 0000-0002-6307-6892
Tommaso Sitzia 0000-0001-6221-4256
Department of Land, Environment, Agriculture and Forestry, Università degli Studi di Padova, Viale dell’Università 16, 35020 Legnaro, PD (Italy)
Univ. Grenoble Alpes, INRAE, Lessem, 2 rue de la Papeterie, BP76, F-38402 Saint-Martin-d’Hères, Grenoble (France)
Department of Plants and Crops, UAV Research Centre, Ghent University, Coupure Links 653 Bl A, 9000 Ghent (Belgium)
Forest & Nature Lab, Ghent University, Geraardsbergsesteenweg 267, 9090 Gontrode-Melle (Belgium)
National Research Council, Research Institute on Terrestrial Ecosystems, v. Madonna del Piano 10, 50019 Sesto Fiorentino, FI (Italy)
Sabina Burrascano 0000-0002-6537-3313
Tommaso Sitzia 0000-0001-6221-4256
NBFC, National Biodiversity Future Center, Piazza Marina 61, 90133 Palermo (Italy)
Department of Environmental Biology, Sapienza, University of Rome, p.le Aldo Moro 5, 00185 Rome (Italy)
Corresponding author
Paper Info
Citation
Portaccio A, Paillet Y, Chojnacki L, Trentanovi G, Campagnaro T, Burrascano S, Sitzia T (2026). Bird response to forest structure and composition and implications for sustainable mountain forest management. iForest 19: 18-27. - doi: 10.3832/ifor4921-018
Academic Editor
Mirko Di Febbraro
Paper history
Received: Jun 06, 2025
Accepted: Dec 16, 2025
First online: Jan 11, 2026
Publication Date: Feb 28, 2026
Publication Time: 0.87 months
Copyright Information
© SISEF - The Italian Society of Silviculture and Forest Ecology 2026
Open Access
This article is distributed under the terms of the Creative Commons Attribution-Non Commercial 4.0 International (https://creativecommons.org/licenses/by-nc/4.0/), which permits unrestricted use, distribution, and reproduction in any medium, provided you give appropriate credit to the original author(s) and the source, provide a link to the Creative Commons license, and indicate if changes were made.

Web Metrics
Breakdown by View Type
Article Usage
Total Article Views: 3264
(from publication date up to now)
Breakdown by View Type
HTML Page Views: 649
Abstract Page Views: 1552
PDF Downloads: 947
Citation/Reference Downloads: 1
XML Downloads: 115
Web Metrics
Days since publication: 182
Overall contacts: 3264
Avg. contacts per week: 125.54
Article Citations
Article citations are based on data periodically collected from the Clarivate Web of Science web site
(last update: Mar 2025)
(No citations were found up to date. Please come back later)
Publication Metrics
by Dimensions ©
Articles citing this article
List of the papers citing this article based on CrossRef Cited-by.
Related Contents
iForest Similar Articles
Research Articles
Enhancing forest biodiversity indicators in inventories through harmonized protocols
vol. 18, pp. 109-120 (online: 20 May 2025)
Review Papers
The forest biodiversity artery: towards forest management for saproxylic conservation
vol. 9, pp. 205-216 (online: 26 October 2015)
Research Articles
Stand structure and deadwood amount influences saproxylic fungal biodiversity in Mediterranean mountain unmanaged forests
vol. 9, pp. 115-124 (online: 08 September 2015)
Research Articles
Early responses of biodiversity indicators to various thinning treatments in mountain beech forests
vol. 11, pp. 609-618 (online: 25 September 2018)
Short Communications
An approach to measuring biodiversity and its use in analysing the effect of nitrogen deposition on woodland butterfly populations in the Netherlands
vol. 2, pp. 46-48 (online: 21 January 2009)
Research Articles
Consistency among forest structure and biodiversity potential index (IBP): an assessment of stand structural complexity for floodplain poplar woodlands
vol. 18, pp. 335-343 (online: 04 November 2025)
Research Articles
Investigating the effect of selective logging on tree biodiversity and structure of the tropical forests of Papua New Guinea
vol. 9, pp. 475-482 (online: 25 January 2016)
Research Articles
Bird composition and diversity in oak stands under variable coppice management in Northwestern Turkey
vol. 11, pp. 58-63 (online: 25 January 2018)
Book Reviews
National forest inventories: contributions to forest biodiversity assessments (2010)
vol. 4, pp. 250-251 (online: 05 November 2011)
Research Articles
The effects of forest management on biodiversity in the Czech Republic: an overview of biologists’ opinions
vol. 15, pp. 187-196 (online: 19 May 2022)
iForest Database Search
Search By Author
Search By Keyword
Google Scholar Search
Citing Articles
Search By Author
Search By Keywords
PubMed Search
Search By Author
Search By Keyword


