Taxonomic distinctness of climbing plants and epiphytes in central-Chilean forests: an alternative diversity measure from unequal species lists
iForest - Biogeosciences and Forestry, Volume 18, Issue 5, Pages 283-292 (2025)
doi: https://doi.org/10.3832/ifor4693-018
Published: Oct 20, 2025 - Copyright © 2025 SISEF
Research Articles
Abstract
Protected wild areas aim to conserve biodiversity. However, a lack of monitoring limits the availability of biological information needed to achieve this goal. This study used taxonomic distinctness (Δ+), its variance (Λ+), and a combined metric of both measures as alternative methods to monitor the diversity of climbing plants and vascular epiphytes in the absence of standardized data over time and space. The study was conducted in five forested small protected areas within the biodiversity hotspot of central Chile. The method involved updating the species inventory and comparing it with those from previous studies. The results showed that epiphytes followed a general pattern of increasing diversity towards the south along the latitudinal gradient (Δ+ between 54.95 and 73.3), while climbers remained more stable (Δ+ between 70.33 and 72.33). The combined analysis of both indices (Δ+ and Λ+) suggested that both climbers and epiphytes gained taxonomic diversity over time at most sites (p < 0.05). Sites that did not follow this general pattern may reflect differences in sampling design between the original and current inventories, which may have influenced the results. This observation requires further investigation as anthropogenic pressures may explain these variations. Future research should focus on long-term monitoring of the taxonomic distinctness of both assemblages to assess their responses to environmental disturbance and climate change, thereby providing a basis for developing more effective conservation strategies.
Keywords
Biodiversity Hotspot, Ecotone, Species Composition, Vascular Plants
Introduction
One of the primary objectives of protected wild areas is the conservation of biodiversity, particularly in the context of global climate change and increasing demand for ecosystem goods and services. This demand is placing growing pressure on these areas and the species inhabiting them ([35]). Achieving this objective necessitates access to information that enables the study of changes in biodiversity (e.g., species composition or richness) across time and space, typically through inventories or monitoring programs. However, logistical constraints such as accessibility, funding, and time often hinder comprehensive species sampling within a given area. In this context, vascular indicator plants represent a practical starting point for long-term monitoring programs ([19]). Changes in the distribution of these species can provide insights into local climate variations or the effects of habitat modification, and their diversity is a reliable predictor of the diversity of other taxa ([35]).
Despite the potential benefits offered by indicator species, the implementation of inventories or other systematic sampling strategies in protected areas remains an unresolved issue in most Latin American countries and globally. This is mainly because such activities are resource-intensive and must be linked to national policies. The limited availability of data for species conservation is a recognized problem ([28]). In the absence of a formal data collection strategy, using existing information from previous studies becomes a viable alternative. This secondary information, such as floristic catalogs, is often derived from sources with varying objectives, methods, and times of collection, and generally only provides occurrence data (presence-absence).
Although citizen science initiatives currently offer promising alternatives for advancing biodiversity studies, large-scale biodiversity databases (e.g., GBIF - ⇒ https://www.gbif.org/) still present significant challenges, including inconsistencies in taxonomic resolution, spatial biases, and variable data quality depending on the original sources ([47]). These issues can limit the comparability of heterogeneous data across time and space ([19]). Nevertheless, certain analytical approaches enable the effective utilization of these datasets for preliminary assessments, such as determining the conservation status of individual species or species groups. Such approaches include taxonomic distinctness indices ([16]), species distribution modeling ([34]), and gap analysis ([1]).
A significant challenge in biodiversity assessments is the use of non-standardized or incomplete datasets ([19]). Basic diversity metrics such as species richness and similarity indices can be heavily influenced by sampling intensity and completeness, which frequently vary between datasets and are often not explicitly reported. Consequently, indices based solely on species richness or composition might not reliably detect subtle yet ecologically relevant changes. Furthermore, assemblage composition may shift substantially due to long-term environmental changes or disturbances, further complicating comparisons. Although strategies such as rarefaction curves ([12]) and species richness estimators ([13]) can partially address these sampling biases, these methods remain sensitive to temporal and spatial variability in sampling intensity. Despite these limitations, species inventories, floristic catalogs, and other biodiversity datasets contain valuable biological information that reflects the taxonomic relationships among species. In this context, taxonomic distinctness offers a valuable complementary approach ([16]).
Taxonomic distinctness refers to the degree to which species in a community are evolutionarily or taxonomically related, encompassing both the ecological roles and shared evolutionary histories that shape community structure. In this context, taxonomic distinctness indices (Δ+ and Λ+) offer a robust way to measure and compare how closely or distantly related species are, based on the hierarchical distance between taxa at higher levels (e.g., genus, family, order). Specifically, Δ+ captures the average taxonomic distance among species, whereas Λ+ measures the variance in those distances ([15], [16], [21]). By emphasizing taxonomic relationships rather than simple species counts, these indices offer a more nuanced measure of biodiversity. A major advantage of taxonomic distinctness indices is their independence from sampling effort, enabling reliable comparisons across different studies and conditions, even when species richness or sampling methodologies vary ([15]). They also exhibit high sensitivity to environmental stress, responding clearly to disturbances such as habitat degradation or pollution and thus serving as valuable tools for ecosystem health monitoring. Moreover, these indices explicitly measure changes in taxonomic relationships at hierarchical levels beyond the species rank, recognizing that an assemblage spanning a broader range of higher-level categories (e.g., several families or orders) reflects greater evolutionary diversity than one concentrated within a few genera or families. Owing to their robustness as ecological indicators, taxonomic distinctness indices remain relatively unaffected by habitat differences and can be applied across a broad range of ecosystems ([21]). By capturing both community-wide patterns and deeper ecological and evolutionary processes, Δ+ and Λ+ provide insights into biodiversity that transcend mere species counts.
These taxonomic distinctness indices typically rely on a master species list, a carefully constructed reference that accurately reflects the regional taxonomic structure ([15], [16]). When the master list and the sampling methods are well-aligned, Δ+ and Λ+ can determine whether particular subsets of species (sites, time periods) adequately mirror the taxonomic composition of the broader region. Such relative independence from sampling size and effort is especially helpful for historical comparisons or studies with uneven or uncontrolled sampling. It can also help identify impacted sites or areas of exceptional taxonomic richness ([21]). This approach can be applied spatially (e.g., comparing local against regional assemblages) and temporally (e.g., spanning decades or centuries), making it invaluable in scenarios where standardizing sample sizes proves impractical. However, the accuracy of these indices depends on maintaining a sufficiently well-resolved taxonomic hierarchy and comparable sampling protocols ([15]).
Although taxonomic distinctness indices have been widely applied in marine and freshwater environments ([6], [24]), their use in terrestrial ecosystems remains less common ([43]). The aim of this study is to contribute to the application of these indices in forest ecosystems by analyzing species inventories in five small protected wild areas distributed along the coast of central Chile, a region recognized as a global biodiversity hotspot ([33]). The study areas include Los Ruiles National Reserve (45 ha), Los Queules National Reserve (146 ha), Contulmo Natural Monument (82 ha), Rucamanque Estate (330 ha), and Cerro Ñielol Natural Monument (89 ha). These units are located in a climatic and vegetation transition zone, where sclerophyllous vegetation from the north and temperate forest from the south converge ([30]). The selection of these areas was based on the availability of historical inventory data, which provides the opportunity to compare changes in species diversity over time and detect signals of ecosystem or climatic shifts ([19]).
The literature suggests that climbing plants and vascular epiphytes, such as filmy ferns, may serve as indicator species for habitat structure changes and ecosystem disturbance levels in forests. These plants are highly dependent on forest trees for their survival and display differentiated responses to environmental gradients ([48], [36]). For example, more humid conditions in the lower section of tree trunks create more favorable microhabitats for epiphytic ferns (Hymenophyllaceae - [39]), while climbers prefer clearings or sites with greater direct solar radiation ([11]).
The principal aim of this study is to assess temporal changes in the taxonomic distinctness of assemblages composed of forest climbing plants and epiphytes. To achieve this, the species lists from each wildlife reserve were compared against a master species list compiled from historical and current inventories. Taxonomic distinctness was evaluated using both average taxonomic distinctness (Δ+) and its variance (Λ+). These two indices were first analyzed independently and then combined, as their simultaneous use (Δ+ and Λ+) offers greater sensitivity for detecting subtle shifts in taxonomic structure, particularly concerning species distribution and relatedness within assemblages.
The starting hypothesis is that the taxonomic diversity of climbing plants has increased over time, whereas the diversity of epiphytes has decreased. This expectation is based on the premise that epiphytes, lacking effective mechanisms for moisture regulation, are primarily restricted to stable, humid microhabitats ([20]). Temporal changes in diversity patterns are thus considered a response to the increasing influence of the Mediterranean climate on forest structure and composition, potentially exacerbated by anthropogenic pressures, such as the growing number of visitors in protected areas ([44]). Such pressure could fragment habitats, amplify edge effects, and limit suitable colonization opportunities for epiphytes, while simultaneously creating favorable conditions for climbing plants ([36]). Thus, differences in taxonomic composition between epiphyte and climber assemblages may reflect underlying environmental pressures, providing insights to support efforts aimed at updating species inventories and improving management practices in protected wild areas.
Materials and methods
Description of the study area
The study area is situated within the Mediterranean-temperate phytogeographic interaction zone of central Chile, encompassing five protected wild areas: Los Ruiles National Reserve (45 ha), Los Queules National Reserve (146 ha), Contulmo Natural Monument (82 ha), Rucamanque Estate (330 ha), and Cerro Ñielol Natural Monument (89 ha). These sites, located within a highly fragmented landscape dominated by Pinus radiata D. Don plantations, form part of the coastal range (Fig. 1) and are recognized as one of the world’s biodiversity hotspots ([33]).
Fig. 1 - Wilderness areas under study in central Chile.
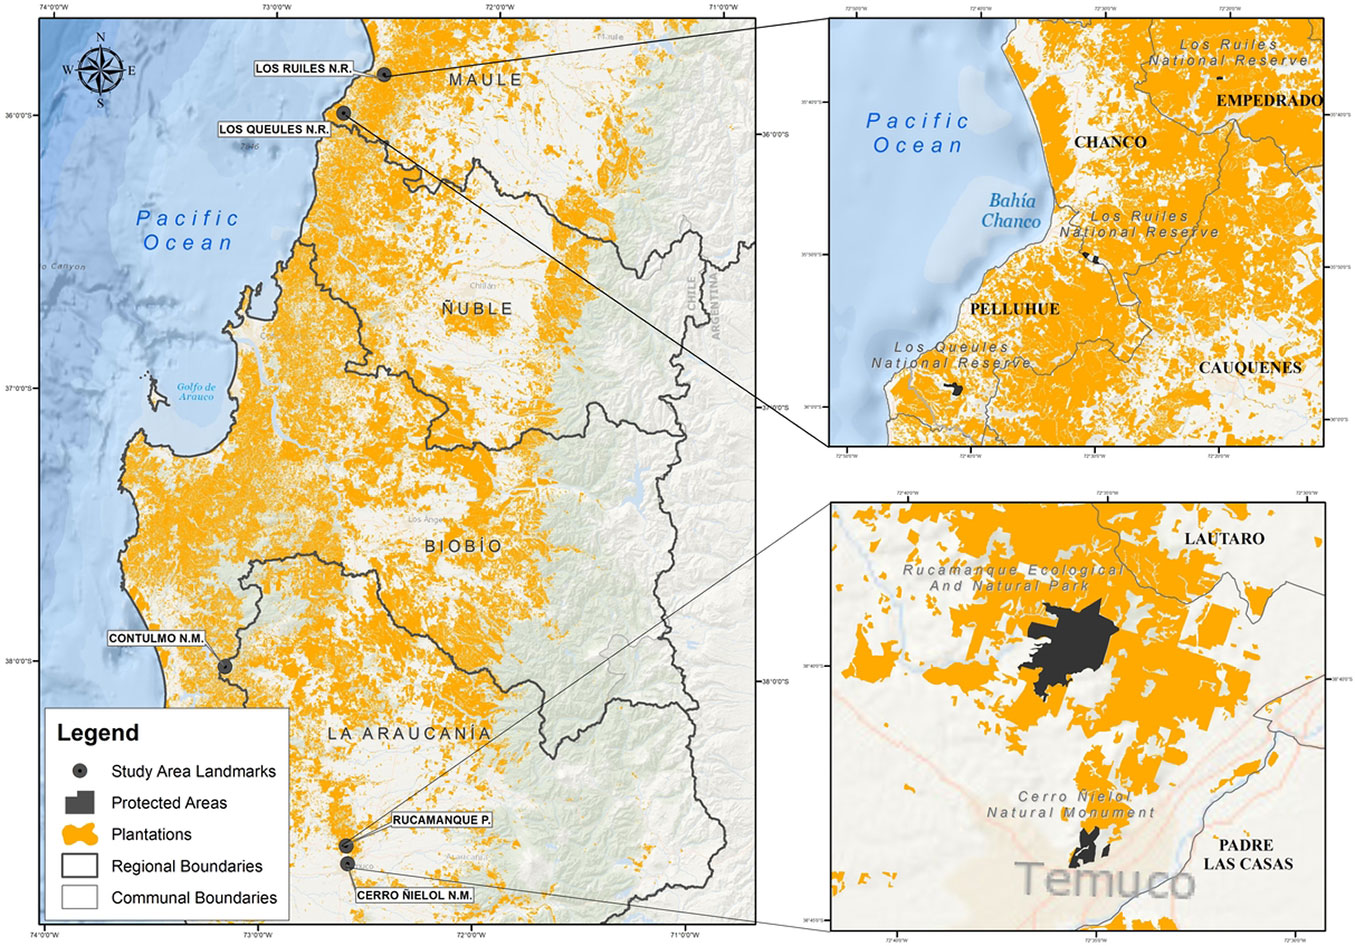
The geographic coordinates of the study area range from 35° 49′ 59.38″ S, 72° 29′ 48.76″ W at Los Ruiles National Reserve to 38° 43′ 18.86″ S, 72° 35′ 12.35″ W at Cerro Ñielol Natural Monument. The climate shifts from Mediterranean with oceanic influence in the north to temperate with Mediterranean influence in the south. Annual rainfall varies from 1086 mm at Los Ruiles, with an average temperature of 10.8 °C, to 1240 mm at Cerro Ñielol, where the average temperature is 10.9 °C ([30]).
The predominant vegetation in the region reflects the climatic transition: Mediterranean deciduous forests in the north, with species such as Nothofagus glauca (Phil.) Krasser and Persea lingue (Ruiz & Pav.) Nees, and temperate deciduous forests in the south, dominated by Nothofagus obliqua (Mirb.) Oerst. and Laurelia sempervirens (Ruiz & Pav.) Tul. Common species across the region include Nothofagus spp., and Cryptocarya alba (Molina) Looser. Climbers and epiphytes are also widespread throughout these areas ([30]).
Sampling design and data collection
A non-random sampling design was employed to capture greater microhabitat variation and maximize the detection of rare species ([18]). Trails and ravines were used as natural transects ([8]), along which all vascular plant species were identified and recorded. Within these transects, circular plots (3 m in diameter, 7.06 m2) were established, applying an intensive survey approach to ensure a thorough assessment of species composition ([36]).
Within each plot, all epiphytes and climbing plants were recorded from the ground up to a height of 2.3 meters on tree trunks with a diameter at breast height (DBH) ≥3 cm. Additionally, climbing plants at juvenile stages, including those growing on the ground, and individuals colonizing fallen logs were documented.
Sampling was conducted between 2018 and 2023, with a total of 100 plots established. Surveys were carried out in Cerro Ñielol in 2018 (25 plots), Contulmo in 2020 (15 plots), and in Los Queules (17 plots), Los Ruiles (21 plots), and Rucamanque (22 plots) between 2022 and 2023.
Epiphytes were identified following the criteria established by Larsen et al. ([27]), while the identification of climbing plants followed the guidelines provided by Marticorena et al. ([31]). Some specimens were also identified with the assistance of the herbarium at the University of Concepción (CONC), Chile.
Historical inventories
The bibliographic sources for the floristic species lists were drawn from five key studies, each employing different methodologies that combined exhaustive vegetation censuses, phytosociological inventories, systematic sampling, and herbarium records.
For Cerro Ñielol Natural Monument, Hauenstein et al. ([23]) conducted vegetation censuses between 1980 and 1984, complemented by phytosociological inventories using Braun-Blanquet’s approach to describe species composition and classify vegetation associations. Similarly, for Rucamanque Estate, Ramírez et al. ([38]) conducted censuses using a phytosociological framework.
In Contulmo Natural Monument, Baeza et al. ([3]) compiled the most comprehensive floristic catalogue based on botanical field explorations, complemented by herbarium records to ensure taxonomic accuracy. Similarly, for Los Queules and Los Ruiles National Reserves, Arroyo et al. ([2]) conducted botanical surveys across diverse habitats in 1999 and 2000, integrating these data with herbarium records from national and international collections.
To analyze the taxonomic distinctness of climber and vascular epiphyte assemblages, the taxonomic tree structure was defined using six hierarchical levels of the standard Linnaean classification: species, genus, family, order, class, and phylum. The classification framework was derived from the “Catalogue of Life” ([4]). Each protected wild area was considered a sample representing the taxonomic diversity of the phytogeographic region at two distinct time points: (i) historical records compiled from the aforementioned bibliographic sources, and (ii) contemporary field surveys conducted as part of this study, allowing for a comparative analysis of species composition. Historical inventories are identified by an abbreviation followed by a two-digit code representing the year of the survey (e.g., MNC83 = 1983, RQE89 = 1989). In contrast, current inventories use the same abbreviation without the numerical suffix (e.g., MNC, RQE, CTM, LQLES, LRLES).
Analysis of taxonomic structure
The taxonomic structure of the samples (i.e., the wild areas) was quantified using taxonomic distinctness indices: average taxonomic distinctness (Δ+, eqn. 1) and its variance (Λ+, eqn. 2), following the methods of Clarke & Gorley ([17]). This analysis was performed separately for vascular epiphyte and climbing plant assemblages, as their distinct biological traits may influence habitat structure and responses to climatic conditions ([36]):
The average taxonomic distinctness (Δ+) for an observed number of species (S) in a sample represents the weighted average of the taxonomic distances between all species pairs, measured within the taxonomic hierarchy. These distances, denoted as ωij, correspond to the number of hierarchical levels separating each species pair (i,j). Each level in the taxonomic classification contributes a predefined weight to the total distance, following the methodology of Clarke & Warwick ([16]). The maximum possible distance assigned to species from different phyla is set to 100 and divided into six equal steps across the taxonomic hierarchy. Consequently, species within the same genus have a taxonomic distance of 16.6, those at the family level are assigned a weight of 33.3, and species from different phyla retain the maximum distance of 100. The Δ+ index is calculated by summing all taxonomic distances between unique species pairs (∑∑i<j ωij), normalized by the total number of species pairs [S(S-1)/2].
Since Δ+ represents the average taxonomic distance among species in a community, the addition of new species does not necessarily lead to greater taxonomic distinctness. When the newly added species are taxonomically closely related (e.g., within the same genus), they introduce comparisons with lower taxonomic distances, reducing the mean taxonomic distance and thereby decreasing Δ+. Conversely, if the new species belong to more distantly related taxa, Δ+ may increase or remain stable depending on their placement within the taxonomic hierarchy.
While Δ+ quantifies the average taxonomic distance or branch length, it does not provide information about the overall shape of the taxonomic tree. To address this, the variance in taxonomic distinctness (Λ+) is calculated, measuring the dispersion of taxonomic distances relative to the mean Δ+ value. This calculation involves summing the squared deviations of each taxonomic distance from Δ+ [∑∑i<j (ωi<j - Δ+)2]. Λ+ helps distinguish assemblages with different branching distributions, such as those with high species richness within certain genera or higher hierarchical taxa represented by only a single species ([16]).
The hypothesis tested was that the samples (i.e., the wild areas), each comprising n species, represent sub-lists randomly drawn from a master species list encompassing all taxa present across the wild areas, and thus do not differ significantly in their taxonomic structure from the expectation under a null model of random species assembly based on this master list. This analysis assumes that historical inventories were sufficiently intensive to capture most of the species present across all study sites, ensuring that the master list is representative of the regional taxonomic structure defined by the sampled sites. Under these conditions, Taxonomic Distinctness (Δ+) is theoretically independent of sample size and survey effort ([15]). Consequently, any observed differences in Δ+ are expected to reflect genuine variations in taxonomic structure across sites rather than artifacts of sampling effort.
To test this hypothesis, sub-lists of five species were randomly extracted, with their size progressively increased by a factor of 1.2 (the default setting in PRIMER software, e.g., 4, 4.8 ≈ 5, 6.9 ≈ 7), up to the maximum number of species recorded at the richest site. Each sub-list was then randomly permuted 10.000 times, generating new taxonomic distinctness indices for these permuted subsets, based on the construction of new taxonomic trees. This process built the probability distribution under the null hypothesis, establishing 95% confidence intervals for both the average (Δ+) and variance (Λ+) of taxonomic distinctness ([17]).
It is important to note that this method does not conduct direct statistical comparisons between sites. Instead, it assesses deviations from a null expectation derived from the master species list.
Following the same rationale, the simultaneous relationship between both indices (Δ+, Λ+) was examined using an ellipse plot, one for each sublist size. Under the null hypothesis - which assumes that observed taxonomic distinctness values result from a random assembly model based on the master species list - each confidence ellipse serves as a reference to evaluate two key aspects: (i) whether communities conform to the overall taxonomic structure of the master list, as indicated by their position inside or outside the central 95% confidence ellipse, and (ii) whether species sublists of a given size exhibit the expected taxonomic distinctness. The null distribution for each sublist size was estimated through 10.000 simulations of species sublists, progressively increasing in size at fixed intervals.
To account for differences in species richness across sites, sublist sizes were adjusted separately for each plant group. For epiphytes, sublists were constructed in 5-species intervals (5, 10, 15, and 20), with each interval generating a distinct confidence ellipse, where 20 represents the total species richness in the master list. For climbing plants, sublists ranged from 15 to 35 species, following the same approach, with 35 representing the total recorded richness. This adjustment ensures that confidence ellipses reflect realistic expectations for each taxonomic group.
This graphical approach enhances the detection of deviations from the expected taxonomic structure that might not be statistically significant when assessed separately. Notably, when a site falls within a given confidence ellipse, its taxonomic structure aligns with the expected pattern for a community composed of that number of species randomly drawn from the master list (e.g., a site within the 10-species ellipse follows the expected structure for 10 species). Further, when a site falls exactly on the boundary of an ellipse, its taxonomic distinctness matches the expected threshold for that species richness level. Conversely, when two points are located in distinct regions separated by an ellipse, their taxonomic distinctness is considered significantly different (p < 0.05 - [16]).
Taxonomic trees were constructed using Taxallnomy (⇒ http://biodados.icb.ufmg.br/taxallnomy/), a database maintained by the Biodata Laboratory of the Federal University of Minas Gerais, based on NCBI Taxonomy. Species absent from the NCBI taxonomy were manually added by modifying the SVG file generated by Taxallnomy, adapting it to the taxonomy used in this study (see Tab. S2 and Tab. S4 in Supplementary materials). All calculations and the ellipse plottings were performed using the TAXDEST routine in PRIMER v. 7 software ([17]).
Results
Composition and taxonomic structure
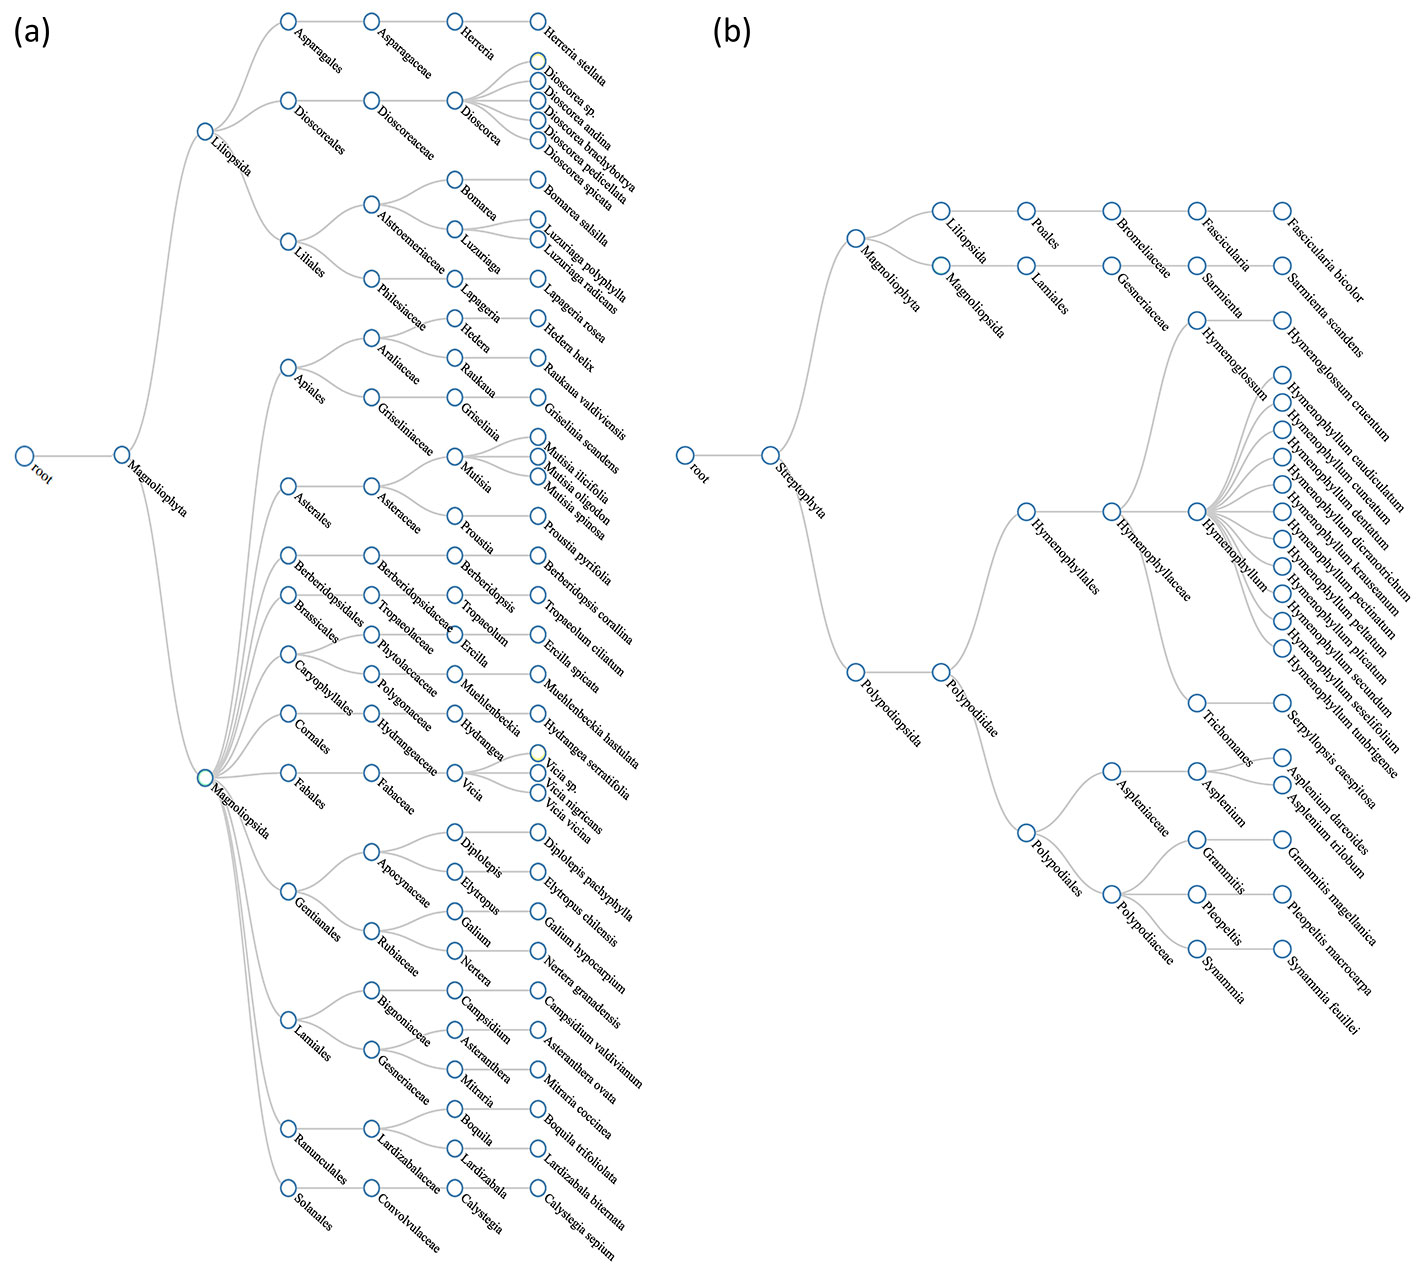
The taxonomic structure of climbing plants in the five protected wild areas of central Chile showed higher taxonomic distinctness (Δ+) than that of epiphytes, as reflected by a greater number of families and genera (Fig. 2). Epiphytes were predominantly ferns, largely from the genus Hymenophyllum. Overall, climbing plants displayed a more stable taxonomic composition across sites. In contrast, epiphytes exhibited greater variability, with new species recorded in surveys of this study (see Tab. S3 and Tab. S4 in Supplementary material).
Fig. 2 - Taxonomic structure of the master list for (a) epiphytes and (b) climbing plants.
Epiphytes
A total of 20 epiphyte species were documented, distributed across nine genera, five families, and four orders. Species richness per site remained relatively stable between the initial inventories (4-17 species) and the most recent surveys conducted in this study (5-17 species - Tab. S1, Tab. S2). However, site-specific comparisons revealed that Cerro Ñielol (MNC) and Rucamanque (RQE) had the most significant increases, with five additional species recorded compared to previous inventories.
Species such as Asplenium dareoides Desv. and Synammia feuillei (Bertero) Copel. have been consistently recorded across all sites along the latitudinal gradient. In contrast, species like Hymenophyllum seselifolium C. Presl and Pleopeltis macrocarpa (Bory ex Willd.) Kaulf. were only documented in the initial inventories at Contulmo (CTM).
The most diverse family was Hymenophyllaceae, represented by 13 species. Consequently, the genus Hymenophyllum (including 11 species) and the order Hymenophyllales (including 13 species) were the most represented. This family of filmy ferns demonstrated notable variability in species richness along the latitudinal gradient, suggesting that temporal and spatial changes in the taxonomic structure of the study sites were largely driven by changes in the species composition of this family. For instance, five species not observed in the initial inventory were documented at Cerro Ñielol: Hymenophyllum cuneatum, H. dicranotrichum, H. pectinatum, H. peltatum, and H. tunbrigense.
Climbers
The climber assemblage exhibited greater taxonomic richness than epiphytes, with a total of 36 species recorded across 27 genera, 17 families, and 13 orders (Tab. S3 and Tab. S4 in Supplementary material). Species richness per site ranged from 16 to 20 in the initial inventories and from 17 to 23 in the most recent surveys. The most notable increase was observed at Los Ruiles (LRLES), where the current inventory recorded 23 species, compared to 16 in the previous survey.
Species such as Bomarea salsilla (L.) Mirb., Lapageria rosea Ruiz & Pav., and Muehlenbeckia hastulata (Sm.) I.M. Johnst. have maintained their presence over time at all sites along the latitudinal gradient. In contrast, species like Boquila trifoliolata (DC.) Decne. and Cissus striata Ruiz & Pav. were recorded only in the current inventories at Los Ruiles and Los Queules, respectively.
The most frequently occurring families were Dioscoreaceae (five species), Asteraceae (four species), and Fabaceae (three species). The most frequently occurring genera were Dioscorea (five species), Mutisia (three species), and Vicia (three species). The most representative orders were Dioscoreales (five species), Liliales (four species), Gentianales (four species), and Asterales (four species).
Although the overall species composition remained largely stable across sites and between the historical and current inventories, some notable changes were observed. For instance, while the Dioscoreaceae family was present in both periods, the representation of its species varied. Dioscorea auriculata Poepp. was recorded at most sites, whereas Dioscorea pedicellata Phil. exhibited shifts in distribution between historical and current inventories.
Similarly, Mitraria coccinea Cav. was absent from the current inventory at Cerro Ñielol, while Elytropus chilensis (A. DC.) Müll. Arg. was recorded only in the most recent inventory. These species turnover events introduced some degree of variation in taxonomic structure and family composition.
Taxonomic distinctness
Epiphytes
The average taxonomic distinctness (Δ+) in the current inventories ranged from 54.95 at Contulmo (CTM) to 73.3 at Los Ruiles (LRLES), representing the sites with the lowest and highest taxonomic distinctness, respectively. This pattern suggests a northward increase in taxonomic distinctness along the latitudinal gradient, despite a concurrent decrease in species richness. However, in most sites, these variations were not statistically significant when compared to the master species list, which has an expected Δ+ of 53.25 (p > 0.05 - Tab. 1).
Tab. 1 - Comparison of the taxonomic distinctness of vascular epiphyte and climbing plant assemblages in five wild areas relative to the master species list (36 species for climbers, 20 species for epiphytes). Sample codes: Cerro Ñielol Natural Monument (MNC, MNC83), Rucamanque (RQE, RQE89), Contulmo Natural Monument (CTM, CTM99), Los Queules National Reserve (LQLES, LQLES05), Los Ruiles National Reserve (LRLES, LRLES05). Acronyms with numbers (e.g., MNC83, CTM99) refer to historical inventories, while acronyms without numbers (e.g., MNC, CTM) correspond to current inventories conducted in this study. Variables - (Δ+): average taxonomic distinctness, (Λ+): variance of taxonomic distances; (S): species richness; (p-value): probability associated with the null hypothesis of no difference between species samples and the master species list, obtained from 10.000 simulations; (na): not applicable.
| Group | Samples | S | Taxonomic distinctness | |||
|---|---|---|---|---|---|---|
| Δ+ | p-value | Λ+ | p-value | |||
| Epiphytes | MNC | 14 | 54.95 | 0.836 | 1181.29 | 0.087 |
| MNC83 | 10 | 65.93 | 0.174 | 1024.14 | 0.430 | |
| RQE | 17 | 55.15 | 0.758 | 966.15 | 0.607 | |
| RQE89 | 11 | 64.24 | 0.209 | 973.92 | 0.704 | |
| CTM | 15 | 58.89 | 0.188 | 920.99 | 0.861 | |
| CTM99 | 17 | 57.84 | 0.007 | 878.03 | 0.789 | |
| LQLES | 11 | 62.73 | 0.282 | 1090.54 | 0.298 | |
| LQLES05 | 7 | 75.40 | 0.077 | 836.48 | 0.913 | |
| LRLES | 5 | 73.33 | 0.261 | 677.78 | 0.689 | |
| LRLES05 | 4 | 55.56 | 0.985 | 339.51 | 0.625 | |
| Master list | 20 | 53.25 | na | 929.52 | na | |
| Climbers | MNC | 19 | 72.22 | 0.153 | 172.19 | 0.988 |
| MNC83 | 18 | 72.33 | 0.135 | 134.94 | 0.409 | |
| RQE | 17 | 70.96 | 0.881 | 142.96 | 0.548 | |
| RQE89 | 20 | 71.75 | 0.411 | 129.09 | 0.232 | |
| CTM | 18 | 71.13 | 0.982 | 174.32 | 0.963 | |
| CTM99 | 20 | 71.40 | 0.733 | 141.31 | 0.398 | |
| LQLES | 19 | 72.03 | 0.239 | 128.83 | 0.276 | |
| LQLES05 | 19 | 72.32 | 0.089 | 117.49 | 0.155 | |
| LRLES | 23 | 71.48 | 0.486 | 158.03 | 0.603 | |
| LRLES05 | 16 | 71.94 | 0.469 | 185.11 | 0.794 | |
| Master list | 36 | 70.90 | na | 179.61 | na | |
At Contulmo, the first inventory (CTM99) exhibited a highly significant difference from the master species list (Δ+ = 57.84, p = 0.007), indicating that its taxonomic distinctness was previously higher than in the current inventory (CTM, Δ+ = 58.89, p = 0.188). This suggests that its taxonomic structure is now more aligned with the expected regional composition.
In the past, Los Queules (LQLES05) displayed a marginally significant difference (Δ+ = 75.5, p = 0.077), suggesting a greater taxonomic breadth than the expected taxonomic structure. However, in the current inventory (LQLES, Δ+ = 62.73, p = 0.282), the observed decrease in taxonomic distinctness was not statistically significant. This reduction in Δ+ in the current inventories is likely explained by the increased representation of Hymenophyllum species, as the addition of closely related species within the same genus reduces the average taxonomic distinctness by decreasing the mean distance between species pairs. Other sites did not show significant differences (Tab. 1).
Regarding the variance of taxonomic distinctness (Λ+), the current inventories ranged from 677.78 at Los Ruiles (LRLES) to 1181.29 at Cerro Ñielol (MNC), the geographically extreme sites of the study area. This pattern suggests a gradual transition from more taxonomically homogeneous to more heterogeneous assemblages, with greater variability in taxonomic distances observed at the northernmost sites (see Tab. S2 and Tab. S4 in Supplementary material).
Despite this apparent gradient, none of the sites exhibited statistically significant differences from the master species list (Λ+ = 929.52, p > 0.05). However, Cerro Ñielol showed a marginally non-significant difference (MNC, Λ+ = 1181, p = 0.43), suggesting potential taxonomic enrichment compared to both the master list and the previous inventory (MNC83, Λ+ = 1024, p = 0.087).
The simultaneous analysis of both indices (Δ+, Λ+) across five-species intervals identified three statistically distinct zones (p < 0.05) in the ellipse plot (Fig. 3a). The central zone represents sites that do not significantly differ from the master species list, based on a 95% confidence threshold.
Fig. 3 - Ellipse graph simultaneously relating the taxonomic distinctness (Δ+, x-axis) and the variance of taxonomic distinctness (Λ+, y-axis) at two points in time. Epiphytes (a) and Climbing plants (b). Species richness (S) is shown in parentheses. Confidence limits for the contours were constructed by randomly extracting sublists (S) of 5 species with 10.000 simulations for 95% confidence. Sample codes: Cerro Ñielol Natural Monument (MNC, MNC83), Rucamanque (RQE, RQE89), Contulmo Natural Monument (CTM, CTM99), Los Queules National Reserve (LQLES, LQLES05), Los Ruiles National Reserve (LRLES, LRLES05).
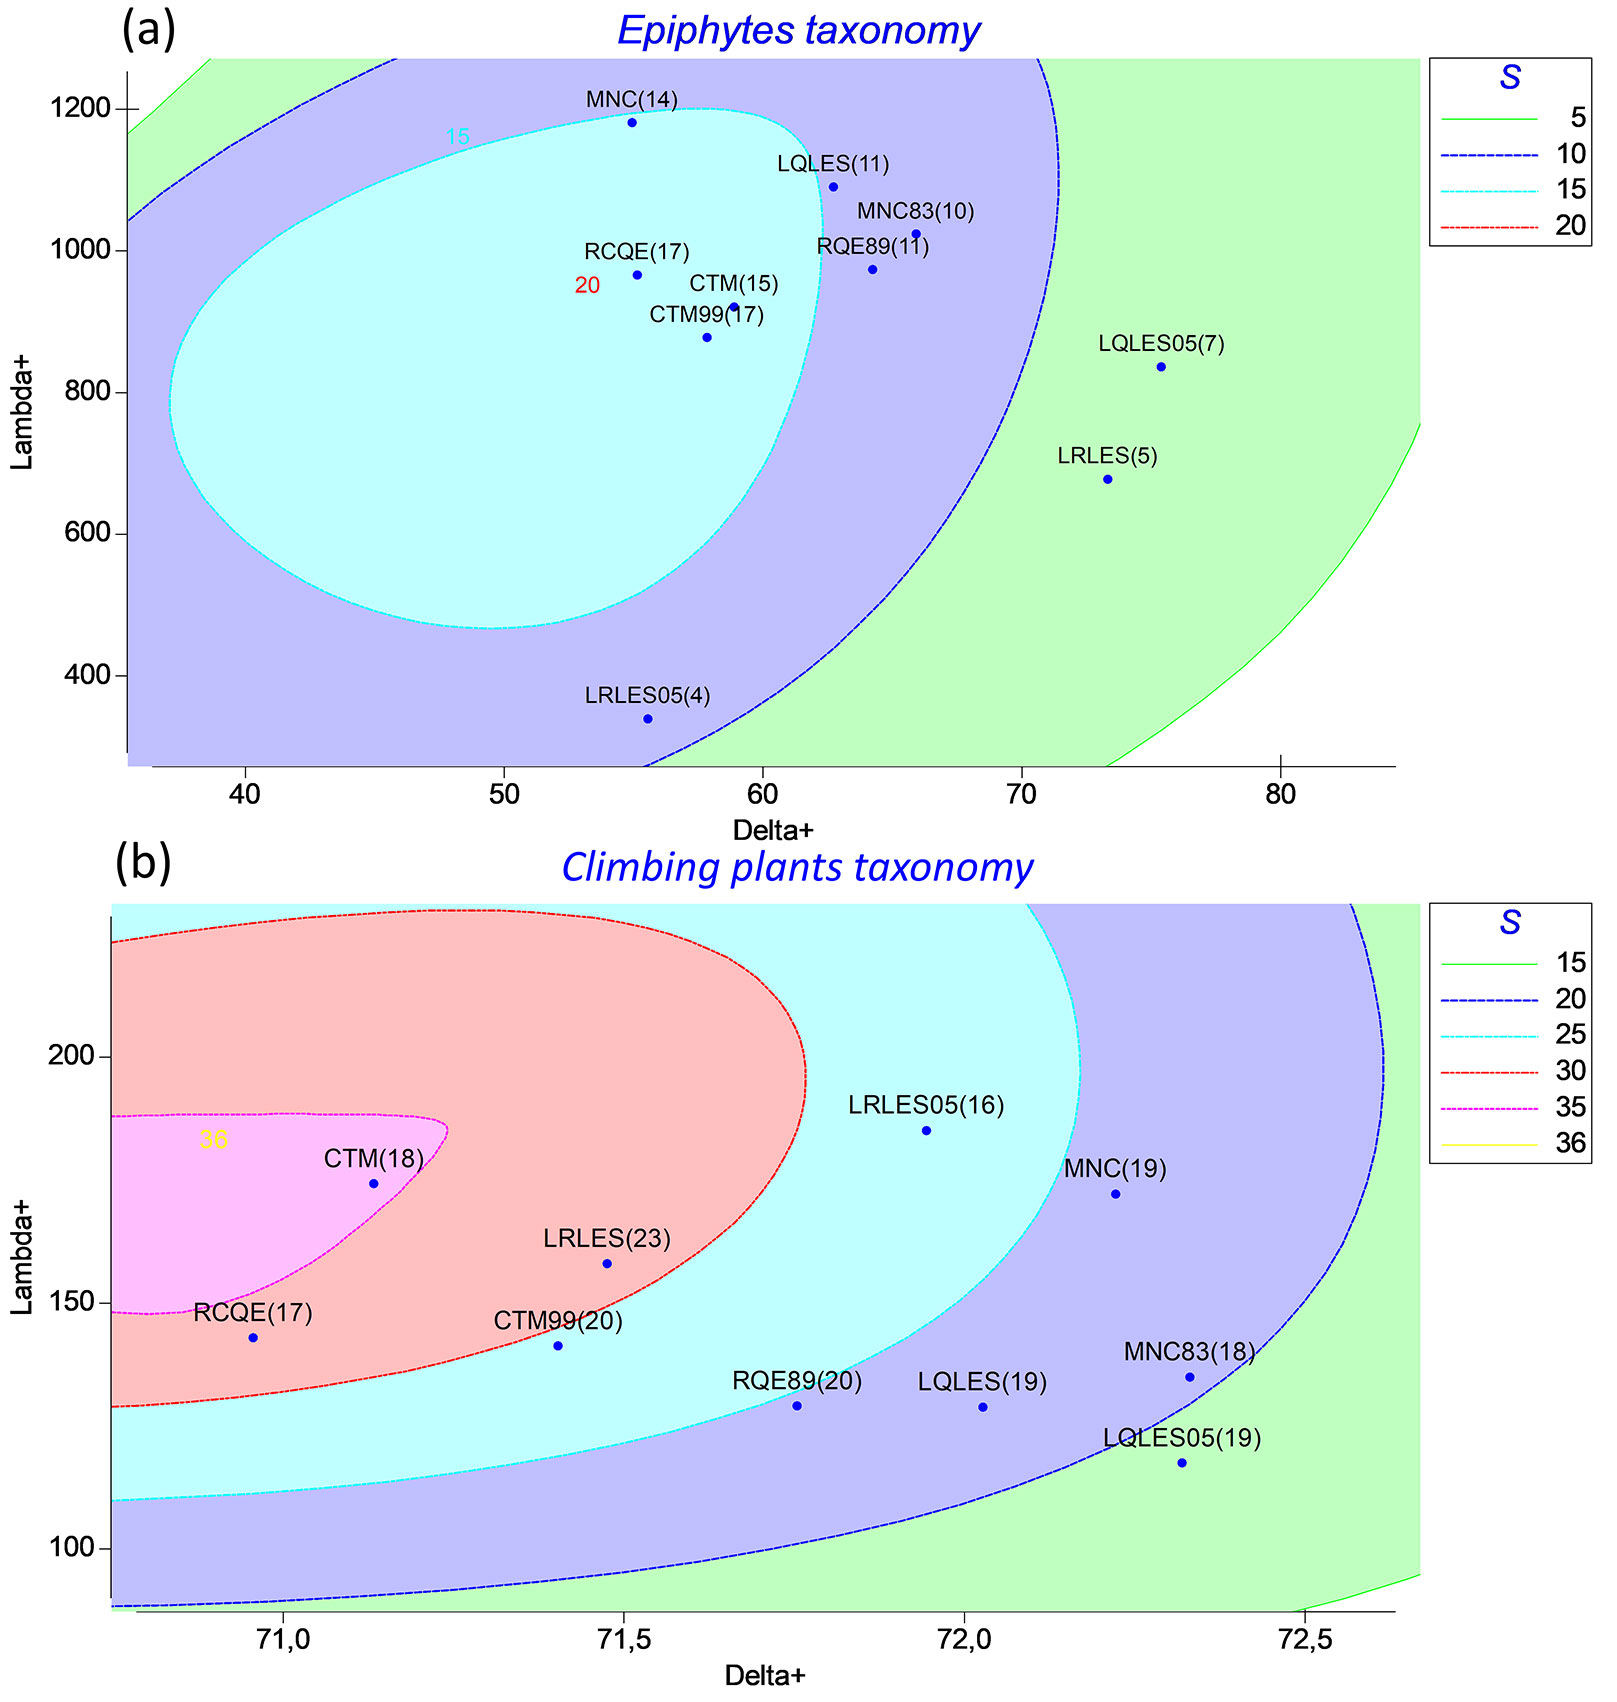
A clear temporal and spatial pattern emerges, revealing a south-to-north increase in taxonomic complexity that was not evident in previous inventories, indicating a progressive reorganization of site positions. In earlier inventories, LQLES05 was the most distant from the center, whereas CTM99 was already positioned within the central zone, indicating no differentiation from the master species list. In contrast, the current sampling exhibits a more structured distribution, with CTM, RQE, and MNC now grouped within the central zone, while LRLES is positioned at the extreme.
Overall, this shift indicates a more diverse and structured taxonomic composition in southern sites compared to previous inventories.
Climbers
Taxonomic distinctness in climbers remained stable over time and across sites in both mean (Δ+) and variance (Λ+), particularly when compared to epiphytes. The average taxonomic distinctness (Δ+) for climbers varied slightly, ranging between 70.33 and 72.33, while the variance of taxonomic distinctness (Λ+) ranged from 117.49 at Los Queules (LQLES05) to 174.32 at Contulmo (CTM). This suggests a consistent taxonomic structure over both spatial and temporal scales, with no significant differences at any site compared to the master species list (Δ+ = 70.9, p > 0.05).
However, the first inventory at Los Queules (LQLES05, Δ+ = 72.32, p = 0.089) suggests a minor deviation from the expected taxonomic structure, though this difference was not statistically significant. Compared to the current inventory (LQLES, Δ+ = 72.03), this indicates that the taxonomic composition of climbers remained relatively unchanged over time at this site.
The simultaneous analysis of both indices (Δ+, Λ+) for the five-species sublists identified five statistically distinct zones (p < 0.05) in the ellipse plot (Fig. 3b). Only Contulmo (CTM) was positioned within the central zone, indicating no significant deviation from the master species list at a 95% confidence level.
A clear pattern of increasing taxonomic complexity southwards and over time was observed, alongside a shift in site distribution across the ellipse zones. In the earlier inventories, no sites were positioned within the first or second zone, indicating that none closely resembled the master species list. This suggests that the overall taxonomic structure was historically more simplified. In contrast, the current sampling reveals a general trend of taxonomic enrichment, with some sites shifting towards the central region of the ellipse. For example, LRLES05 and RQE89, previously positioned in more peripheral zones, have now moved closer to the center, while no sites remain in the most distant zone.
This shift supports a broader pattern of increasing taxonomic complexity southwards and over time, with sites progressively converging towards the structure represented in the master species list. The presence of five distinct zones in climbing plants confirms that this assemblage encompasses a broader range of genera and exhibits greater phylogenetic dispersion compared to epiphytes, which formed only three zones. This indicates that climbing plant assemblages are taxonomically more heterogeneous, whereas epiphyte communities exhibit greater taxonomic similarity or phylogenetic clustering.
Discussion
Joint use of average taxonomic distinctness and its variance (Δ+, Λ+)
In this study, the average taxonomic distinctness (Δ+), its variance (Λ+), and their combined measure (Δ+, Λ+) were analyzed for epiphyte and climbing plant assemblages in five protected wild areas along the native forested coast of central Chile. Although each index individually captures only one dimension of the community’s taxonomic structure, the simultaneous use of both indices (represented graphically in an ellipse plot) proved to be more sensitive in detecting significant differences in taxonomic structure than when these indices were assessed separately ([16]). For instance, the combined analysis revealed an overall increase in taxonomic complexity over time for both epiphytes and climbers at most sites, except for Los Ruiles (LRLES), the only site to show a decrease in taxonomic distinctness among epiphytes.
One notable advantage of using both indices concurrently is that Δ+ offers a consistent and robust measure of taxonomic diversity by quantifying the average variability in taxonomic distances between pairs of species. At the same time, Λ+ captures the distribution of branches or the shape of the taxonomic tree within the community ([16]). By combining Δ+ and Λ+, researchers can better detect both average changes in taxonomic structure and the variability of these changes. This is particularly valuable for identifying disturbance patterns and differential responses to environmental pressures ([46]). Consequently, these indices could also be applied to assess potential shifts in taxonomic structure under climate change scenarios.
To date, most studies applying the metrics of taxonomic distinctness have focused on marine and freshwater ecosystems, examining a variety of organisms such as fish, nematodes, benthic macrofauna, and mollusks ([15], [46], [6], [24]). Interest in applying these metrics to terrestrial ecosystems has grown more recently, with research expanding to environments such as savannas, forest fragments, Mediterranean forests, arid regions, and the effects of silvicultural practices ([43], [41], [42]).
The reviewed studies consistently agree that average taxonomic distinctness (Δ+) and its variance (Λ+) are valuable tools for assessing taxonomic diversity. Moreover, the simultaneous use of these indices offers several advantages, including greater sensitivity to detecting subtle changes, a multidimensional assessment of taxonomic structure, and enhanced ecological interpretation of community patterns, as highlighted by previous authors ([46]). However, research within terrestrial ecosystems has yet to fully explore their joint application.
Species richness vs. taxonomic distinctness
Species richness, defined as the total number of species within a community, is a widely used measure of biodiversity, valued for its simplicity and ease of measurement. It facilitates direct comparisons between communities or habitats and helps identify areas of high biodiversity value for conservation ([21]). However, it fails to account for phylogenetic relationships, thereby limiting our understanding of biodiversity at functional and evolutionary scales ([45]). Two communities with the same number of species may differ significantly in their taxonomic composition, leading to variations in ecosystem functionality ([16]).
Taxonomic distinctness metrics, such as Δ+ and Λ+, overcome these limitations by explicitly incorporating taxonomic hierarchy (e.g., genus, family, order) as a proxy for evolutionary relatedness. Although these indices rely on standard taxonomic classifications rather than explicit phylogenetic analyses, they likely capture evolutionary history and functional diversity due to the hierarchical nature of taxonomy. This makes these metrics especially valuable for monitoring ecosystem health and assessing conservation effectiveness ([6]).
In this study, the taxonomic distinctness is especially evident when comparing epiphytes and climbers. Epiphytes, comprising 20 species, exhibited a broader range of Δ+ values (54 < Δ+ < 63), yet the analysis revealed only three distinct zones, indicating that, despite the wider Δ+ range, their overall taxonomic composition remains relatively cohesive. Climbers, by contrast, have a narrower span of Δ+ values (71 < Δ+ < 72) but exhibit higher variability in taxonomic composition, resulting in five distinct zones. Hence, the method demonstrates its sensitivity to differences in community structure, even when the mean Δ+ varies only slightly, as this sensitivity arises from the simultaneous consideration of both Δ+ and its variance Λ+, rather than from the average alone.
A key consideration when applying taxonomic distinctness metrics is ensuring that taxonomic classification is well resolved.
While interpreting taxonomic distinctness (Δ+) and its variance (Λ+) may be less intuitive than species richness, and comparisons across studies may be hindered by variations in taxonomic resolution or sampling design ([16]), this metric is often more informative, particularly for understanding biodiversity at functional and evolutionary levels ([15], [24], [6]). Thus, while species richness provides a straightforward measure of biodiversity, it does not necessarily reflect taxonomic structure or phylogenetic relationships. By incorporating taxonomic distinctness metrics, a more accurate and ecologically meaningful picture of biodiversity can be obtained, distinguishing between communities with similar species numbers but different taxonomic compositions.
The challenge of comparing biodiversity over time
Comparing biodiversity over time presents significant methodological and practical challenges that complicate the interpretation of results. A central difficulty is ensuring consistency in sampling design: methodological variations can create a false impression of increased diversity ([29]) and may partly explain the apparent rise in epiphyte and climber diversity observed in our recent inventories.
Early botanical surveys, though invaluable, were rarely georeferenced or standardized, making strict site-to-site comparisons difficult. Because most historical ecological work lacked the spatial precision and methodological consistency of modern studies ([14]), exact resampling is usually impossible. Even so, these legacy datasets provide indispensable baselines. Comparisons between historical and contemporary inventories are therefore vital for detecting long-term biodiversity trends and disentangling the combined effects of climate forcing and human disturbance ([35]). Indeed, multi-decadal records already document climate-driven declines across a range of animal and plant populations ([32]).
In the absence of continuous monitoring, historical-recent comparisons must be interpreted with caution. Apparent shifts may indeed represent genuine taxonomic turnover, yet the underlying drivers of land-use change, forest dynamics, climate variation, or their interactions often remain unresolved ([37]). These uncertainties, together with lingering methodological and taxonomic inconsistencies, can blur the mechanisms behind observed diversity patterns, even when modern surveys follow rigorous, standardized protocols.
An illustration of these challenges arises from our findings. Climbing plants exhibited a marked temporal increase in taxonomic distinctness at all sites except at Cerro Ñielol, where no change was observed. The stability observed at this site may reflect high visitor pressure, estimated to be tens of thousands per year ([44]), though its influence remains unquantified. In contrast, epiphytes showed an overall southward increase in taxonomic distinctness, while Los Ruiles displayed a decline, possibly indicating local homogenization driven by climate-mediated filtering of drought-tolerant lineages. These site-specific patterns underscore how true ecological shifts may be confounded by sampling artifacts and unmeasured pressures, highlighting the importance of rigorously standardized re-inventories when comparing historical and contemporary datasets.
Taxonomic uncertainty remains a major source of error in temporal biodiversity metrics. Incomplete species-level identifications ([10]), recently diverged species complexes ([5]), cryptic taxa ([25]), and erroneous sequences in DNA reference libraries ([40]) can all mislead analyses. These problems are compounded by the rapid evolution of identification methods. Whereas historical inventories depended on a handful of specialists working with printed floras and herbarium specimens ([7]), modern studies draw on millions of observations uploaded to citizen-science platforms such as iNaturalist® (⇒ https://www.inaturalist.org/) and Pl@ntNet® (⇒ http://identify.plantnet.org/). This digital revolution has accelerated discovery and broadened coverage, yet large repositories like GBIF still harbor taxonomic inconsistencies, spatial biases, and heterogeneous validation levels that can obscure true biodiversity patterns ([47]). Such discrepancies must therefore be weighed carefully whenever historical and contemporary datasets are compared.
Well-designed, long-term studies that pair consistent sampling with environmental monitoring remain indispensable for disentangling the interacting drivers of biodiversity change, especially in Latin America and other data-poor regions where standardized time series are rare ([35], [28]). In such contexts, legacy inventories provide some of the few baselines available, and taxonomic-distinctness indices offer a practical surrogate for detecting broad-scale shifts in community structure and informing conservation strategies when sustained monitoring is lacking.
Implications for forest conservation
Understanding forest biodiversity demands attention not only to how many species occur, but to how those species are related. Taxonomic distinctness metrics (Δ+ and Λ+) satisfy this requirement by revealing taxonomic loss, homogenization, enrichment, and, ultimately, the resilience of forest communities. Applied to monitoring and restoration, they allow managers to judge whether silvicultural practices preserve an ecologically representative taxonomic structure and, by extension, long-term forest stability.
Epiphytes and climbing plants illustrate the value of this approach. Because epiphytes - especially filmy ferns (Hymenophyllaceae) - depend on persistent humidity and shaded micro-habitats, they are highly sensitive to canopy alteration and climatic gradients ([39]). Climbers, in contrast, tolerate or even benefit from increased light, thriving in gap environments and spanning a wider range of families ([11]). Monitoring both groups, therefore, yields complementary signals: epiphytes track microclimatic stability and habitat continuity, whereas climbers reflect disturbance regimes, canopy openness, and successional dynamics. Consistent with previous findings ([36]), the present analysis shows that climbers occupy five well-separated zones in the ellipse (Δ+, Λ+), whereas epiphytes cluster in three zones, highlighting their contrasting structural responses.
The greater variability in epiphytic Δ+ observed suggests heightened sensitivity to fragmentation and forest heterogeneity. Part of this variation may be methodological; minute, filmy ferns are less detectable than conspicuous climbers, and older surveys lacked standard protocols, but it also points to genuine ecological vulnerability. Conversely, the stable taxonomic structure of climbers implies resilience rooted in taxonomic breadth. In our dataset, they span many more families than epiphytes, which concentrate in a few closely related lineages ([43]). Such breadth affords functional redundancy that can buffer forests against change.
Climate-driven environmental filtering adds a further layer of complexity. Warming and altered rainfall favor drought-tolerant, phylogenetically clustered taxa ([26]), potentially lowering taxonomic distinctness even when species counts remain unchanged. Conversely, when colonization by distantly related species prevails, distinctness may rise ([36]). Either trajectory has functional consequences: greater taxonomic distinctness enhances ecological complementarity, supporting processes such as pollination, seed dispersal, and nutrient cycling. In contrast, phylogenetic homogenization can erode functional redundancy and ecosystem resilience, ultimately compromising those same functions ([22]).
These findings point to clear management priorities. First, conserve humid forest patches that host specialized epiphytic communities and restore degraded stands in ways that promote the taxonomic variety of climbing plants, thereby strengthening overall forest resilience ([9], [36]). Second, preserve structural heterogeneity: smaller trees provide supports for twiners and tendril climbers, whereas larger stems are crucial for adventitious-rooted species ([11]). Finally, implement long-term, standardized monitoring, ideally pairing Δ+ and Λ+ with environmental variables to track genuine biodiversity trajectories ([43]). In this context, citizen-science platforms can help bridge data gaps in regions with limited monitoring capacity ([47]).
Taken together, these management considerations and monitoring needs underscore the broader significance of the study. In light of these results, although the initial expectation of diverging trends - steady gains in climber diversity and epiphyte decline - were only partially supported, the joint use of Δ+ and Λ+ uncovered clear patterns: climbers showed increasing taxonomic distinctness over time and stability along the latitudinal gradient, whereas epiphytes displayed site-specific variability with a southward rise in diversity. These findings confirm that taxonomic-distinctness metrics reveal structural changes that simple species counts may obscure, and reinforce their value for guiding forest-conservation strategies in a changing world.
Conclusions
This study highlights the taxonomic structure of vascular epiphytes and climbing plants in five protected wild areas along the native forested coast of central Chile. Taxonomic distinctness indices (Δ+ and Λ+) provided a more nuanced understanding of biodiversity patterns than species richness alone, revealing differences in taxonomic composition and structural complexity.
When applied independently, these indices captured distinct aspects of community structure: average taxonomic distinctness (Δ+) reflected overall richness across the taxonomic hierarchy, while its variance (Λ+) highlighted heterogeneity in taxonomic relatedness. Climbing plants exhibited greater taxonomic richness and stability over time and space, with no significant deviations from the expected structure based on the master species list. In contrast, epiphytes, particularly Hymenophyllaceae, showed greater variability, suggesting higher sensitivity to environmental heterogeneity. A trend of increasing epiphyte taxonomic complexity was observed towards the south, whereas Los Ruiles exhibited signs of taxonomic simplification, potentially indicating biodiversity loss or climate-induced changes.
The simultaneous use of Δ+ and Λ+ improved the detection of taxonomic shifts, showing that most sites became more structured over time. However, differences in sampling methodologies across historical and contemporary inventories may have influenced some patterns, requiring cautious interpretation of temporal comparisons.
These findings underscore the importance of maintaining structural forest heterogeneity to support taxonomically diverse assemblages. Epiphytes serve as indicators of forest continuity and microclimatic stability, while climbing plants reflect disturbance regimes and successional dynamics.
Future research should standardize sampling methods and integrate taxonomic distinctness metrics with functional and environmental data to enhance forest biodiversity assessments and conservation planning.
Acknowledgements
To Pedro Jara, manager of Reserva Nacional Los Ruiles, Carlos Reyes, manager of Reserva Nacional Los Queules; Claudio Correa, manager of Cerro Ñielol Monument; Juan Carlos Correa, manager of Contulmo; and Rodrigo Vargas, manager of Rucamanque. To Rodrigo Callejas for his dedicated work in preparing the cartography. To Ulises Zambrano, Elias Andrade, Martina Pincheira, and Benjamín Pincheira for their collaboration in the field. Special thanks to CONAF for facilitating access to the wilderness areas. The author was supported by the Chilean agency ANID-FONDECYT under postdoctoral project no. 3200698.
I also thank two anonymous reviewers for their valuable comments and suggestions, which greatly improved this manuscript.
References
Gscholar
Gscholar
Gscholar
Gscholar
Gscholar
Gscholar
Gscholar
Gscholar
CrossRef | Gscholar
CrossRef | Gscholar
Authors’ Info
Authors’ Affiliation
Núcleo de Estudios Ambientales y Laboratorio de Planificación Territorial, Departamento de Ciencias Ambientales, Universidad Católica de Temuco, Rudecindo Ortega 02950, Temuco (Chile)
Corresponding author
Paper Info
Citation
Pincheira-Ulbrich J (2025). Taxonomic distinctness of climbing plants and epiphytes in central-Chilean forests: an alternative diversity measure from unequal species lists. iForest 18: 283-292. - doi: 10.3832/ifor4693-018
Academic Editor
Francisco Lloret Maya
Paper history
Received: Jul 23, 2024
Accepted: Jul 21, 2025
First online: Oct 20, 2025
Publication Date: Oct 31, 2025
Publication Time: 3.03 months
Copyright Information
© SISEF - The Italian Society of Silviculture and Forest Ecology 2025
Open Access
This article is distributed under the terms of the Creative Commons Attribution-Non Commercial 4.0 International (https://creativecommons.org/licenses/by-nc/4.0/), which permits unrestricted use, distribution, and reproduction in any medium, provided you give appropriate credit to the original author(s) and the source, provide a link to the Creative Commons license, and indicate if changes were made.

Web Metrics
Breakdown by View Type
Article Usage
Total Article Views: 4269
(from publication date up to now)
Breakdown by View Type
HTML Page Views: 1769
Abstract Page Views: 1414
PDF Downloads: 952
Citation/Reference Downloads: 2
XML Downloads: 132
Web Metrics
Days since publication: 279
Overall contacts: 4269
Avg. contacts per week: 107.11
Article Citations
Article citations are based on data periodically collected from the Clarivate Web of Science web site
(last update: Mar 2025)
(No citations were found up to date. Please come back later)
Publication Metrics
by Dimensions ©
Articles citing this article
List of the papers citing this article based on CrossRef Cited-by.
Related Contents
iForest Similar Articles
Research Articles
Bird response to forest structure and composition and implications for sustainable mountain forest management
vol. 19, pp. 18-27 (online: 11 January 2026)
Short Communications
An approach to measuring biodiversity and its use in analysing the effect of nitrogen deposition on woodland butterfly populations in the Netherlands
vol. 2, pp. 46-48 (online: 21 January 2009)
Research Articles
Investigating the effect of selective logging on tree biodiversity and structure of the tropical forests of Papua New Guinea
vol. 9, pp. 475-482 (online: 25 January 2016)
Book Reviews
National forest inventories: contributions to forest biodiversity assessments (2010)
vol. 4, pp. 250-251 (online: 05 November 2011)
Research Articles
The effects of forest management on biodiversity in the Czech Republic: an overview of biologists’ opinions
vol. 15, pp. 187-196 (online: 19 May 2022)
Review Papers
The forest biodiversity artery: towards forest management for saproxylic conservation
vol. 9, pp. 205-216 (online: 26 October 2015)
Short Communications
Biodiversity and ecosystem functioning: exploring large-scale patterns in mainland China
vol. 5, pp. 230-234 (online: 02 October 2012)
Research Articles
Biodiversity conservation and wood production in a Natura 2000 Mediterranean forest. A trade-off evaluation focused on the occurrence of microhabitats
vol. 12, pp. 76-84 (online: 24 January 2019)
Review Papers
Biodiversity assessment in forests - from genetic diversity to landscape diversity
vol. 2, pp. 1-3 (online: 21 January 2009)
Research Articles
Stand structure and deadwood amount influences saproxylic fungal biodiversity in Mediterranean mountain unmanaged forests
vol. 9, pp. 115-124 (online: 08 September 2015)
iForest Database Search
Search By Author
Search By Keyword
Google Scholar Search
Citing Articles
Search By Author
Search By Keywords
PubMed Search
Search By Author
Search By Keyword


