Background, main results and conclusions from a test phase for biodiversity assessments on intensive forest monitoring plots in Europe
iForest - Biogeosciences and Forestry, Volume 2, Issue 2, Pages 67-74 (2009)
doi: https://doi.org/10.3832/ifor0493-002
Published: Mar 18, 2009 - Copyright © 2009 SISEF
Technical Reports
Abstract
The Forest Biodiversity Test phase Assessments (ForestBIOTA) project was carried out on 97 intensive monitoring plots located in 12 European countries. It aimed at the development and test implementation of monitoring methods for forest biodiversity across Europe. More specifically it covered the fields of (i) stand structure, (ii) forest deadwood, (iii) ground vegetation and (iv) epiphytic lichens. A forest type classification was applied in addition. The project took into account policy requirements stated by a number of political processes and institutions including the Convention on Biological Diversity, the Ministerial Conference for the Protection of Forests in Europe, the Environment for Europe Ministerial Conference and the European Union. Whereas detailed results of the assessments are presented in additional publications (Stofer et al. 2007, in prep, Meyer et al. 2007, submitted), this paper draws a number of general conclusions and gives recommendations for future development of forest biodiversity monitoring in Europe.
Keywords
Stand structure, Deadwood, Lichens, Vegetation, Forest types, Forest monitoring, ICP Forests, ForestBIOTA
Introduction
Political background
In response to global concern over the rapid loss of the world’s biodiversity, the Convention on Biological Diversity (CBD) was adopted at the United Nations Conference on Environment and Development (UNCED) in Rio de Janeiro in 1992. Ten years later, the 6th Conference to the Parties of the CBD adopted a global target to reduce the rate of biodiversity loss by 2010 ([8]). This so-called “2010 target” was endorsed at the World Summit on Sustainable Development ([46]). At the fifth Environment for Europe Ministerial Conference in 2003, the participating states committed themselves to the even more ambitious aim of halting the loss of biodiversity by 2010 ([45]). At their 4th Ministerial Conference in Vienna, April 2003, the forestry ministers of Europe and the European Community declared the aim to “further maintain, conserve, restore and, as appropriate, enhance forest biological diversity” ([27]).
Definition of biological diversity
Whereas, at least at a first glance, the message of the political targets and declarations seems to be clear and unambiguous, the term biological diversity is itself characterised by a multitude of definitions. Kaennel Dobbertin ([21]) gives an overview on 27 possible definitions. Taking into account the multitude of different definitions, Larsson ([23]) points to the fact that European forest biodiversity assessments need to take into account structural, compositional and functional key factors. Many authors as well as the CBD stress the relevance of different scales when defining biological diversity, ranging from genetic to species and ecosystem level (e.g. [20], [7], Annex I). The CBD ([7]) defines biological diversity as “the variability among living organisms from all sources including, inter alia, terrestrial, marine and other aquatic ecosystems and the ecological complexes of which they are part; this includes diversity within species, between species and of ecosystems”.
Understanding the problem
On a global level, the loss of biological diversity is beyond doubt ([44]). Current species extinction rates are assumed to be up to 1 000 times higher than those in the fossil record and changes in important components of biological diversity have been more rapid in the past 50 years than at any time in human history ([28]).
When regarding forests at the European level, it is however not so clear whether there is an overall loss of biological diversity as implied by the political declarations. Recent studies on changes in biological diversity focus on different species groups and different time spans. De Heer et al. ([10]) calculated a species population index based mostly on butterfly and bird data as collected by non-governmental organisations (NGOs) for the period of 1970 to 2000. Results for more than 2 000 single time trends showed hardly any changes for woodland and forest habitats, in contrast to e.g. farmlands that had the largest decrease in the population index. National Forest Inventories (NFI) in a number of European countries show increasing deadwood volumes ([5], [13]). In five out of six evaluated NFIs the number of large trees per hectare had increased in the year 2000 as compared to 1980 ([13]). With regard to forest ground floor vegetation, long term observations point to shifts in species composition, possibly triggered by atmospheric nitrogen inputs (e.g. [43], [12], [48], [42]). For most forest monitoring plots in Europe, time series are, however, too short to give information on changes in vegetation composition ([38], [40]). The epiphytic lichen flora in central Europe has reacted to decreasing sulphur inputs. As a consequence many species have become common again and shifts in species communities have been observed (e.g. [47], [49], [41], [50], [19]). The list of studies reflecting temporal development of single components of forest biological diversity in Europe could easily be extended but does not at all reveal an unambiguous picture. Against this political and scientific background the need for reliable and harmonized data on status and trends of key components of biological diversity in European forests is obvious.
Current indicator schemes and monitoring systems
In view of the multiple different definitions and facets of biological diversity, indicators are necessary to monitor biological diversity in Europe. The Ministerial Conference for the Protection of Forests in Europe (MCPFE) has set up “Improved Pan-European Indicators for Sustainable Forest Management” ([26]). The MCPFE is co-operating with the CBD to contribute to the regional implementation of its decisions on forest biological diversity, and is also cooperating with the Environment for Europe process ([27]). The MCPFE indicators are thus a main basis for the monitoring of the “2010 target” in European forests. This indicator catalogue includes nine indicators related to biological diversity in forest ecosystems.
National Forest Inventories (NFI) are usually the most detailed sources for forest related information at the large scale. Traditionally, they were mostly designed with regard to forest management and wood production considerations. However, especially in countries with recently updated NFIs, biological diversity plays an increasingly important role (e.g. [36], [6]). Within a feasibility study for the ForestBIOTA project and based on an overview by the European Commission ([14]), Fischer ([17]) conducted a review of NFI methods for 15 European countries specifically with respect to forest biological diversity monitoring. General tree information like species, age, dbh and height were core contents of all reviewed NFIs, although not based on methods harmonized across country borders. Nine NFIs provided information on ground floor vegetation, which was however in almost all cases aggregated into nationally defined groups mainly aiming at describing site types. Comprehensive species lists were only available for tree species. Some kind of deadwood information was available in 9 out of 15 NFIs, although even less comparable than the general tree information (see also [33], [37]).
The International Co-operative Programme on Assessment and Monitoring of Air Pollution Effects on Forests (ICP Forests) is one of the main data providers for the MCPFE indicators. The programme operates under the umbrella of the UNECE Convention on Long-range Transboundary Air Pollution in close co-operation with the European Union (EU). It is the only terrestrial monitoring system that provides trans-nationally harmonized data on European forests for a larger number of countries ([1]-2006). Intensive Monitoring started in the 1990s and is today carried out on more than 800 so-called Level II sites, selected in the most important forest ecosystems of 29 participating countries ([11], [18], [24]). Originally set up for the monitoring of air pollution effects, the results of the monitoring programme today also cover links to additional important fields of forest policy such as climate change, sustainable forest management and aspects of forest biodiversity ([18], [17]). In 2002, the programme’s Task Force agreed to a test phase aiming at specifying the possible contributions of the programme in the field of biodiversity assessments ([22]).
ForestBIOTA setup
Under the umbrella of the ICP Forests Expert Panel on Biodiversity and Ground Vegetation Assessments and co-financed by the European Commission under the Regulation (EC) No 2152/2003 (Forest Focus), 12 European countries participated in the project “Forest Biodiversity Test phase Assessments” (ForestBIOTA). The plot selection was carried out by the participating countries according to national interests and was not steered centrally. National experts conducted related field assessments in 2004 and 2005 on 97 plots (Tab. 1, Fig. 1, Tab. 2). The aims of the project were (i) the further development and test implementation of monitoring methods for different aspects of forest biodiversity, (ii) correlative studies in order to determine relationships between some compositional, structural and functional key factors of forest biodiversity and (iii) to give recommendations for forest biodiversity indicators and surrogates that can be applied in the context of large scale inventories. Existing intensive monitoring (Level II) plots of the ICP Forests programme were the basis for the activities. Taking into account the MCPFE indicators, existing data and the possibilities of the ICP Forests programme as well as additional scientific recommendations ([25]), the project focussed on monitoring methods for (i) stand structure, (ii) deadwood, (iii) forest type, (iv) epiphytic lichens, and (v) ground vegetation.
Tab. 1 - Countries, plots and assessments carried out within the ForestBIOTA project.
| Country | No. of plots | No. of plots with assessment of | |||||
|---|---|---|---|---|---|---|---|
| Structure estimates |
Deadwood | Ground vegetation | Tree data | Lichens | Forest type classification |
||
| Czech Republic | 3 | 3 | 3 | 3 | 3 | 3 | 3 |
| Denmark | 4 | 4 | 4 | 3 | 4 | 4 | 4 |
| Finland | 9 | 8 | 8 | 8 | 9 | 8 | 8 |
| France | 5 | - | - | - | - | 5 | 5 |
| Germany | 20 | 20 | 20 | 20 | 19 | 19 | 20 |
| Greece | 4 | 4 | 4 | 4 | 2 | - | 4 |
| Italy | 12 | 12 | 12 | 12 | 12 | 12 | 12 |
| Slovak Republic | 3 | 3 | 3 | 3 | 3 | 3 | 3 |
| Spain | 12 | 11 | 12 | 12 | 12 | 7 | 12 |
| Switzerland | 17 | 17 | 17 | 16 | 17 | 17 | 17 |
| The Netherlands | 5 | - | 5 | 5 | 5 | 5 | 5 |
| Ukraine | 3 | - | 3 | 3 | 3 | - | 3 |
| Total | 97 | 82 | 91 | 89 | 89 | 83 | 96 |
Fig. 1 - Design of a ForestBIOTA plot.
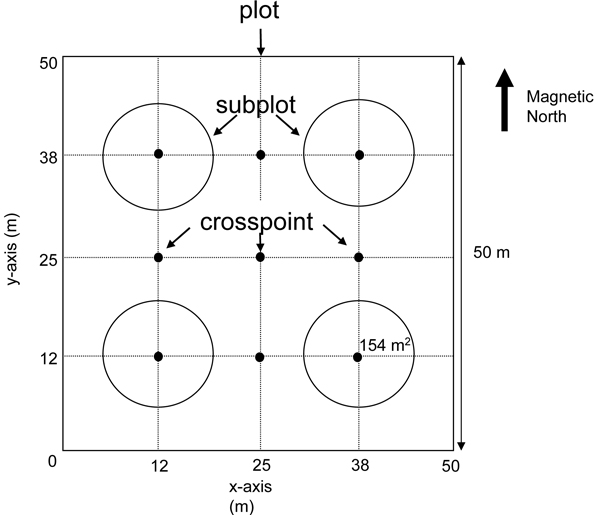
Tab. 2 - Assessment units and assessments.
| Assessment unit | Related assessment |
|---|---|
| Plot (2500 m2) |
Forest type classification |
| Stand structure (tree coordinates, breast height diameter, some tree heights, stand structural estimates) | |
| Epiphytic lichen assessments (selection of at least 12 trees) | |
| Deadwood (standing deadwood, dead downed trees) | |
| Ground vegetation (species list only) | |
| Subplot (400 m2) |
Ground vegetation (species list with abundance) |
| Subplot (154 m2) |
Deadwood (lying deadwood pieces, stumps) |
Materials, methods and results
Data and data handling
Data management was carried out centrally at the Johann Heinrich von Thünen-Institute (vTI), Institute for World Forestry in Hamburg, Germany. A web-based MySQL database management system (DBMS) enabled the National Focal Centres to submit the data via internet. Optional online or offline work was allowed by a Java-Web-Start application. Validated raw data comprised information on 20 506 trees, 5 128 deadwood pieces, 5 369 epiphytic lichen records and 16 016 ground vegetation occurrences. Derived data like plotwise calculated diversity indicators for stand structure, deadwood, epiphytic lichens and ground vegetation were also stored in the central data base.
Forest types
Each plot was classified following the principles regarding the forest type system developed by the European Environment Agency ([4]). The development of the European forest type system was ongoing at the time when the ForestBIOTA project was carried out. Therefore, the system adopted within ForestBIOTA (Tab. 3) was somewhat different from the final system reported by Barbati et al. ([4]), even though the principles of categorization are the same. The ForestBIOTA classification applies to forests as defined within the Temperate and Boreal Forest Resources Assessment 2000 (TBFRA) and European Nature Information System (EUNIS) with the main criteria of 10% tree crown cover, minimum height of 5m at tree maturity and at least 0.5ha size. In accordance with EUNIS and TBFRA-2000, two levels were used in ForestBIOTA. The first level was based on four main classes (broadleaved deciduous woodlands, broadleaved evergreen woodlands, coniferous woodlands, mixed broadleaved and coniferous woodlands). The second level was based on 28 classes mostly corresponding to aggregations of EUNIS III level types following Barbati et al. ([3]) (Tab. 3). The classification was mostly carried out based on expert knowledge. Extra field visits were not necessary.
Tab. 3 - Forest type nomenclature within the ForestBIOTA project.
| Forest type code |
Forest category |
Forest type |
|---|---|---|
| FT1A | Broadleaved deciduous woodland | Broadleaved deciduous plantations |
| FT1N.1 | Fluvial and riparian woodland | |
| FT1N.2 | Broadleaved swamp woodland | |
| FT1N.3a | Lowland beech forest | |
| FT1N.3b | Mountain mixed beech forest | |
| FT1N.4 | Thermophilous deciduous woodland | |
| FT1N.5 | Acidophilous oak-dominated woodland | |
| FT1N.6 | Non-riverine woodland of pioneer species (birch/aspen/rowan/hazel/alder) | |
| FT1N.7 | Meso- and eutrophic oak; hornbeam; ash; sycamore; lime; elm and related woodland | |
| FT1N.8 | Mountain birch forest | |
| FT2A | Broadleaved evergreen woodland | Broadleaved evergreen plantations |
| FT2N | Natural and semi-natural broadleaved Mediterranean and Macaronesian sclerophyllus woodland | |
| FT3A | Coniferous woodland | Coniferous plantations |
| FT3N.1 | Fir and spruce woodland | |
| FT3N.2 | Alpine larch-Arolla and mountain pine woodland | |
| FT3N.3 | Scots pine woodland | |
| FT3N.4 | Black pine; Mediterranean and Macaronesian pines or pine-juniper woodland | |
| FT3N.5 | Coniferous woodland dominated by Cupressaceae or Taxaceae | |
| FT3N.6 | Taiga woodland | |
| FT3N.7 | Bog conifer woodland | |
| FT4A | Mixed broadleaved and coniferous woodland | Mixed forestry plantations |
| FT4N.1 | Mixed swamp; taiga and sub-taiga woodland | |
| FT4N.2 | Hemiboreal forest | |
| FT4N.3 | Mixed broadleaved evergreen and coniferous (pines/Cupressaceae/Taxaceae) woodland | |
| FT4N.4 | Mixed deciduous woodland with Cupressaceae or Taxaceae | |
| FT4N.5 | Mixed fir-spruce-beech woodland | |
| FT4N.6 | Mixed non-riverine deciduous and coniferous woodland | |
| FT4N.7 | Mixed Mediterranean pine - thermophilous oak woodland |
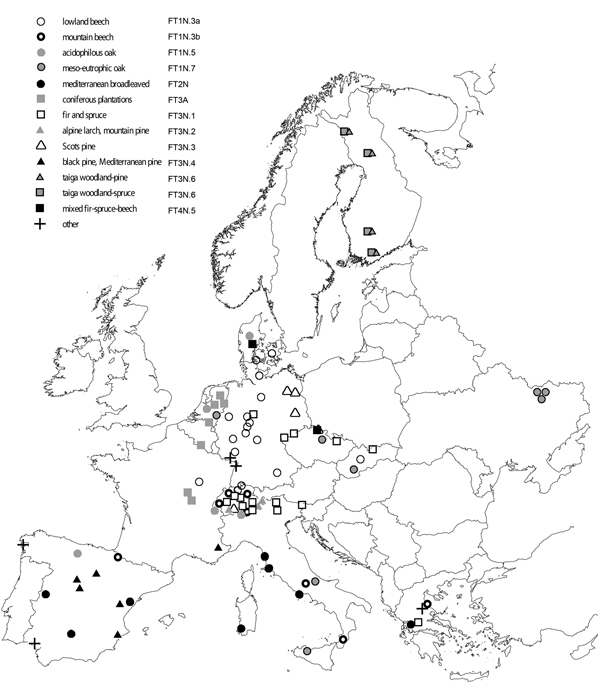
Some 45% of the plots (43 plots) were coniferous woodlands, 42% (40 plots) were broadleaved deciduous forest, 8% (8 plots) were broadleaved evergreen woodland while just 3% (3 plots) were mixed broadleaved and coniferous woodland. Two plots in Spain could not be classified using the forest type system applied. One of these plots was in a coastal habitat (EUNIS code B1.7) and the other one was a Pinus pinaster forest in the Atlantic region. Out of a total potential number of 28 forest types, 15 types were represented in the ForestBIOTA dataset. The most frequent forest type was “lowland beech forests” (17 plots) located in the continental region of Europe, mainly in Germany, France and Switzerland, followed by “fir and spruce woodlands” (15 plots) located in the alpine, continental and Pannonic regions, mainly in Italy, Switzerland, the Czech Republic and Slovakia. Eight plots were classified as “mountain mixed beech forest” (Fig. 2, Tab. 4).
Fig. 2 - Location and forest types of the investigated plots.
Tab. 4 - Frequency of different forest types within the ForestBIOTA project.
| Forest type | No. of plots |
|---|---|
| Acidophilous oak-dominated woodland | 5 |
| Alpine larch-Arolla and mountain pine woodland | 3 |
| Black pine; Mediterranean and Macaronesian pines or pine-juniper woodland | 6 |
| Coniferous plantations | 8 |
| Fir and spruce woodland | 15 |
| Fluvial and riparian woodland | 1 |
| Hemiboreal forest | 1 |
| Lowland beech forest | 17 |
| Meso- and eutrophic oak; hornbeam; ash; sycamore; lime; elm and related woodland | 8 |
| Mixed fir-spruce-beech woodland | 1 |
| Mountain mixed beech forest | 8 |
| Natural and semi-natural broadleaved Mediterranean and Macaronesian sclerophyllus woodland | 8 |
| not defined | 2 |
| Scots pine woodland | 4 |
| Taiga woodland | 8 |
| Thermophilous deciduous woodland | 1 |
| Total | 96 |
Other surveys
Methods and results of the epiphytic lichen and ground vegetation assessments are presented in detail by Stofer et al. (2007, in prep.). Methods and results of the stand structural and deadwood assessments are presented in detail by Meyer et al. (2007, submitted).
Discussion
Whereas the specific results of the single surveys are discussed by Stofer et al. (2007, in prep.) and Meyer et al. (2007, submitted), this paper aims at drawing the main conclusions related to the assessed parameters and their interrelations, related to the further development of forest biodiversity monitoring in Europe.
Constraints, benefits and appraisal of correlative studies
Forest type classification
Forest types are a flexible approach to collect and organize information on forests of a given territory, according to a typology useful for understanding differences in the character of forest ecosystems which are relevant to a specific application: e.g. evaluation of forest productivity, determination of structure and composition of potential natural vegetation, presentation of more precise forest information in a proper ecological context. Because forest types enable a comparison of ecologically similar forests, they are meaningful units for stratification and reporting of field data, especially concerning the assessment of forest biodiversity variables. ForestBIOTA results support this evidence since forest type information proved to have a strong explanatory power as classifier in many of the correlative tests carried out.
European forests are very heterogeneous in structure and composition and function; the application of a standardized system of nomenclature allows the reporting of complex data, like forest biodiversity indicators, into logical, understandable and comprehensive units. The forest type system of nomenclature adopted in the ForestBIOTA project is linked to the recently issued proposal for European forest types ([4]) derived by an international consortium of experts aimed at providing also the MCPFE with an user friendly forest type classification. A first proposal of forest type for biodiversity assessment was provided by the BEAR project ([3]).
Forest biodiversity monitoring greatly benefits from a forest type based assessment, as forest biodiversity indicators increase their specifity when referenced to a proper ecological background. Accordingly, biodiversity data quality increases allowing an improved data evaluation, understanding and reporting.
Stand structure
Stand structure is by many authors perceived as a core item of forest biodiversity. However, results of studies on the relationship between forest structure and species diversity differ considerably ([30], [31], [32], [29]). Thus, general deductions have to be proved carefully with respect to the underlying factors. Stand structure is rather directly influenced by forest management. Scientific knowledge on its implication for different species groups and functions is therefore essential for the development of close-to-nature silvicultural treatments. The ForestBIOTA project has contributed to the development of appropriate tools for the assessment of forest structure at the stand level by testing and recommending suitable indicators.
On the observed plots, ground vegetation and epiphytic lichens with their different environmental requirements showed different relationships to stand structure. There were hardly any correlations between structural parameters and species richness and evenness of ground vegetation (Stofer et al., in prep.). There were, however, relationships between canopy closure, stand age, basal area and standard deviation of dbh on one side and the scores of detrended correspondence analysis (DCA) axes for ground vegetation species composition on the other. On the plots observed across Europe, geographical factors and site factors such as latitude, longitude, altitude and soil pH were more closely related to ground vegetation parameters as compared to the above mentioned stand structural indicators. As concerns epiphytic lichens, clustered horizontal tree distribution was consistently linked to species richness and evenness of both macro-lichens and crustose lichens. Summarizing, it can be concluded that there are a number of significant relationships between stand structure and species diversity of epiphytic lichens and ground vegetation. However, on the European scale they are overlaid by the stronger effects of the geographical influences and they are masked by the significant differences species diversity on the plots scattered across Europe. These differences also explain the fact that there are no single and straightforward relationships. Neither is there one single target or effect parameter, and the relationships depend on the selection of indicators. The situation is even more complex because stand structure is regarded as a relevant key factor for many other species groups not covered by the ForestBIOTA project. Thus, the aim of present and future correlative studies can only in exceptional cases be to give silvicultural recommendations in order to enhance diversity of certain species groups. The ecological net is too complex for such an undertaking. However, the methods and parameters developed within the project can be used to relate and compare specific forest stands to reference forests identified e.g. in the context of a naturalness classification, or to follow the temporal development of the structural diversity in European forests.
Deadwood
There is no doubt that deadwood is an essential parameter for monitoring of forest biodiversity and also plays a role for carbon sequestration. Even though it may hardly be possible to come up with any particular amount of deadwood that is desirable at the forest stand level ([34]), it is obvious that from an ecological point of view the main aim of forest management in most regions of Europe is to increase deadwood volumes. The specific monitoring method applied within the ForestBIOTA project is recommended for intensive monitoring plots and may need to be adjusted for application in e.g. NFIs. However, the deadwood components and measurement thresholds of ForestBIOTA may be identical in other inventories so that the volumes can easily be compared per hectare.
Ground vegetation
Correlations between ground vegetation and a number of measured environmental parameters like altitude, latitude, longitude, soil pH, and deposition are in line with studies based on a larger number of Level II plots ([39]). ForestBIOTA data now allow comparing the relationships of these environmental and stand structural parameters to classical diversity indicators such as species number and evenness on the one hand and to Ellenberg indicators or scores of DCA on the other. The results show, in general, that the latter relationships were the most significant ones and thus that it is easier to interpret derived ecological species information as expressed by Ellenberg indicator values or even DCA scores instead of species numbers. In other words, species composition is more expressive than species numbers because ground vegetation depends on even more factors like the recent and historic disturbance regime or floristic influences from adjacent areas or the surrounding landscape. Overall, the project substantiated ground vegetation as a valuable bioindicator and thus justified its large scale assessment e.g. in ICP Forests and the BioSoil project.
Epiphytic lichens
The main achievement within the lichen component of the ForestBIOTA project was the development and successful implementation of a harmonized monitoring method applicable in forests from the Arctic Circle to the Mediterranean. Well known correlations of epiphytic lichen diversity parameters to geographical parameters, deposition and stand structure were largely confirmed. Compared to ground vegetation, epiphytic lichens depend more directly on the trees and the stand structure, thus it is in line with expectations that they show closer relationships to stand structure than plants growing on the forest floor.
Identification of thematic areas for forest biodiversity monitoring
The first basic achievement of ForestBIOTA is the selection of five thematic areas relevant and feasible for monitoring forest biodiversity in a large number of countries in Europe and over a large geographical scale, namely deadwood, stand structure, ground vegetation, forest type classification, and epiphytic lichens. Related projects that were initiated after ForestBIOTA have already built on this experience by making a similar selection of basic parameters. Within the COST action E43 (Harmonisation of National Forest Inventories in Europe: Techniques for Common Reporting), the working group on biodiversity selected very similar core variables related to the use of data collected by National Forest Inventories for forest biodiversity assessments in Europe. This selection of core variables was as well based on a questionnaire compiled by the NFI delegates of 27 European countries participating in COST action E43 (Chirici et al. 2007, submitted). On the large scale, the BioSoil project was initiated by the European Commission under the Forest Focus regulation (No 2152/2003). It also includes stand structure, deadwood, and ground vegetation assessments as well as a forest type classification to be assessed on around 4 000 plots across Europe. Thus, it builds directly on the ForestBIOTA project.
Standardisation of monitoring methods
The project succeeded in the development of standardized monitoring methods for five thematic areas on intensive monitoring plots, which is a success in itself taking into account the participation of experts from 12 countries. The main motivation for national experts to agree on these methods was the interest in transnationally comparable results. In general there appear to be two main directions for future harmonisation of forest monitoring and inventory activities across Europe: (i) the application of standardized methods or (ii) the continuation with national protocols but with a quantification of the deviations from a reference method. In the first case a parallel assessment of existing and new methods is recommended in order to relate existing national results to the new ones conducted with standardized methods. Within ForestBIOTA this was carried out in the field of lichen assessments in a number of countries. The second option is followed by the COST action E43 with the definition of so called “bridging functions” able to translate data referred to national methods and definitions to an agreed international “reference” ([9]). Another approach in this context has been proposed by Requardt et al. ([35]) who used reference information from ICP Forests plots, CORINE Land Cover images or high resolution remote sensing data to calibrate existing NFI data.
Implementation of European-wide monitoring
It has been shown that the newly developed methods were fully functional. The assessments were largely implemented within one summer field season. This reflects the high national interest in biodiversity assessments which was also encountered in other phases of the project. Also, the monitoring programme of ICP Forests, which is one of the largest of its kind world-wide ([18]), has shown the flexibility and adaptability to react towards new user needs. The required experts for ground vegetation and epiphytic lichens were available in almost all countries. Only in one case were lichenologists employed from another project partner. Over large areas of Europe lack of expertise is not in general an argument against biodiversity assessments.
The ForestBIOTA project was carried out on plots subjectively selected by the participating countries following national interests and possibilities on already existing Level II plots. Data and results reflect a rather heterogeneous purposive sample covering a wide variety of different forest types from hemiboreal to nemoral and open meridional forests. Results can therefore certainly not claim to be statistically representative at the European scale and the trends described only apply for the evaluated plots. Limitations as described by Ferretti & Chiarucci ([16]) for the sampling strategy of the complete set of Level II plots certainly apply for the ForestBIOTA plots as well. The integrated analysis of the data are regarded as pilot studies showing a number of very plausible trends, encouraging a repetition of the analyses based on a forest biodiversity monitoring system which will be based on an improved sampling strategy. Such an improved sampling strategy is foreseen to be implemented within present and future projects to be carried out under the LIFE+ regulation (EC No 614/2007). This includes actions targeted at “restructuring of existing monitoring and inventorying networks” (FACTS project, unpublished proposal). It also includes links to a newly created representative and large scale monitoring system based on Level I plots and national forest inventories which is currently developed under the FutMon project ([2]). In this sense, the examined data set and the presented pilot studies may outline the direction for further correlative enquiries. These should specifically focus on single forest types, which are of more interest compared to European mean values and which could not be tackled at present due to the small plot number.
The Level II plots offer a unique possibility to analyse data in terms of cause-effect relationships, because the data from different topic areas are collected at the same sites. This in not so in many case studies based on a lot of different nature reserves or forest reserves, or different NATURA 2000 sites.
Even though the implementation phase is primarily seen as having been a test for the methodology, the data gathered contribute valuable information on the state and processes of biological diversity on the intensive (Level II) monitoring plots. The data are regarded as baseline information against which results of future assessments on the same plots can be compared and interpreted.
Recommendations for the operational level
The ICP Forests infrastructure including the Level II plots is a good basis for the further development of monitoring. However, with respect to biodiversity the set of plots with ForestBIOTA assessments needs to be amended, specifically with plots located in mixed forests.
Additional monitoring related to other compartments of the forest ecosystems needs to be developed and implemented. The ICP Forests experts in collaboration with experts from NFIs have already started discussions in this respect; the process needs to be carried on and needs appropriate financing. The LIFE+ regulation is seen as an important financial instrument in this respect, as it aims at both the “monitoring and assessment of nature and biodiversity” and the assessment of “the factors, pressures and responses that impact on the state of the environment”.
Present activities are mostly focussed on the stand level. Closer links to existing landscape level activities and possibilities need to be established. As concerns the genetic level, there exists at present little activity or knowledge. Level II plots provide a unique basis to proceed in this direction. The MCPFE criteria and indicators for sustainable forest management remain a main guideline for the identification of fields for additional monitoring.
ForestBIOTA assessments need to be repeated on the same plots. The application of comparable assessments on the much larger number of Level I plots as a logical next step is already ongoing within the BioSoil project. Links to the NFIs need to be intensified in order to ensure comparable data collection on denser national grids.
Conclusions
Results based on around 90 subjectively selected intensive monitoring plots across Europe and focussing on a small selection of key factors may still not allow us to make a statement on policy targets like the “2010 target” to halt the loss of biodiversity. However, the development of forest monitoring is progressing dynamically and ForestBIOTA can be considered as an important contribution. The “2010 target” is a policy aim and can certainly not be directly implemented on the operational level. As concerns European forests, it is not even sure whether the implication of biodiversity loss is valid. It depends very much on (i) the time spans, (ii) the spatial scale and region and (iii) the key factor under observation. The policy focus on biodiversity has rightly created strong support for monitoring and scientific action in this field at various levels, because forest biodiversity is too complex to be already understood in enough detail.
Among all the assessments and evaluations that have been carried out and that will be carried out in future projects it is essential not to lose sight of the policy needs. A differentiated picture has to be developed by the scientists and experts, and monitoring is needed to provide data in sufficient spatial and temporal resolution, which is a complex undertaking. However, monitoring activities need inter alia to produce aggregated interpretations that are understandable to policy makers. When scientific concepts are made operational through the political process, robust simplifications are inevitable ([15]). Scientists themselves need to participate in this process, because if the scientists do not do the job, others will.
Acknowledgements
The authors wish to express their thanks to the national experts who contributed to the method development, who were responsible for data collection in the field and who stimulated the evaluations. The teams were led by Mr. Václav Buriánek (Czech Republic), Mrs. Annemarie Bastrup-Birk and Jacob Heilmann-Clausen (Denmark), Maija Salemaa and Tiina Tonteri (Finland), Mr. Erwin Ulrich and Mr. Olivier Daillant (France), Mr. Ulrich Matthes, Mr. Joachim Block, Mr. Marcus Schmidt, Mr. Henning Meesenburg, Mr. Gerhard Raben, Mr. Claus Schimming, Ms. Angela Steinmayer, and Mr. Lutz Genssler (Germany), Mr. George Baloutsos and Ms. Evangelia Daskalakou (Greece), Mr. Bruno Petriccione (Italy), Mr. Gerard Grimberg and Mr. Han van Dobben (The Netherlands), Mr. Gerardo Sanchez Peña and Ms. Mayte Minaya (Spain), Jozef Vladovic, Roman Longauer, and Jozef Istona (Slovak Republic), Mr. Norbert Kräuchi (Switzerland), and Mr. Igor Buksha (Ukraine). The project was co-financed by the European Commission under the Forest Focus regulation (EC No 2152/2003). We are grateful to Nicholas Clarke for linguistic improvements.
References
Gscholar
Gscholar
Gscholar
CrossRef | Gscholar
Gscholar
Gscholar
Gscholar
Gscholar
Gscholar
Gscholar
Gscholar
Gscholar
Gscholar
Gscholar
Gscholar
Authors’ Info
Authors’ Affiliation
Northwest-German Forestry Research Station, Göttingen (Germany)
Swiss Federal Research Institute WSL, Birmensdorf (Switzerland)
University of Firenze (Italy)
University of Tuscia, Viterbo (Italy)
Corresponding author
Paper Info
Citation
Fischer R, Granke O, Chirici G, Meyer P, Seidling W, Stofer S, Corona P, Marchetti M, Travaglini D (2009). Background, main results and conclusions from a test phase for biodiversity assessments on intensive forest monitoring plots in Europe. iForest 2: 67-74. - doi: 10.3832/ifor0493-002
Academic Editor
Marco Borghetti
Paper history
Received: Nov 12, 2008
Accepted: Feb 24, 2009
First online: Mar 18, 2009
Publication Date: Mar 18, 2009
Publication Time: 0.73 months
Copyright Information
© SISEF - The Italian Society of Silviculture and Forest Ecology 2009
Open Access
This article is distributed under the terms of the Creative Commons Attribution-Non Commercial 4.0 International (https://creativecommons.org/licenses/by-nc/4.0/), which permits unrestricted use, distribution, and reproduction in any medium, provided you give appropriate credit to the original author(s) and the source, provide a link to the Creative Commons license, and indicate if changes were made.

Web Metrics
Breakdown by View Type
Article Usage
Total Article Views: 56729
(from publication date up to now)
Breakdown by View Type
HTML Page Views: 45427
Abstract Page Views: 4812
PDF Downloads: 4963
Citation/Reference Downloads: 54
XML Downloads: 1473
Web Metrics
Days since publication: 6325
Overall contacts: 56729
Avg. contacts per week: 62.78
Article Citations
Article citations are based on data periodically collected from the Clarivate Web of Science web site
(last update: Mar 2025)
Total number of cites (since 2009): 13
Average cites per year: 0.76
Publication Metrics
by Dimensions ©
Articles citing this article
List of the papers citing this article based on CrossRef Cited-by.
Related Contents
iForest Similar Articles
Review Papers
Linking deadwood traits with saproxylic invertebrates and fungi in European forests - a review
vol. 11, pp. 423-436 (online: 18 June 2018)
Research Articles
Dead wood and stand structure - relationships for forest plots across Europe
vol. 7, pp. 269-281 (online: 14 April 2014)
Research Articles
Assessing forest resilience after windthrow: linking deadwood, regeneration, and landscape-scale susceptibility - A case study in a Pre-Alpine forest in Italy
vol. 19, pp. 102-113 (online: 07 April 2026)
Research Articles
Scale dependency of the effects of landscape structure and stand age on species richness and aboveground biomass of tropical dry forests
vol. 16, pp. 234-242 (online: 23 August 2023)
Research Articles
Stand structure and deadwood amount influences saproxylic fungal biodiversity in Mediterranean mountain unmanaged forests
vol. 9, pp. 115-124 (online: 08 September 2015)
Research Articles
Long-term dynamics of stand structure and regeneration in high-stocked selection fir-beech forest stand: Croatian Dinarides case study
vol. 14, pp. 383-392 (online: 24 August 2021)
Review Papers
The forest biodiversity artery: towards forest management for saproxylic conservation
vol. 9, pp. 205-216 (online: 26 October 2015)
Research Articles
Consistency among forest structure and biodiversity potential index (IBP): an assessment of stand structural complexity for floodplain poplar woodlands
vol. 18, pp. 335-343 (online: 04 November 2025)
Research Articles
Bird response to forest structure and composition and implications for sustainable mountain forest management
vol. 19, pp. 18-27 (online: 11 January 2026)
Research Articles
Exposure elevation and forest structure predict the abundance of saproxylic beetles’ communities in mountain managed beech forests
vol. 16, pp. 155-164 (online: 08 June 2023)
iForest Database Search
Search By Author
Search By Keyword
Google Scholar Search
Citing Articles
Search By Author
Search By Keywords
PubMed Search
Search By Author
Search By Keyword


