A resource capture efficiency index to compare differences in early growth of four tree species in northern England
iForest - Biogeosciences and Forestry, Volume 10, Issue 2, Pages 397-405 (2017)
doi: https://doi.org/10.3832/ifor2248-010
Published: Mar 24, 2017 - Copyright © 2017 SISEF
Research Articles
Abstract
At a trial established in Cumbria, northern England, significant differences in growth rate between tree species were apparent, with cider gum (Eucalyptus gunnii) and alder (Alnus glutinosa) exhibiting most rapid volume and biomass accumulation. Estimations were made of leaf area, specific leaf area, leaf area ratio (based on stem mass not whole tree mass) and length of growing season. These measurements were undertaken to explain tree growth difference and developing a growth potential index based on growing season length and leaf area. The high leaf area of cider gum and alder explained some of their superior growth, while alder also had the longest period in leaf, compared with ash (Fraxinus excelsior) and sycamore (Acer pseudoplatanus). The slow growth of ash can be explained by the short period in leaf and also the relatively low leaf area ratio. Leaf area to stem weight also differed between species with that of ash being relatively low. Specific leaf area was also low for ash, a trait shared with cider gum, which suggests that these species invest highly in each unit of leaf area. Of the tree species assessed, the length of the growing season was longest for alder, enabling it to maintain growth for a longer period. By multiplying growing season by leaf area a resource capture index was calculated and this explained 56% of the variation in stem dry weight between trees. The potential and limitations for using this index are discussed.
Keywords
Fraxinus excelsior, Acer pseudoplatanus, Resource Capture Efficiency
Introduction
This paper compares the early growth at a trial in northern England of four broadleaved trees species identified as having potential for short rotation forestry ([15]). Short rotation forestry for bioenergy was identified as a cost-effective and rapid means of reducing greenhouse gases ([22]), yet there is very limited experience of such systems in the UK. While quantifying yields from tree species in short rotation forestry systems is crucial, understanding the underlying factors contributing to their productivity is also important. Yield varies considerably between tree species and on a specific site is dependent on their resource capture efficiency and resource use efficiency ([35]). Resource capture efficiency represents how efficiently a tree is able to allocate its resources to harvesting light for photosynthesis. There are two components: leaf mass fraction (LMF) and specific leaf area (SLA - [29]). LMF (the ratio of leaf dry mass to total plant dry mass) reflects the priority of allocation of photosynthate to the leaves. Differences in LMF exist among tree species, with higher LMF being an attribute of faster growing trees ([29]) and also shade bearing trees ([38]). LMF is higher in evergreen than deciduous trees but this is partly because evergreen trees retain leaves for two or more years ([29]). This higher LMF in evergreens may therefore be largely because of the lifespan of the leaf rather than higher partitioning of annual photosynthate to leaves ([29]).
SLA reflects the amount of resources allocated to each unit of leaf area and is the ratio of leaf area to leaf dry mass. SLA is generally higher in conifers, compared with broadleaves and higher in fast growing trees that those that are slow growing. A meta-analysis undertaken by Poorter et al. (2009 in [29]) found differences in SLA between types of trees were greater than for LMF. High SLA is a characteristic of plants that have a high relative growth rate (RGR), small seed mass and both RGR and SLA were good predictors of a plant’s potential invasiveness. Leaf area ratio (LAR) is a variable that combines LMF and SLA, being the ratio between leaf area and total tree weight and strongly influences RGR, particularly on nutrient rich sites ([27]).
Growth of a tree is also influenced by the duration of its growing season. The length of growing season has a strong influence on a tree’s productivity and differences exist among species, origins and individual trees in terms of their period of dormancy. The dormancy in pioneer trees is largely determined by temperature, rather than photoperiod. In contrast, late successional trees follow a more conservative approach, requiring a longer period of chilling and are highly sensitive to photoperiod ([6]). Nutrition has also an influence on period of dormancy; tree species with enhanced access to nutrients, including nitrogen fixing trees like alder adopt a higher risk approach to the development of their foliage, in a similar way to pioneer trees ([36]).
At this trial, growth was measured but also attributes important in influencing this growth were quantified, and these were compared between the tree species. A resource capture efficiency index was devised (leaf area × period in leaf) and its relationship to stem volume was investigated. Results are compared with those of other researchers and differences observed between the tree species explained by their ecology.
The hypotheses tested were that: (i) there were differences in volume and biomass growth, SLA and LAR between the tree species at the trial; (ii) growth of stem volume was positively related to leaf area and growing season; (iii) the differences in growth between individuals and species can be explained by their resource capture efficiency and other aspects of their ecology.
Materials and methods
Experimental design
A one hectare trial was established at Newton Rigg, Cumbria, England (55o 40′ 56″ N, 02o 47′ 22″ W) at an elevation of 160 m above sea level. Ash (Fraxinus excelsior), sycamore (Acer pseudoplatanus) and alder (Alnus glutinosa) were planted in winter 2008 and cider gum (Eucalyptus gunnii) and shining gum (Eucalyptus nitens) in April 2009. Excluding the eucalypts, species selected for the trial were all classified by EMIS ([26]) as being “suitable”, rather than “very suitable” or “unsuitable” for the site. The transplants were cell grown 20-40 cm plants raised by Alba Trees in the Scottish borders and origins are described in Tab. 1, along with recommended origins for the species.
Tab. 1 - Origins of trees used in the trial and recommendations for the origins. A map of regions of provenance (Zones) for Great Britain is available in Forestry Commission ([13]). Recommendations from: (1): Worrell ([43]); (2): Hubert & Cundall ([16]); (3): J. Purse, pers. comm.; (4): Evans ([12]); (5): Cope et al. ([11]).
| Species | Origin | Recommendations |
|---|---|---|
| Alder | Zone 108, South west Scotland | Use British provenances 1 |
| Ash | Zone 108, South west Scotland | Seed stand material or material slightly to the south of planting site 2 |
| Birch | Zone 202, central to north east Scotland |
Avoid origins from long distances away from the planting site (slightly southern/ eastern locations seems to give more rapid growth) 2 |
| Cider gum | Likely to be from a seed stand at Dipton, New Zealand 3. Original origin unknown. | Origins from Lake McKenzie and Mount Cattley, Tasmania perform particularly well 4-5 |
| Shining gum | Likely to be from a seed stand at Dipton, New Zealand 3. Origin Central Victoria | Victoria provenances are most frost hardy 4 |
| Sycamore | Zone 403, Midlands, England | Most British provenances grow well at most sites. May increase productivity by using origins from sites slightly to the south of the planting site 2 |
Aspects of the climate at the trial were obtained from the weather station at the Newton Rigg campus and from the Establishment Management Information System (EMIS - [26]) and are shown in Tab. 2.
Tab. 2 - Climate at the trial from: (1) the Establishment Management Information System (EMIS); and (2) from 1971 to 2000 average data from the Newton Rigg weather station ([23], except for minimum temperature, which is from [24]). (AT5): accumulated temperature above 5 °C; (CT): continentality; (DAMS): detailed aspect method of scoring; (MD): moisture deficit. A detailed description of these variables is found in Pyatt et al. ([33]). Annual rainfall = summer rainfall + winter rainfall.
| Parameter | Value |
|---|---|
| AT51 (degrees yr-1) | 1503.4 |
| CT1 (°C) | 6.3 |
| DAMS1 | 14 |
| MD1 (mm) | 148.2 |
| Summer Rainfall (mm)1 | 386.4 |
| Winter Rainfall (mm)1 | 396.2 |
| Mean Min Temp (°C)2 | 0.4 (Jan) |
| Min Temp (°C)2 | -14oC |
| Frost days2 | 57.6 |
| Mean Max Temp (°C)2 | 19.4 (Jul) |
The trial site was originally grass pasture, the soil being a slightly acid (pH 6.0) clay loam brown earth. Soil bulk density was 0.76 at 0 cm to 15 cm depth and 1.07 at 15 cm to 30 cm depth, while the soil nitrogen concentration was 0.36 g cm-3 and 0.29 g cm-3 at 0 cm to 15 cm and 15 cm to 30 cm depth, respectively ([8]). Soil depth was not measured but was sufficiently deep to avoid limitations to early tree growth.
The site use was previously improved pasture, which was sprayed before planting with Propazymide (3.75 litres ha-1) to kill the sward. The transplants were planted manually using a “T” notch and protected in 60 cm tubes. Planting was at 2.5 m spacing between rows and 1.5 m spacing within rows giving a stocking rate of 2667 stems ha-1. Routine spraying of weeds was undertaken twice during each growing season using glyphosate (5 litres ha-1). The design adopted for the trial was a randomised complete block design, which is the most commonly used design in forest experiments ([45]) and large 10×8 tree plots were adopted.
Measurements and overview of analysis for each study
Measurements taken in the studies are described in the four sections below. For the measurements two trees of each of the four species were selected randomly from each of the six replicates in the trial. Shining gum had died in its first winter and is not included as part of this study.
Stem volume and biomass
Height and root collar diameter were measured for the twelve trees of each species in November 2010 (after two growing seasons) and November 2011 (after three growing seasons). Between November 2010 and 2011 all the cider gum had died and so the later measurements were not possible for this species. Height was measured using a height rod, while the root collar diameter was measured to the nearest 0.1 mm using a digital vernier gauge and taking the mean of two measurements taken at 90o to one another. Stem volumes were calculated using height (h) and diameter (d) and assuming that the tree stems were conical in shape. To enable stem weights for the trees to be estimated, wood samples were taken from a different sample of five trees of each species and sections were cut from the base, middle and top of their stems. Volumes of these stem samples were measured by a water displacement method using OHAUS analytical standard scales to measure weight which was converted to a volume using a water density of 1 g cm-3. Stem samples were oven dried at a temperature of 80 oC for 3 days, until no further loss in weight was observed and then weighed again to obtain dry weight. Specific gravity (SG) was then calculated for the wood samples and SG (g cm-3) and V (cm3) were multiplied together to estimate whole-stem dry weight of the study trees.
Leaf area
In September 2010 after two growing seasons, the crowns of the twelve alder, ash and sycamore trees measured for stem volume were wrapped in plastic bird netting to trap leaves as they fell. For sycamore the collections of leaves in late October was straightforward as most of the leaves had already been shed, but for alder, many leaves had to be carefully removed from the crowns of the sample trees. For trees with less than fifty leaves all leaves were measured and for those with more than 50 leaves, all leaves were counted and a systematic sample of 50 was taken. For each leaf, length (L) along the mid rib and width (W) at the widest point of the lamina and petiole length (P) was measured to the nearest millimetre. The use of netting to capture leaves proved to be unsuitable for trapping leaves of ash as their compound leaves disintegrated and some of the small leaflets fell out of the bird netting. As such, the leaf length and width could not be measured but the leaf stalk (S) without the leaflets, which remained trapped in the netting was measured for each leaf. For cider gum, the evergreen species, the method of trapping fallen autumn leaves was not appropriate. For each of the twelve trees, all the leaves were counted, classified as mature or juvenile and 50 leaves were removed from the trees in a systematic way from the bottom to top of the trees to ensure a good spread. Measurements of L, W and P were taken for each type of leaf.
From the leaves collected, a sample of forty was taken for each tree species across the range of sizes. L, W and P was measured and also S for ash and the leaf area (LA) was then determined using Compu Eye software (⇒ http://www.ehab soft.com/CompuEye/LeafSArea) and an Epson Perfection 1240® flatbed scanner. For cider gum forty juvenile leaves and forty mature leaves were measured. For all species, leaves were then dried for 48 hours at a temperature of 70 oC and weighed to obtain an oven-dried weight (M) using OHAUS analytical standard scales and following the approach adopted by Verwijst & Wen ([39]). As the original ash leaves had disintegrated new ash leaves were collected at the end of the summer of the following year for leaf area and weight determination purposes.
The total leaf area for the twelve sample trees of the four species was calculated using allometric methods, similar to the approach adopted in other studies ([41], [39], [34], [37]). This involved the determination of relationships between measurements of L and W (and S for ash) to leaf area and leaf weight using least squares regression. Best fit functions were selected based on R2 and standard error statistics. Best fit relationships were used to estimate the leaf area of each leaf sampled from the twelve trees of each species. For each tree, a mean leaf area was calculated and this was multiplied by the total number of leaves present to obtain an estimate of total leaf area per tree. For the twelve trees of each species, the results from the leaf area measurements and of the stem weights were used to SLA (leaf area/leaf dry mass) and LAR (leaf area/stem dry weight) parameters. LAR was calculated based on stem dry weight rather than the whole tree weight as below ground biomass was not assessed.
Growing season
The same twelve trees of each species used in the leaf area study, were assessed during 2011 to determine the length of the third growing season of the tree species at the trial. The method adopted elements from a study of leaf development in rowan (Sorbus aucuparia - [14]) and one investigating leaf senescence in birch (Betula pendula - [44]). The development of the bud was scored on a 0-5 scale with 0 for a dormant bud and 5 for full leaf expansion (the scale was 1 to 6 in original study from [14]). The stages in the bud burst scoring were as follows:
- bud is closed and in a fully dormant winter state;
- bud is swollen and the bud scales just started to open, however the bud is still vertical;
- bud scales have separated and the tightly furled leaves are visible. The bud is bent sideways and can appear “hooded”;
- bud scales are completely separated, leaves are starting to unfurl and separate but the leaflets (pinnae) on each leaf remain still furled - the leaves appear brownish in colour since the underside is predominantly visible;
- the leaves are elongated and leaflets have started to separate as well. The appearance is now much more green since the topside of the leaves is now visible;
- all leaflets have separated on the lowest two leaves and the shoot is expanding.
The end of the growing season was assessed through a five stage leaf retention score based on a four stage scoring system originally developed by Worrell ([44] - a zero was added for no leaves). As the trees were still relatively small, the assessment was made by estimating the percentage of the combined leaf area of the tree crown which was still green, not yellow or brown or had lost leaves. This was scored in the following categories:
- No leaves present;
- One leaf present to 20% of crown green;
- 21-40% of crown green;
- 41-60% of crown green;
- 61-80% of crown green;
- 81-100% of crown green.
For ash, sycamore and alder the growing season length was calculated by multiplying the bud development score or the leaf retention score by number of days. This gave a relative measure of photosynthetic duration. The growing season for cider gum, an evergreen tree could not directly be measured in the same way.
Resource capture efficiency
For each of the twelve ash, alder and sycamore trees the influence of growing season and leaf area on growth was examined using a resource capture efficiency index (RCI), calculated by multiplying tree growing season (collected in 2011) by leaf area (collected in 2010). The formula and units of measurement are described below (eqn. 1):
where LA is the leaf area (m2), LR is the leaf retention score, and D is the length (in days) of the growing season. The relationship between stem dry weight in 2010 and resource capture efficiency was investigated.
Statistical analysis
Statistical tests were conducted using IBM SPSS Statistics v19. The approaches used to test variables for significance of differences between species is described in Fig. 1.
Fig. 1 - Approach used to determine significance of differences between variables.
Regression was used to characterise relationships between L, W and LA and between L, W and LDW. IN SPSS there were eleven functions available for regression and the best-fit equation was selected by a combination of the smallest standard error of the estimate (SEE) and the highest R2. The same approach was used to define a relationship between stem dry weight and the resource capture efficiency.
Results
Where non parametric approaches to analysis have been applied the median is shown as a measure of centrality, otherwise the mean for the data is presented.
Stem volume and biomass
The stem volumes of the twelve trees for the four tree species were assessed in late 2010 after two growing seasons and for the surviving three species in late 2011 after three growing seasons. The data for height, basal stem diameter and calculated volume are shown in Tab. 3. For the two and three growing seasons height, diameter and stem volume were compared between species and significant differences were found by species (Tab. 3).
Tab. 3 - Height, stem diameter and volume for each species after two and three growing seasons. (1): ANOVA and Tukey’s test (mean shown); (2): Kruskal-Wallis and Mann-Whitney U test (median shown); (3): natural logarithm transformed then ANOVA and Tukey’s test (mean shown). The same lower case letter (a, b or c) denotes no significant difference between species.
| Species | 2 growing seasons | 3 growing seasons | ||||
|---|---|---|---|---|---|---|
| Height1 (cm) |
Diameter2 (mm) |
Stem volume2 (cm3) |
Height3 (cm) |
Diameter3 (mm) |
Stem volume2 (cm3) | |
| Alder | 155.5 a | 28.7 a | 9.6 a | 194.5 a | 43.8 a | 23.0 a |
| Ash | 119.0 b | 20.7 b | 6.4 b | 133.8 b | 27.4 b | 9.5 b |
| Cider gum | 199.5 c | 35.7 c | 18.0 c | - | - | - |
| Sycamore | 134.0 ab | 14.3 b | 4.9 b | 162.0 ab | 20.0 b | 8.1 b |
Tab. 4 shows the specific gravity and stem dry weights after two growing seasons. Kruskal-Wallis and Mann-Whitney tests were applied to these data and significant differences were found and are also described in Tab. 4. Medians for these data are shown.
Tab. 4 - Specific gravity (SG) and calculated stem dry weight (M) after two growing seasons from 12 randomly selected trees of each species. Kruskal-Wallis and Mann-Whitney U test applied to specific gravity and stem dry weight (medians shown). The same lower case letter (a, b or c) denotes no significant difference between species.
| Species | Specific gravity (g cm-3 = Mg m-3) |
Stem dry weight (g) |
|---|---|---|
| Alder | 0.391 a | 3.759 a |
| Ash | 0.563 b | 3.539 ab |
| Cider gum | 0.553 c | 9.896 c |
| Sycamore | 0.497 c | 2.390 b |
Leaf area
To determine leaf area, relationships between L, W and LA and between L, W and LDW were investigated. The results from best-fit regressions are described in Tab. 5 and Tab. 6. LA (Tab. 5) and LDW (Tab. 6) were estimated for the twelve trees of each species by applying the regression models to the L × W measurements for all but ash, where they were estimated from leaf stalk length. Kruskal-Wallis test and Mann-Whitney tests showed highly significant differences in leaf number, LA and LDW between species. The LA of alder and sycamore were not significantly different, but all others were significantly different. The LDW of cider gum was different from all others, but differences between the other species were not significant. In terms of leaf number, differences between ash and sycamore were not significant but were significantly different from other species as were alder and cider gum.
Tab. 5 - Description of the models predicting leaf area, where y is mean area of one leaf (LA) in cm2 and x is L (cm) × W (cm) of the leaf, except for ash where x is leaf stalk length and median leaf area by species. Total tree LA was calculated by multiplying number of leaves by the mean area of one leaf and converted in m2.
| Species | Number leaves |
Regression model | R2 | SEE | Median tree LA (m2) |
|---|---|---|---|---|---|
| Alder | 202 a | y = 0.325 x1.102 |
0.941 | 0.202 | 0.1919 a |
| Ash | 22 b | y = 0.1201 x2.1891 |
0.707 | 0.524 | 0.0627 b |
| Sycamore | 25 b | y = 0.532 x1.021 |
0.964 | 0.197 | 0.1856 a |
| E. gunnii (mature) | 657 c | y = 0.052 x2+0.448 x+1.032 |
0.967 | 0.947 | 0.4999 c |
| E. gunnii (juvenille) | y = 0.7714 x0.943 |
0.881 | 0.216 |
Tab. 6 - Description of the models predicting leaf area where y is LDW of a leaf in grammes and x is L (cm) × W (cm) of the leaf, except for ash where x is leaf stalk length. Whole tree LDW was calculated by multiplying number of leaves by the mean dry weight of a leaf.
| Species | Regression model | R2 | SEE | Median tree LDW (g) |
|---|---|---|---|---|
| Alder | y = 0.054 + 0.001 x + 0.0000751 x2 - 0.000000292 x3 |
0.967 | 0.041 | 21.75 a |
| Ash | y = 0.004 x2 + 0.005 x - 0.029 |
0.853 | 0.187 | 12.44 a |
| Sycamore | y = 0.007 - 0.20 x |
0.970 | 0.099 | 23.63 a |
| E. gunnii (mature) | y = 0.010 x + 0.001 x2 + 0.029 |
0.981 | 0.017 | 100.98 b |
| E. gunnii (juvenille) | y = 0.012 x + 0.021 |
0.932 | 0.300 |
LAR and SLA was calculated for the four tree species and the median values are shown in Fig. 2. Statistically significant differences in LAR and SLA were found between species.
Fig. 2 - Leaf Area Ratios (LAR) and Specific Leaf Areas (SLA) for the four tree species. Different letters above the bars indicates a significant difference. Confidence intervals are not given because of lack of normality.
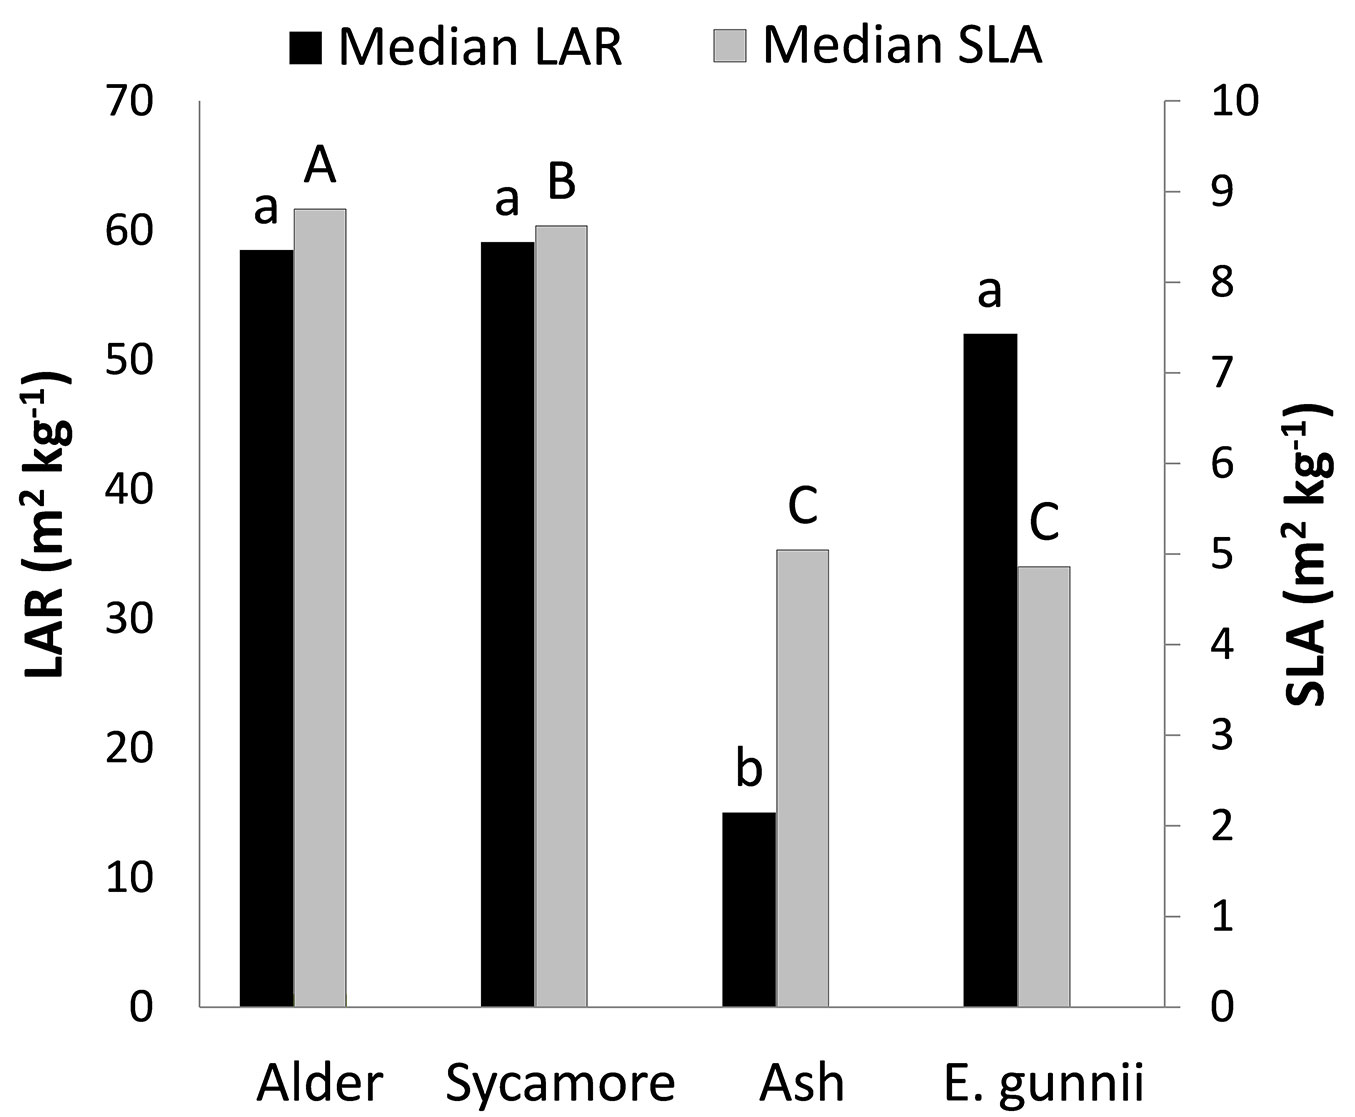
Kruskal-Wallis and Mann-Whitney tests were applied to the LAR data and ash LAR was found to be significantly different from the other three species. Kruskal-Wallis and Mann-Whitney tests demonstrated that the SLA of all species were significantly different from each another, except for ash and cider gum. P values were significant for SLA and very highly significant for LAR.
Growing season
The period of bud burst and senescence for ash, sycamore and alder for 2011 are shown in Fig. 3. Alder had a longer growing season than the other two species, with an earlier and more rapid bud burst and a later and longer period leading up to complete leaf drop. Ash and sycamore showed a similar response, with sycamore having more rapid bud burst and being slower to drop its leaves.
Fig. 3 - Bud burst and leaf retention of ash, sycamore and alder over the growing season of 2011.
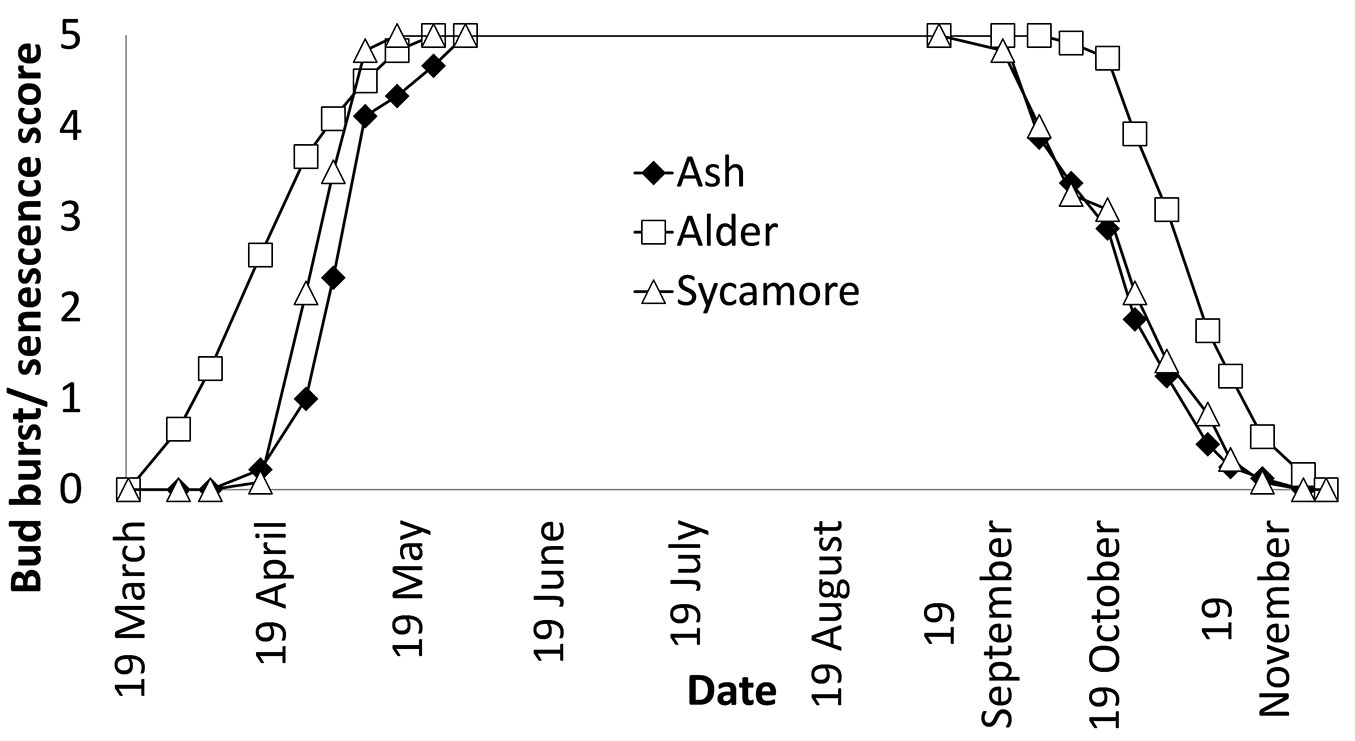
Cumulative growing season index data was not normally distributed and a Kruskal-Wallis test showed that differences in growing season between species were highly significant, while Mann-Whitney tests showed that there were very highly significant differences between sycamore and alder, and ash and alder.
Characterising resource capture efficiency
A correlation was performed of resource capture index against stem dry weight, which gave an R of 0.729 and was very highly significant (p<0.0001). A regression was conducted and the best fitting function was quadratic (R2 = 0.557, SEE = 1.233, y = -0.17 x2 + 0.683 x +2.267 - Fig. 4).
Fig. 4 - Relationship between stem dry weight and resource capture efficiency.
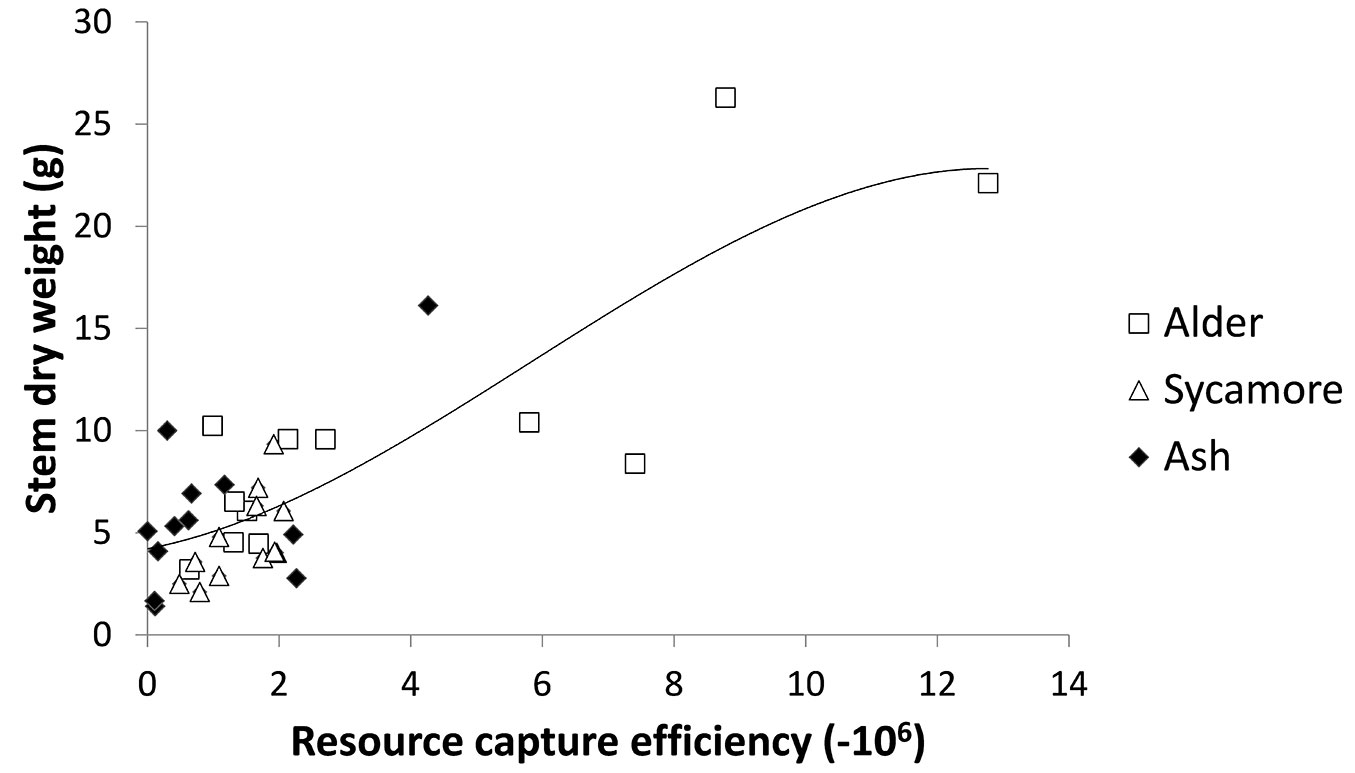
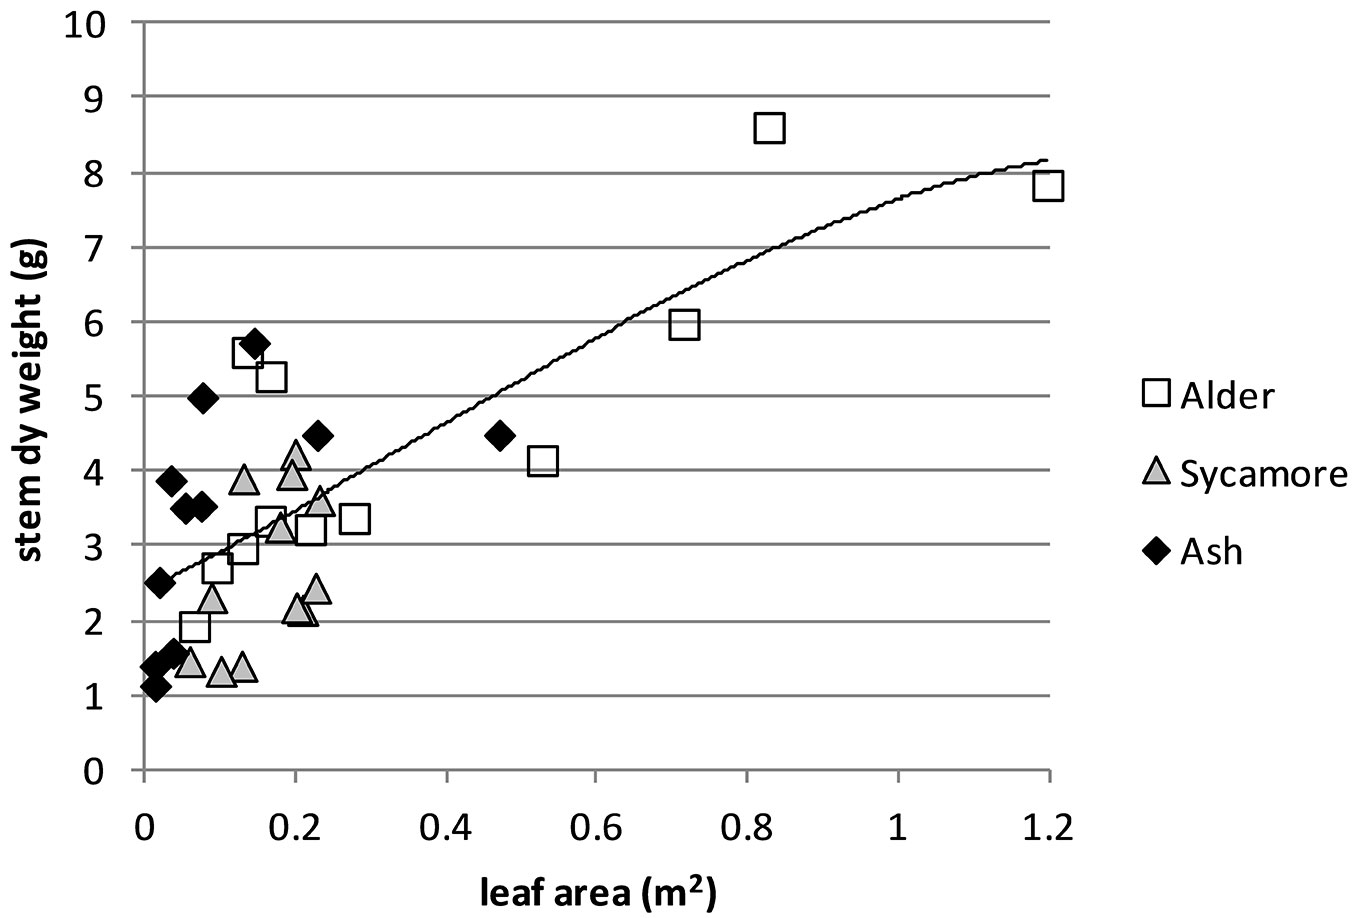
As a comparison correlations were separately performed for the two components (growing season index and LA) of the resource capture index against stem dry weight. For growing season index, the correlation with stem dry weight was relatively weak, with an R of 0.444 and a high significance (p<0.01). In contrast, the correlation between dry weight and LA was stronger. with an R of 0.733 and was very highly significant (p<0.0001). A regression showed the best fitting function to be cubic (R2 = 0.542, SEE = 1.256, y = -1.977 x3 + 2.132 x2 + 5.093 x + 2.391 - Fig. 5).
Fig. 5 - Relationship between stem dry weight and leaf area.
Discussion
The winter of 2009-2010 was the coldest in the UK since 1978-1979 and the UK experienced the coldest December in 100 years ([30]). This was followed by another severe winter, which apart from that of 2009-2010, was the coldest since the winter of 1985-1986 ([3]). The native and naturalised broadleaves were able to cope with these conditions, but the eucalypts fared badly, particularly the less cold-tolerant shining gum which exhibited complete mortality over each of the two severe winters. An analysis of the cold damage at the trial is described in Leslie et al. ([20]). Eucalypts have been planted on a limited extent in the UK; between 2011 and 2016 nurseries sold 220.000 transplants ([32]) and this scale represented trial rather than commercial planting. However, the limited information on suitable origins for cider gum ([11]) and shining gum ([12]) suggests that the origins used in this trial were not particularly well adapted. Furthermore, it is accepted that shining gum is one of the least hardy eucalypts planted in the UK and it is recommended that it be planted only within 20 km of the coast in southern England and closer to the coast elsewhere in the UK ([31]). The severely cold conditions and the origins planted explain some of the eucalypts poor performance.
Of the tree species that survived the first winter, the largest stem volumes were achieved by cider gum and alder, with the eucalypt producing nearly twice the volume of alder (Tab. 3). Cider gum had accumulated the largest leaf area, which would partly explain the fast growth of this species (Tab. 5). The median leaf area of trees of alder (0.1919 m2) was significantly different from ash (0.0627 m2) and cider gum (0.4999 m2), while that of sycamore (0.1856 m2) was significantly different from cider gum. While ash had the lowest leaf area, it attained nearly the same stem volume as sycamore suggesting that it exhibits greater photosynthetic efficiency. Also, the leaf area of alder was not significantly different from sycamore yet it attained a significantly larger stem volume. These observations suggest sycamore has low photosynthetic efficiency. By the end of the third growing season cider gum had died in the winter of 2010-2011 and the relative ranking of the remaining species in terms of stem volume remained the same.
The leaf area of the trees was measured at the end of the growing season and this may not have fully captured the leaf area over the whole season, as it does not incorporate leaf turnover. There are considerable differences in leaf longevity between temperate tree species; mean leaf lifespan of alder is 90 days and in maples and oaks can be as long as 180 days ([17]). Leaf longevity may explain some of the differences found between species in SLA. The SLA of alder and sycamore was relatively high and cider gum and ash was relatively low (with no significant difference between the two). This suggests a greater allocation of resources per unit leaf area in cider gum and ash and less resources per unit leaf area in sycamore and alder. Generally, there is a positive relationship between leaf mass, leaf area and the longevity of the leaves ([46]). Thus some trees invest relatively little in each metre of leaf area, allowing rapid build up of canopy, fast cycling of leaves and high initial growth. In contrast, other trees invest more heavily in each square metre of leaf area but retain these leaves for longer, resulting in a longer period of return from those leaves ([46]).
In terms of SLA, this would suggest that trees which retain their leaves for longer periods will have a lower SLA and those with short leaf longevity have a high SLA. Alder leaves are retained by the tree for a relatively short period ([17]) and so, as found in this study (Fig. 2) exhibit a relatively high SLA of (8.8 m2 kg-1) which would support such a strategy, each leaf being allocated a relatively low investment of resources. There are no studies of the leaf longevity of cider gum, but Whitehead & Beadle ([42]) note that in general eucalypt leaves are thick, tough and long-lived, a reflection of their evergreen habit and their association with sites of low soil nutrients and mild winters. A study in Australia found Eucalyptus paniculata leaf lifespan to be 1.09 years and that of Eucalyptus umbra to be 2.06 years ([46]), but Laclau et al. ([19]) studying Eucalyptus grandis in Brazil found unfertilised trees in plantation retained their leaves for 111 days. The relatively low SLA (4.9 m2 kg-1) of cider gum (Fig. 2) suggests a relatively long leaf lifespan. Ash also exhibited a low SLA and a study by Alberti et al. ([2]) of older trees also found a low SLA for ash, compared with Wych elm (Ulmus glabra). Another characteristic of trees with high SLA, such as the alder and sycamore in this study, is that they tend to exhibit high photosynthetic nitrogen use efficiencies, whereas trees with a low SLA adopt a different strategy, absorbing a greater proportion of the light available through a higher chlorophyll content in the leaves ([28]).
Statistically significant differences in specific gravity were found between species, with alder having a particularly low density (Tab. 4), also being lower than the 0.540 Mg m-3 cited by Claessens (2005 in [9]), perhaps due to the young age of the trees. The specific gravity of ash was similar (0.550 as opposed to 0.560 Mg m-3) to that found in larger trees from Italy ([2]) and that of cider gum was similar (0.548 as opposed to 0.500 Mg m-3) to that found in French plantations ([1]). The specific gravity was multiplied by stem volume enabling LAR (using stem weight rather than the conventional whole tree weight) to be calculated. This was compared by species and very highly significant differences were found between ash and all other species. Therefore, ash supports a smaller leaf area per unit stem weight than sycamore, alder and cider gum (Fig. 2). A shortcoming of this experiment was not to estimate branch and root weight of the trees, as this would have enabled a true LAR to be calculated and a better understanding of the relative allocation of resources between different parts of these trees. There are known to be differences in the allocation of resources between stem and leaves and roots between tree species ([29]). At the trial differences were observed; some individuals of shining gum exhibited instability due to excessive above ground growth and had fallen over, despite being supported by a tree shelter and bamboo cane. The other species showed good stability.
Phenology of temperate trees is determined by temperature and photoperiod, with the importance of each of these factors varying with tree species ([6], [40]). This study used visual assessment of budburst, which is the normal method used in field dormancy studies ([10]). The pattern of bud burst and leaf fall between ash, alder and sycamore is illustrated in Fig. 3. This shows that alder begins to come into leaf earlier than the other two species and also retains its foliage for longer into autumn, and that ash flushes later and loses leaves earlier in autumn than the other two tree species. Basler & Korner ([6]) found that there was no effect of photoperiod on bud burst of ash or sycamore, while a study ([40]) on the effect of temperature on budburst in seven temperate trees showed that of those planted at this trial, ash had the highest sensitivity to temperature, with sycamore being in the middle of the ranking. Spring 2011, when the assessment was made was particularly warm, being the warmest across the UK since 1910 ([25]). It is likely therefore that the growing season for 2011 was abnormally long for these species.
The phenology data for ash, sycamore and alder were based on monitoring the development and senescence of leaves on the terminal bud, but development of leaf area in trees is complex. Focusing on the terminal bud does not allow the pattern of whole tree leaf area to be examined and pioneer trees tend to adopt a different approach compared to climax species. Climax or forest tree species show a flushing habit of leaf development, whereas pioneers show a successive pattern of leaf development ([17]). The patterns of flushing between alder, ash and sycamore showed differences (Fig. 3). The progression of leaf unfolding started earlier in alder but was also more gradual in alder than in the other two species, which exhibited rapid flushing over a relatively short period.
Combining leaf area measurements from 2010 with growing season data from 2011 to create a resource capture index explained 56% of the differences in 2010 stem dry weight of the trees (Fig. 4). The best fitting relationship in terms of R2 was a curve, but a linear relationship also provided a good fit (R2=0.548). The nature of the relationship is difficult to identify precisely because of the lack of data at the higher end of the combined leaf area and growing season index. A possible explanation for a curved relationship between growth potential index and stem dry weight is that light interception by canopies is not linearly related to leaf area index, but follows a similar curved relationship due to mutual shading of leaves ([7]). This is supported by the curvilinear relationship between leaf area and stem dry weight (Fig. 5). Using leaf area alone explained 54% of the variation in stem dry weight, only marginally poorer than combining leaf area and growing season. This can be explained by the relatively small differences in growing period between the tree species. Had the origins been collected across a wider range of latitudes it is likely that variation in growing season between species would have been greater.
Growth is related to three variables: the site resources, the resource capture efficiency and the resource use efficiency ([35]). Multiplying leaf area by growing season provided a measure of the resource capture efficiency of the tree species at this trial. A combination of greater leaf area and longer period of growth has enabled alder to accumulate stem dry weight more rapidly than ash and sycamore (Fig. 4). The rate of photosynthesis in a tree species is strongly linked to the nitrogen content of leaves due to large amount of leaf nitrogen devoted to chloroplasts ([28]) and alder, being a nitrogen fixing tree is likely to be able to devote larger concentrations of nitrogen to its leaves than the other species. This study also showed that alder exhibited a high SLA (Fig. 2), allocating relatively little biomass for every square metre of leaf area. Trees with high SLA are known to exhibit high photosynthetic nitrogen use efficiency ([28]) and in general high relative growth rates ([4]). The higher leaf nitrogen concentration and this higher photosynthetic nitrogen efficiency may partly explain why alder has been able to build up leaf area rapidly and also use this leaf area efficiently. A further strength of alder is its relatively long growing season compared with sycamore and ash (Fig. 3). Alder, is also known to have a short leaf longevity ([18], [17]), enabling it to replace damaged leaves rapidly.
The most rapid growing species, cider gum was able to develop the highest leaf area of any of the species over two growing seasons (Tab. 5), a contributory factor being that it retains leaves for more than one growing season. Other factors contributing to the high productivity are the long period of photosynthetic activity and the high photosynthetic efficiency known of eucalypts, particularly under conditions of high stomatal conductance ([42]). Furthermore, the opportunistic nature of eucalypt growth is likely to have enabled cider gum to exhibit a longer growing season than alder.
The leaf area of alder and sycamore were not significantly different (Tab. 5) and they both exhibit high SLA, yet alder had accumulated a greater stem dry weight (Tab. 4), due to a longer period in leaf and potentially due to higher leaf nitrogen content, allowing higher rates of photosynthesis ([18]). Ash was the slowest growing species, and had the lowest leaf area (Tab. 5) and the shortest growing period of the four tree species (Fig. 3). Another factor may be low rate of photosynthesis in ash; a study by Koike & Sanada ([18]) found that ash (Fraxinus mandshurica) had a relatively low rate of photosynthesis across soils with a range of levels of soil nitrogen, when compared with alder (Alnus hirsuta) and birch (Betula maximowcziana).
There were several limitations to this study. The method used to harvest leaves at the end of the growing season was unsuitable for ash and measuring leaf area at one point in time ignored potential turnover of leaves during the growing season. The approach used to measure growing season did not allow the estimation of growing season for cider gum, an evergreen tree. This prevented a comprehensive comparison of the trees surviving the first winter. If the study was repeated the root and branch biomass would also be estimated to enable calculation of the LAR. Furthermore, growing season and leaf area was assessed in two different years and it would have been more consistent to measure these in the same year.
Conclusion
It is clear that there are significant differences in growth between the tree species tested at this trial. By the end of the second growing season all shining gum, the fastest growing species had been killed by the cold winter of 2009-2010. Of the surviving three species, the species with greatest stem volume after two growing seasons was cider gum followed by alder (Tab. 3). After three growing seasons none of the original eucalypts survived and alder exhibited the largest stem volume, although the specific gravity of the wood was less than the other species (Tab. 4). Cider gum had developed a particularly high LA after two growing seasons, with alder and sycamore following with LA that were not significantly different (Tab. 5). However, alder had grown much more quickly and its longer growing season (Fig. 3) may contribute to this higher growth rate. LAR (stem weight) was particularly low for ash (Fig. 2), indicating that ash allocates less relative resources to leaves than to its stem. SLA was also low for ash, as well as cider gum indicating that these species invest relatively high resources in each unit area of leaf area, relative to alder and sycamore (Fig. 2). The strong influence of LA and growing season on productivity was shown by creating a resource capture efficiency by multiplying growing season by LA, and this explained 56% of the variation in stem dry weight between trees (Fig. 4). However, this was only marginally better than LA alone (Fig. 5). It is likely that growing season would have a greater influence on growth if origins had been selected from a wider range of latitudes.
The results show that for biomass production on similar sites, alder would be a good candidate, being capable of rapidly accumulating LA and exhibiting a long growing season, resulting in high productivity. However, studies have shown that stands of alder emit N2O, which may possibly make it less attractive as a candidate tree for sequestration of greenhouse gas ([5], [21]).
List of abbreviations
The following abbreviations have been used throughout the text:
- L: length of leaf;
- LA: leaf area;
- LAR: leaf area ratio;
- LMF: leaf mass fraction;
- LDW: leaf dry weight;
- M: oven dry weight of stem;
- RGR: relative growth rate;
- S: length of petiole and main midrib in ash;
- SG: specific gravity;
- SLA: specific leaf area;
- V: stem volume;
- W: maximum width of leaf.
Acknowledgements
We would like to acknowledge funding from the University of Cumbria and Alastair Chalmers of Pyro Classic stoves that made the establishment of the field trial possible. We would also like to thank staff and students at the University of Cumbria for their help in establishing and maintaining the trial and to Graham and Chris Leslie for helping with assessments. Several people have provided useful information for this article; Ted Wooddisse of Nottinghamshire County Council and the late John Purse of Primabio on aspects of eucalypts and Matthew Wilkinson and Jason Hubert of Forest Research who provided methods for monitoring and assessing leaf phenology. The authors would like to acknowledge their important contribution and also that of Dr E. Bakr of the Plant protection Institute in Cairo who kindly provided the Compu Eye software used to measure leaf area. We also thank the two anonymous reviewers for making constructive suggestions for improvement to the original draft article.
References
Gscholar
Gscholar
Gscholar
Gscholar
Gscholar
Gscholar
Online | Gscholar
Gscholar
Gscholar
Gscholar
Gscholar
Gscholar
Authors’ Info
Authors’ Affiliation
National School of Forestry, University of Cumbria, Ambleside Campus, Rydal Road, Ambleside, LA22 9BB (UK)
School of Geosciences, University of Edinburgh, Crew Building, The King’s Buildings, West Mains Road, Edinburgh EH9 3JN (UK)
Centre for Forestry and Climate Change, Forest Research, Northern Research Station, Roslin, Midlothian EH25 9SY (UK)
Corresponding author
Paper Info
Citation
Leslie AD, Mencuccini M, Perks MP (2017). A resource capture efficiency index to compare differences in early growth of four tree species in northern England. iForest 10: 397-405. - doi: 10.3832/ifor2248-010
Academic Editor
Silvano Fares
Paper history
Received: Oct 12, 2016
Accepted: Feb 01, 2017
First online: Mar 24, 2017
Publication Date: Apr 30, 2017
Publication Time: 1.70 months
Copyright Information
© SISEF - The Italian Society of Silviculture and Forest Ecology 2017
Open Access
This article is distributed under the terms of the Creative Commons Attribution-Non Commercial 4.0 International (https://creativecommons.org/licenses/by-nc/4.0/), which permits unrestricted use, distribution, and reproduction in any medium, provided you give appropriate credit to the original author(s) and the source, provide a link to the Creative Commons license, and indicate if changes were made.

Web Metrics
Breakdown by View Type
Article Usage
Total Article Views: 53213
(from publication date up to now)
Breakdown by View Type
HTML Page Views: 42453
Abstract Page Views: 5566
PDF Downloads: 3848
Citation/Reference Downloads: 29
XML Downloads: 1317
Web Metrics
Days since publication: 3397
Overall contacts: 53213
Avg. contacts per week: 109.65
Article Citations
Article citations are based on data periodically collected from the Clarivate Web of Science web site
(last update: Mar 2025)
Total number of cites (since 2017): 7
Average cites per year: 0.78
Publication Metrics
by Dimensions ©
Articles citing this article
List of the papers citing this article based on CrossRef Cited-by.
Related Contents
iForest Similar Articles
Research Articles
Species-specific responses of wood growth to flooding and climate in floodplain forests in Central Germany
vol. 12, pp. 226-236 (online: 03 May 2019)
Research Articles
Effect of cadmium (Cd) and lead (Pb) soil contamination on the development of Hymenoscyphus fraxineus on Fraxinus excelsior and F. angustifolia seedlings
vol. 16, pp. 307-313 (online: 09 November 2023)
Research Articles
Effect of soil-applied lead on mineral contents and biomass in Acer cappadocicum, Fraxinus excelsior and Platycladus orientalis seedlings
vol. 10, pp. 722-728 (online: 27 July 2017)
Research Articles
Chitosan exhibits variable effects on pine (Pinus sylvestris L.) and alder (Alnus glutinosa L.) growth and secondary metabolism
vol. 17, pp. 236-244 (online: 06 August 2024)
Research Articles
Response of juvenile progeny of seven forest tree species and their populations to simulated climate change-related stressors, heat, elevated humidity and drought
vol. 11, pp. 374-388 (online: 15 May 2018)
Research Articles
Links between phenology and ecophysiology in a European beech forest
vol. 8, pp. 438-447 (online: 15 December 2014)
Research Articles
Evaluating the impact of Hymenoscyphus fraxineus in Trentino (Alps, Northern Italy): first investigations
vol. 10, pp. 871-878 (online: 06 November 2017)
Research Articles
Spread intensity and invasiveness of sycamore maple (Acer pseudoplatanus L.) in Lithuanian forests
vol. 8, pp. 693-699 (online: 19 March 2015)
Research Articles
Can we expect more from Alnus glutinosa (L.) Gaertn. in a changing climate?
vol. 19, pp. 69-76 (online: 08 March 2026)
Research Articles
Frost damage to eucalypts in a short-rotation forestry trial in Cumbria (England)
vol. 7, pp. 156-161 (online: 23 January 2014)
iForest Database Search
Search By Author
Search By Keyword
Google Scholar Search
Citing Articles
Search By Author
Search By Keywords
PubMed Search
Search By Author
Search By Keyword


