Availability of tree cavities in a sal forest of Nepal
iForest - Biogeosciences and Forestry, Volume 9, Issue 2, Pages 217-225 (2015)
doi: https://doi.org/10.3832/ifor1493-008
Published: Oct 16, 2015 - Copyright © 2015 SISEF
Research Articles
Abstract
Tree cavities are important structural elements of forest ecosystem that host numerous birds, mammals and other cavity-dependent organisms. Pattern of cavity distribution in temperate and boreal forests are relatively well studied, yet little is known about cavities in tropical and subtropical forests. We compared cavity availability in relation to tree condition (living tree and snag), tree species and DBH class between two different sites in a subtropical deciduous sal forest in Nepal: the Chitwan National Park Forest (the park site) and the Khorsor Buffer Zone Forest (the buffer site). Surveys for tree cavities were conducted in 2013 on 50 circular sample plots of size 0.1 ha. We recorded 40 cavity trees in the park site and 31 cavity trees in the buffer site. Density of cavities was on average 22.4 ha-1 in the park site and 19.2 ha-1 in the buffer site. Cavities occurred mostly in living trees (85.9% cavity trees) and were formed mostly by damage and decay (natural cavities: 74%) or by woodpecker activity (excavated cavities: 26%). Most were observed on three tree species: Shorea robusta, Dillenia pentagyna and Syzygium operculatum, with a mean diameter of 43 cm (range: 12-111 cm). S. operculatum, Myrsine semiserrata and Semecarpus anacardium were overrepresented among tree species with cavities. In snags, 25.0% of all cavities were found in the park site and 8.3% in the buffer site, while snags represented 4.2% and 2.2% of all trees in the two sites, respectively. Statistical anaysis indicated that tree species, tree condition and particularly diameter (DBH) were important variables for the prediction of cavity presence. We recommend cavity-bearing tree species to be better protected by forest management in order to help maintain the community of cavity dwellers.
Keywords
Chitwan National Park, Natural Cavities, Excavated Cavities, Subtropical Forest, Tree Holes
Introduction
Cavities in trees are an important ecological resource as nesting sites or shelters for many birds, small mammals, reptiles and other organisms ([43], [9], [56], [23]). Worldwide, 10 to 40% of birds and mammals are cavity-dependent species ([11]). Tree cavities are therefore regarded as resources that may limit number of secondary cavity nesters ([44], [33], [34], [13]). Such a limitation seems apparent in cavity-poor, managed forests, where trees are usually harvested before reaching a suitable size for cavity formation. Moreover, foresters actively remove the remaining old or dead trees (potentially cavity trees). The negative effect of such management is additionally reflected on the populations of woodpeckers, which are natural creators of cavities and are often dependent on old and dead trees ([30]). Such practices may lead to a general decline of forest biodiversity and is a major key issue in the forestry-conservation controversy ([37], [53]). However, in natural or semi-natural old growth forests it has demonstrated that a surplus of tree cavities exist and secondary cavity nesters are not usually limited by shortage of cavities ([18], [51], [46], [9], [4]). The age, species and size of trees have a primary role in defining the abundance and distribution of tree cavities ([54], [55], [23]).
Cavities are predominantly found in old living or dead trees, however, bird species often occupy cavities located in middle-age living trees of medium size ([52], [14], [1], [47]). Patterns of cavity creation, life-span, and their use are obviously dependent on forest ecology and dynamics, and therefore differ between tropical and temperate regions.
It has been demonstrated that woodpeckers play a keystone role in some forests by providing cavities for other cavity-nesting species ([30], [11]). Many woodpecker species nest in trunks, limbs or branches of dead trees ([7], [3], [54]). However, the proportion of woodpecker-made (excavated) and non-excavated cavities may largely differ among different forest types (e.g., coniferous vs. deciduous, managed vs. non-managed), as well as the longevity of cavities and their attractiveness for different bird species ([54], [55]). Moreover, the presence of cavities may differ at the individual tree level, since the specific history of each tree affects its suitability either for excavation by woodpeckers or developing natural cavities. All the above factors affect the availability of cavities and their ecological significance in the forests. It is therefore necessary to better understand how different forest management strategies affect the availability of cavities in different forest types, and their importance for the community of cavity-dependent organisms.
Although tree cavities are critical component of forest ecosystems worldwide, they have been mostly investigated in Europe and North America ([9], [1], [11], [39], [55]), while little is known about their characteristics and occupancy rate in Asia ([4], [23]), where forests often harbor a very diverse assemblages of woodpeckers ([28], [30], [27]) and likely a different community of cavity dependent organisms. As in other parts of the world, the maintenance of biological diversity is a major objective of the Nepal’s protected areas, including the renowned Chitwan National Park located in the subtropical lowland region. Biodiversity conservation strategies aim to secure the presence of tree cavities ([12]) and maintain the complete guild of cavity nesters and other obligate users. Unfortunately, little is known about the availability, distribution and use of cavity trees in subtropical forests of Asian subcontinent.
In this study we examined the density and origin of tree cavities in the sal forests (i.e., broadly distributed forest type dominated by the sal tree - Shorea robusta) of the Chitwan National Park and its buffer zone. The ultimate goal was to describe tree cavities in terms of tree species, characteristics and conditions, in order to better understand the importance of primary cavity-nesters (excavators) as cavity creators. We compared two sites with different management regimes to assess the potential effect of different levels of human impact on the availability of cavity resources.
Material and methods
Study area
The study was conducted in the subtropical lowlands of the inner Terai region, namely in the Chitwan National Park (CNP), and in the adjoining buffer zone forest at Khorsor, in a valley between Siwalik and Mahabharat Mountain ranges, south-central Nepal (Fig. 1). The altitude in this area ranges from 110 to 850 m a.s.l. The region has a subtropical climate with a dry season (October-May) and a rainy monsoon period (June-September). The Chitwan National Park (27° 34′ - 27° 68′ N, 83° 87′ - 84° 74′ E) covers 932 km2. For centuries, the Chitwan area has been used for royal hunting and managed in order to enhance the game through, e.g., low intensity fires to increase the annual production of grass ([32]). Due to the high malaria risk until 1950s, only a few native malaria-resistant tribes (e.g., Tharu) were living in Chitwan based on non-intensive utilization of forests and grasslands supported by shifting cultivation ([31]). However, the eradication of malaria resulted in a massive population migrations and a large-scale forest clearing aimed at human settlements and crop cultivation ([32]). The relatively unaffected part of the Chitwan area was declared as the first national park in Nepal in 1973. UNESCO declared CNP a World Heritage Site in 1984 ([17]). The CNP is one of the best habitats for the Bengal tiger (Panthera tigris) in the world. This area is also renowned for its successful protection of the one-horned rhinoceros (Rhinoceros unicornis) and the gharial crocodile (Gavialis gangeticus), and is considered to have the highest population density of sloth bears (Melursus ursinus). A total of 68 species of mammals, 544 species of birds (including 22 globally threatened species), 56 species of herpetofauna and 126 species of fish have been recorded there. Several dozens of Chitwan’s bird species like woodpeckers (Picidae), parakeets (Psittacula spp.), barbets (Megalaima spp.), hornbills (Bucerotidae), as well as some small and middle-size arboreal mammals and reptiles are all dependent on the presence of cavity trees. Seventy percent of the CNP vegetation cover is dominated by sal trees, in admixture with other tree species like Terminalia alata, Dillenia pentagyna, Syzygium operculatum and a number of other far less abundant tree species. Other major forest types at the CNP are riverine forests in floodplains or stands dominated by chir pine (Pinus roxburghii) located at higher elevations.
Fig. 1 - Location of the study area.
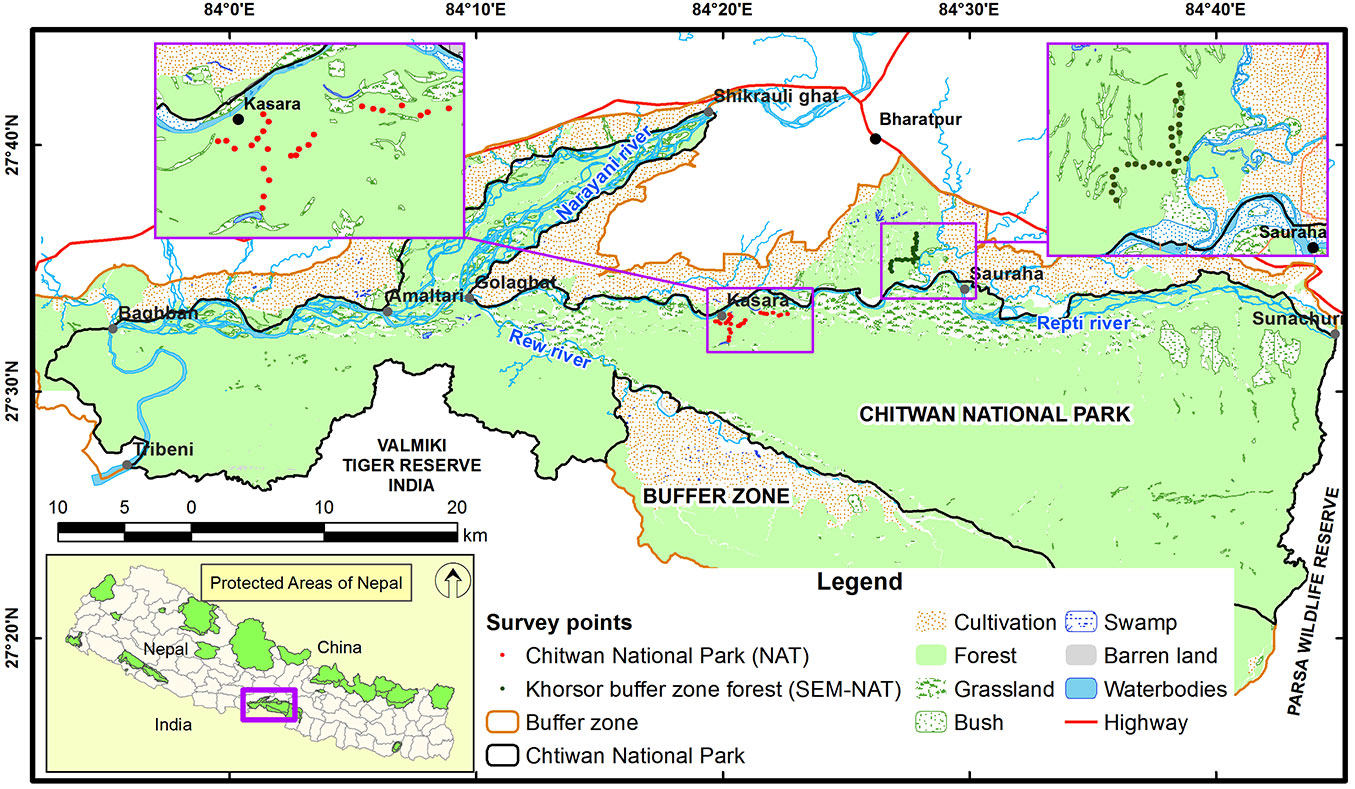
The sal forests covering substantial part of the CNP are regularly burned in early spring with low intensity fires, mostly burning the dry litter. Removal of dead wood is illegal though occurring ([42]). In 1996, an additional area of 750 km2 surrounding the Chitwan National Park (Fig. 1) was declared as “buffer zone”. This consists of forests and other land-use types including cultivated lands ([17]). The buffer zone forest at Khorsor is adjoined to the Chitrasen and Bagmara community, and delimits the southern border of the CNP. Khorsor forest serves as major source of firewood and sometimes (illegally) timber for local people. In addition, the area has been heavily used for grazing by livestock. Prescribed burning and dead wood removal are other major anthropogenic activities largely affecting the forest ecosystem. In summary, the buffer zone has generally the same forest and vegetation types as the area falling within the national park, but human impact is more intense.
Sampling design
Fieldwork was done during the dry season in March 2013. The study area included two sites with different forest conditions: (1) a site within the CNP, with relatively low human pressure (the park site); and (2) a managed forest corridor of buffer zone at Khorsor (the buffer site), where human pressure was higher (Fig. 1). The park site sample plots were located in central lowland part of the CNP (27° 35′ - 27° 36′ N, 84° 19′ - 84° 22′ E; 135-182 m a.s.l.), while the buffer site sample plots were located in northern part of the buffer zone (27° 34′ - 27° 36′ N, 84° 26′ - 84° 27′ E; 163-189 m a.s.l.). In each studied site, 25 circular sample plots of 17.8 m radius (0.1 ha) were established at least 250 m apart along a transect located on available forest roads or trails. Forests of Chitwan are interspersed by grasslands, thus the first point of each transect was located at least 150 m apart from the forest edge. Each plot center was placed at least 50 m within the forest in orthogonal direction from the main road, alternatively on the left or right side. Central points of each plots were set in the field using a Garmin GPS 76CSx® device (Garmin International Inc., Olathe, Kansas, USA). Next point on the transect was located by walking 250 meters along the main road and then moving 50 meters into the forest. When glades or meadows were encountered at the sampling point, we moved another 250 meters on transect to the next turn-point into the forest interior. The same applied for spots that were considered too dangerous, i.e., dense thickets with potentially hidden dangerous animals (tigers, rhinos, sloth bears, wild elephants). Additionally, at least two people equipped with bamboo sticks watched continuously for dangerous animals during data collection.
For all trees within each sample plots, the species, the diameter at breast height (DBH) and the overall condition (live or dead) were recorded. Only trees with DBH ≥ 10 cm were recorded. Each tree was carefully inspected by at least two persons with binoculars. Detected cavities were checked using a ladder or/and a telescopic pole (up to 13 m long) with a low light diode and a webcam connected to a laptop. Using this device and a ladder we could investigate cavities up to 22 m. Therefore, the number of tree cavities should be considered as the minimum number of cavities present on the plots, as some trees with cavities were out of reach. We defined a cavity as a hole in the tree with a minimum entrance diameter of 2 cm, with the interior and bottom sufficient for small birds to nest in (a minimum bottom diameter of 5 cm). Very large cavities (entrance diameters > 15 cm or depth > 70 cm) were excluded from the analysis, since the study was focused on small and middle-size cavity-dependent birds.
Regarding the origin, cavities were divided into two categories: (i) non-excavated (natural cavities); (ii) excavated by woodpeckers (woodpecker-made cavities).
Data analysis
All sampled trees were divided into eight DBH classes: (I) 10-19 cm; (II) 20-29 cm; (III) 30-39 cm; (IV) 40-49 cm; (V) 50-59 cm; (VI) 60-69 cm; (VII) 70-79 cm; (VIII) 80+ cm. Six continuous density variables were analyzed: (a) of cavity trees; (b) all cavities; (c) natural cavities; (d) woodpecker-made cavities; (e) live trees; and (f) dead trees. First, differences in the above-mentioned variables between the two study sites were examined by applying the Mann-Whitney’s and the Chi-square tests, using the software package STATISTICA® version 10.0 ([40]). To evaluate the selectivity of cavity trees in relation to the available tree species and DBH classes, we calculated the Ivlev’s electivity index ([24] - eqn. 1):
where the electivity (E) is a function of the availability of a tree species (or DBH class) in the study plots (p), and their relative cavity presence (r). Available trees and cavity trees were expressed as mean percentage values. E values range from -1.0 to +1.0 with positive values indicating overrepresented and negative values indicating underrepresented trees, and zero for no selection.
Second, to analyze the relationship between several predictor variables (tree characteristics) and the binary response variable “incidence of tree cavities” (0, 1), generalized linear models (GLMs) with binomial error distribution were computed using the statistical software R version 3.0.2 ([38]). Explanatory variables used in the model were: (1) the tree species (nine species including those very rare that were combined into one category); (2) the site (park site/buffer site); (3) the tree condition (dead or alive); (4) DBH (covariate). The initial model included the main effects (Tree species, Site, Tree condition and DBH) and three 2-way interactions between the categorical variables and DBH. Only those interactions which were biologically most meaningful for our study were included. For each model, we calculated the Akaike’s information criterion (AIC) and the Akaike weight (w - [8]). The best model (minimal adequate model) was identified by a stepwise deletion procedure based on AIC ([22]). We calculated the area under the curve (AUC) as a measure of binary classifier performance (proportion of true positives and false positives). An AUC value of 1 indicates perfect classifier performance (all cases correctly classified) and a value of 0.5 indicates a classifier performance similar to randomness. A 0.05 level of significance was used.
Results
Tree species composition and size distribution
In total, we recorded 1041 live trees and 38 snags. The density of live trees was very similar at both sites (228.0 ha-1 in the park site, N = 25; and 228.4 ha-1 in the buffer site, N = 25). The density of snags was twice as high in the park site compared to the buffer site, and this difference was significant (on average 10.0 and 5.2 ha-1, respectively, Tab. 1). Overall, 18 tree species were identified, including 14 species at the park site and 13 at the buffer site (Tab. 2). Sal was the most common tree species in both sites (49.5% of trees in the park site, N = 25 and 45.7% in the buffer site, N = 25). In the park site, the next abundant species were D. pentagyna (19.5%) and S. operculatum (19.1%). Terminalia alata, which was not recorded on the park site, was the second most numerous species in the buffer site (22.6%), followed by D. pentagyna (21.5%). All other species were less common, representing 0.2-3.0% of trees at the park site and 0.2-4.4% at the buffer site (Tab. 1).
Tab. 1 - A comparison of the stand characteristics between Chitwan National Park (the park site) and Khorsor buffer zone forest (the buffer site).
| Variables | Park site (N = 25) |
Buffer site (N = 25) |
Mann-Whitney test |
|||
|---|---|---|---|---|---|---|
| Mean ± SE | Range | Mean ± SE | Range | U | P | |
| Live trees ha-1 | 228.0 ± 14.15 | 40-330 | 228.4 ± 19.81 | 40-470 | 299.5 | 0.808 |
| Snags ha-1 | 10.0 ± 2.30 | 0-50 | 5.2 ± 2.24 | 0-50 | 206.5 | 0.041 |
| Cavity trees ha-1 | 16.0 ± 2.44 | 0-40 | 12.4 ± 1.66 | 0-30 | 267.5 | 0.388 |
| Cavities (all) ha-1 | 22.4 ± 4.04 | 0-50 | 19.2 ± 3.31 | 0-60 | 274.0 | 0.461 |
| Natural cavities ha-1 | 16.0 ± 2.82 | 0-40 | 14.8 ± 3.0 | 0-50 | 291.5 | 0.691 |
| Excavated cavities ha-1 | 6.4 ± 1.72 | 0-30 | 4.4 ± 1.30 | 0-20 | 279.5 | 0.528 |
Tab. 2 - Density of tree species (trees ha-1) in the park site and the buffer site.
| Tree species | Park site (N = 25) | Buffer site (N = 25) | ||
|---|---|---|---|---|
| Mean ± SE | Percentage | Mean ± SE | Percentage | |
| Shorea robusta | 112.8 ± 12.27 | 49.5 | 104.4 ± 13.68 | 45.7 |
| Dillenia pentagyna | 44.4 ± 7.03 | 19.5 | 49.2 ± 11.42 | 21.5 |
| Syzygium operculatum | 43.6 ± 7.85 | 19.1 | 10.0 ± 3.78 | 4.4 |
| Myrsine semiserrata | 6.8 ± 3.35 | 3.0 | 1.6 ± 1.24 | 0.7 |
| Toona ciliata | 4.8 ± 2.71 | 2.1 | 0 | 0 |
| Semecarpus anacardium | 4.4 ± 2.45 | 1.9 | 1.2 ± 0.87 | 0.5 |
| Trewia nudiflora | 4.0 ± 2.16 | 1.8 | 0.4 ± 0.40 | 0.2 |
| Litsea monopetala | 2.4 ± 1.44 | 1.1 | 4.0 ± 1.6 | 1.8 |
| Tamarindus indica | 2.0 ± 1.63 | 0.9 | 0 | 0 |
| Syzygium cumini | 0.8 ± 0.55 | 0.4 | 0.4 ± 0.40 | 0.2 |
| Emblica officinalis | 0.8 ± 0.80 | 0.2 | 0 | 0 |
| Terminalia belerica | 0.4 ± 0.40 | 0.2 | 2.4 ± 1.44 | 1.1 |
| Terminalia chebula | 0.4 ± 0.40 | 0.2 | 0 | 0 |
| Xeromphis uliginosa | 0.4 ± 0.40 | 0.2 | 0 | 0 |
| Terminalia alata | 0 | 0 | 51.6 ± 9.18 | 22.6 |
| Terminalia termentosa | 0 | 0 | 2.4 ± 1.32 | 1.1 |
| Mallotus philippensis | 0 | 0 | 0.4 ± 0.40 | 0.2 |
| Spondias pinnata | 0 | 0 | 0.4 ± 0.40 | 0.2 |
| Total | 228.0 | 100 | 228.4 | 100 |
S. robusta was the most abundant dead tree in both study sites (11 trees in the park site and 8 trees in the buffer site), while S. operculatum was represented by 7 snags in the park site and 3 snags in the buffer site. One T. alata snag was found in the buffer site, and the remaining dead trees were not identified. Dead trees were 4.2% of all standing trees in the park site and 2.2% in the buffer site.
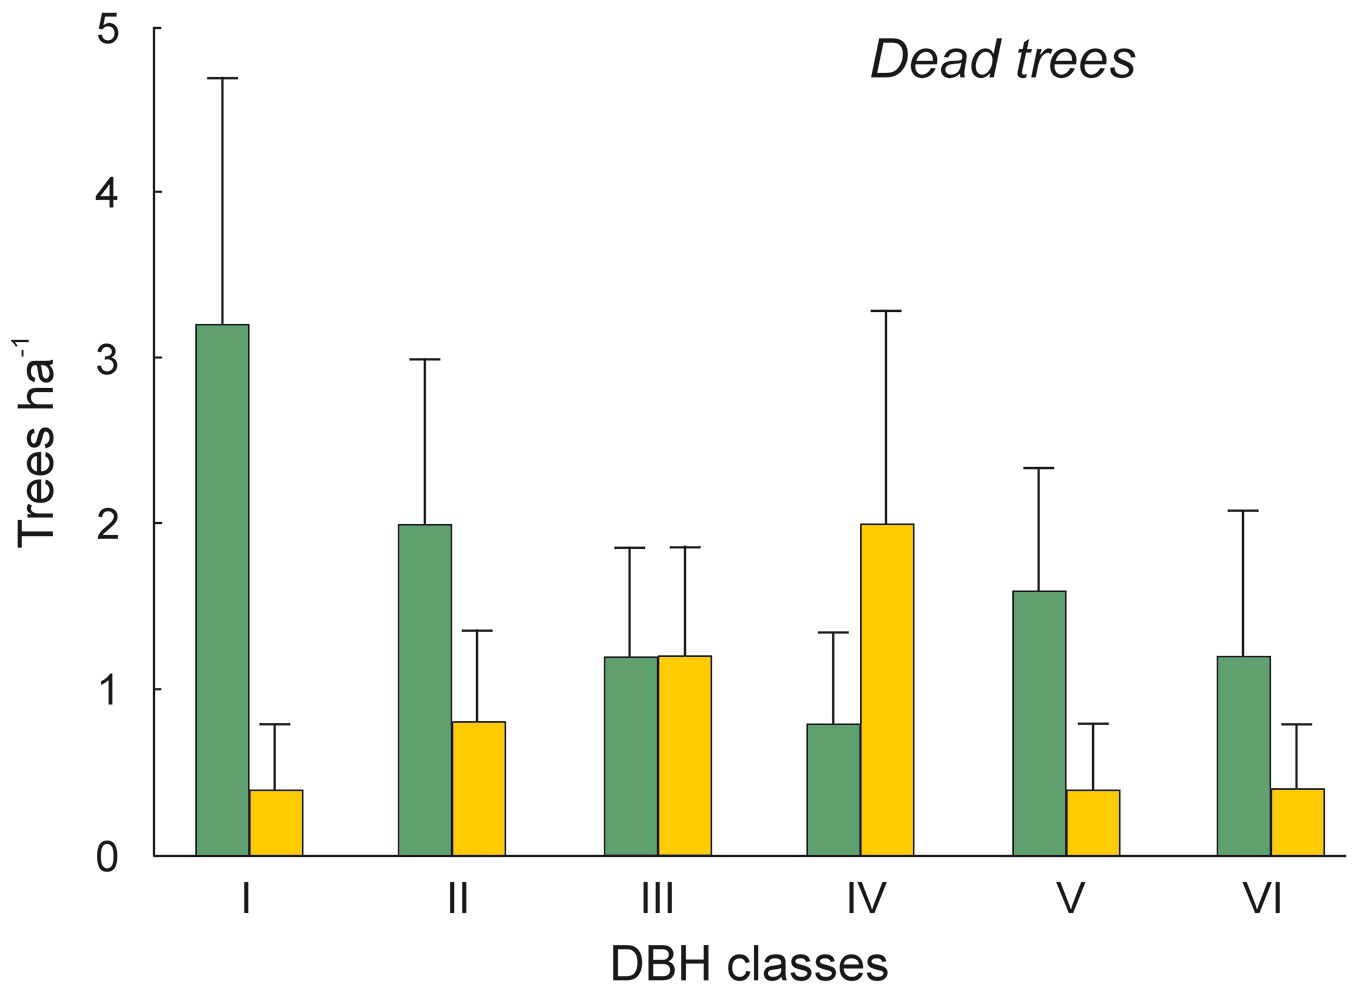
The DBH of all live trees in this study ranged from 10 to 111 cm. Overall, trees belonging to DBH classes I and II corresponded to 54.0% in the park site (N = 25) and 51.3% of all live trees in the buffer site (N = 25). Trees with DBH ≥ 50 cm were 23.9% of the total trees in the park site and 22.4% in the buffer site (Fig. 2). S. robusta was the most represented species in classes III-VI in the park site, and in classes I and III-VI in the buffer site (Fig. 3). S. operculatum was recorded only in classes I-IV at both sites, though it was much more abundant in the park site than in the buffer site (Fig. 4). Similarly, D. pentagyna was found mostly in DBH class I and II at both sites (Fig. 5). Dead trees were found in classes I-VI. The thinnest snags (I class) dominated at the park site, while DBH classes III-IV dominated at the buffer site (Fig. 6).
Fig. 2 - Distribution of all live trees according their DBH classes in the sal forest. Colors represent the two study sites: green - the park site (lower human pressure, N = 25) and yellow - the buffer site (higher human pressure, N = 25). Mean and SE are shown.
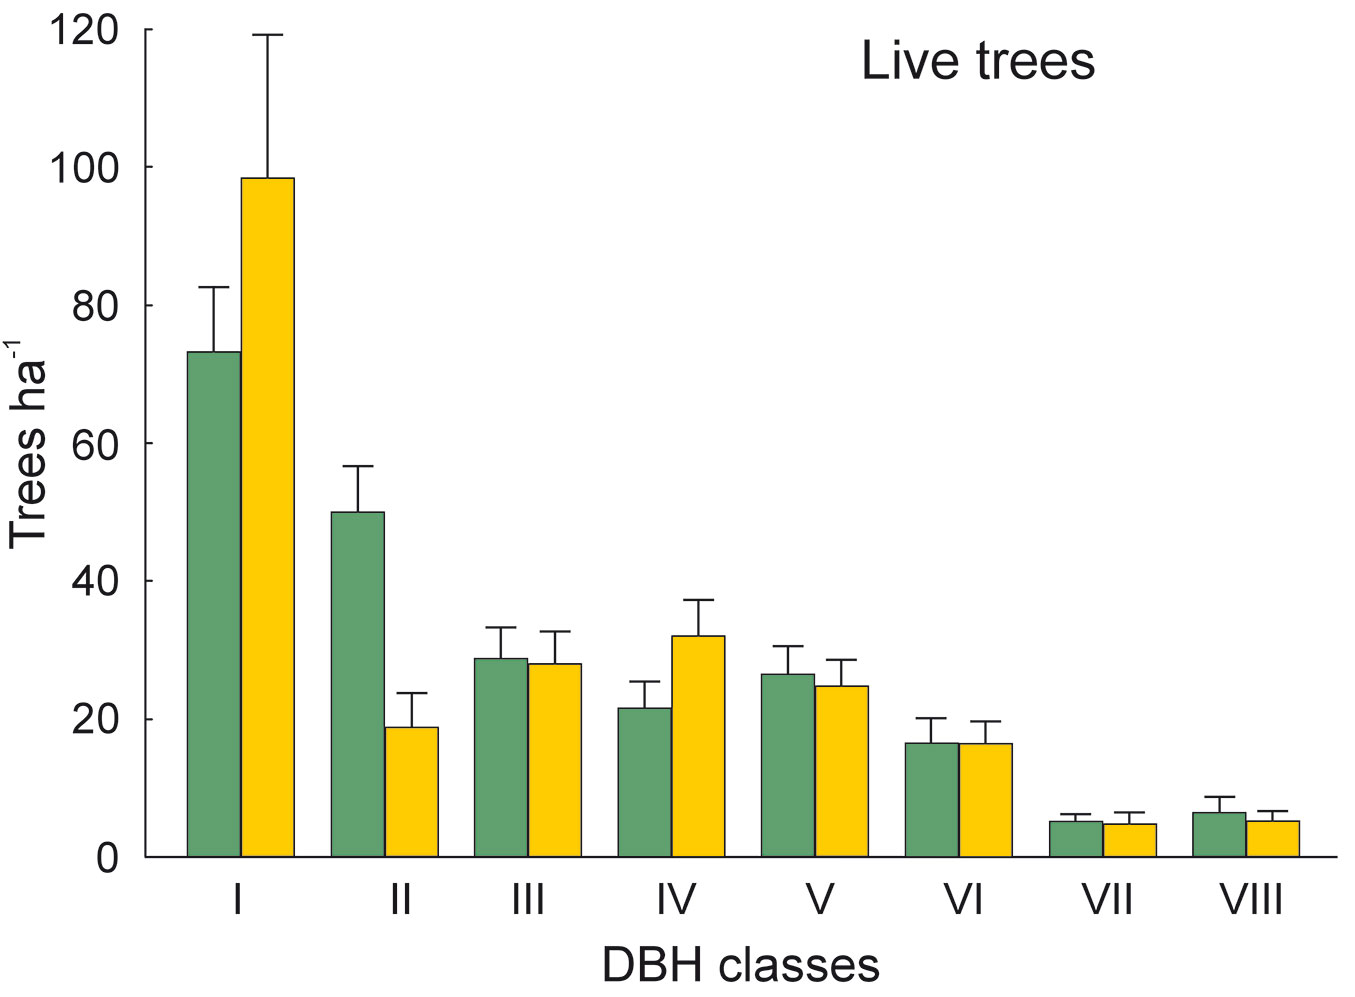
Fig. 3 - Distribution of Shorea robusta according its DBH classes in the sal forest. Colors represent the two study sites: green - the park site (low human pressure, N = 25) and yellow - the buffer site (higher human pressure, N = 25). Mean and SE are shown.
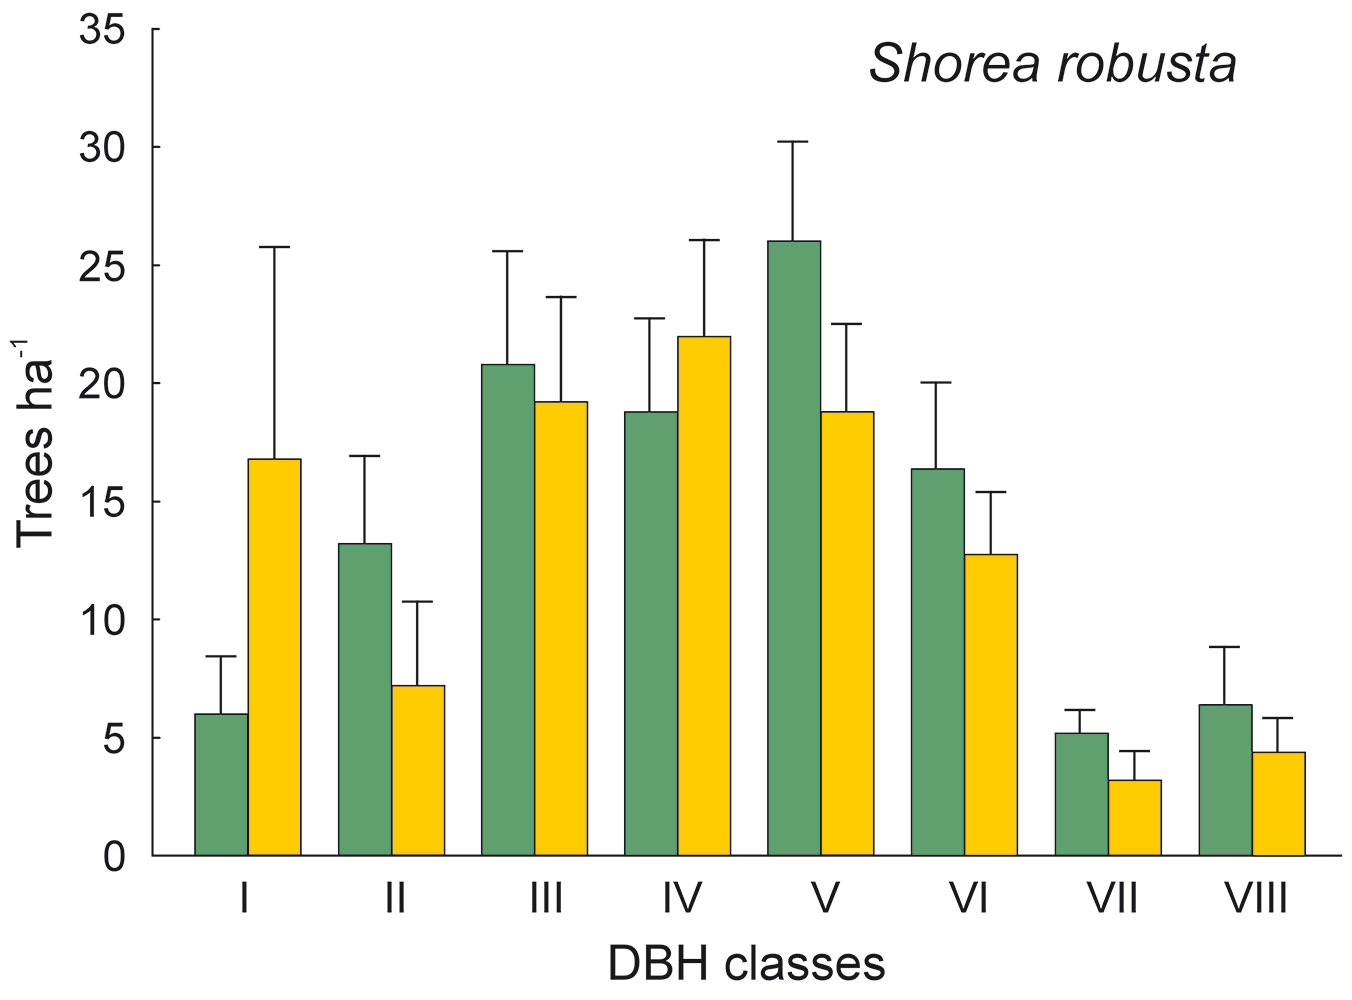
Fig. 4 - Distribution of Syzygium operculatum according its DBH classes in sal forest. Colors represent two sites: green - the park site (low human pressure, N = 25) and yellow - the buffer site (higher human pressure, N = 25). Mean and SE are shown.
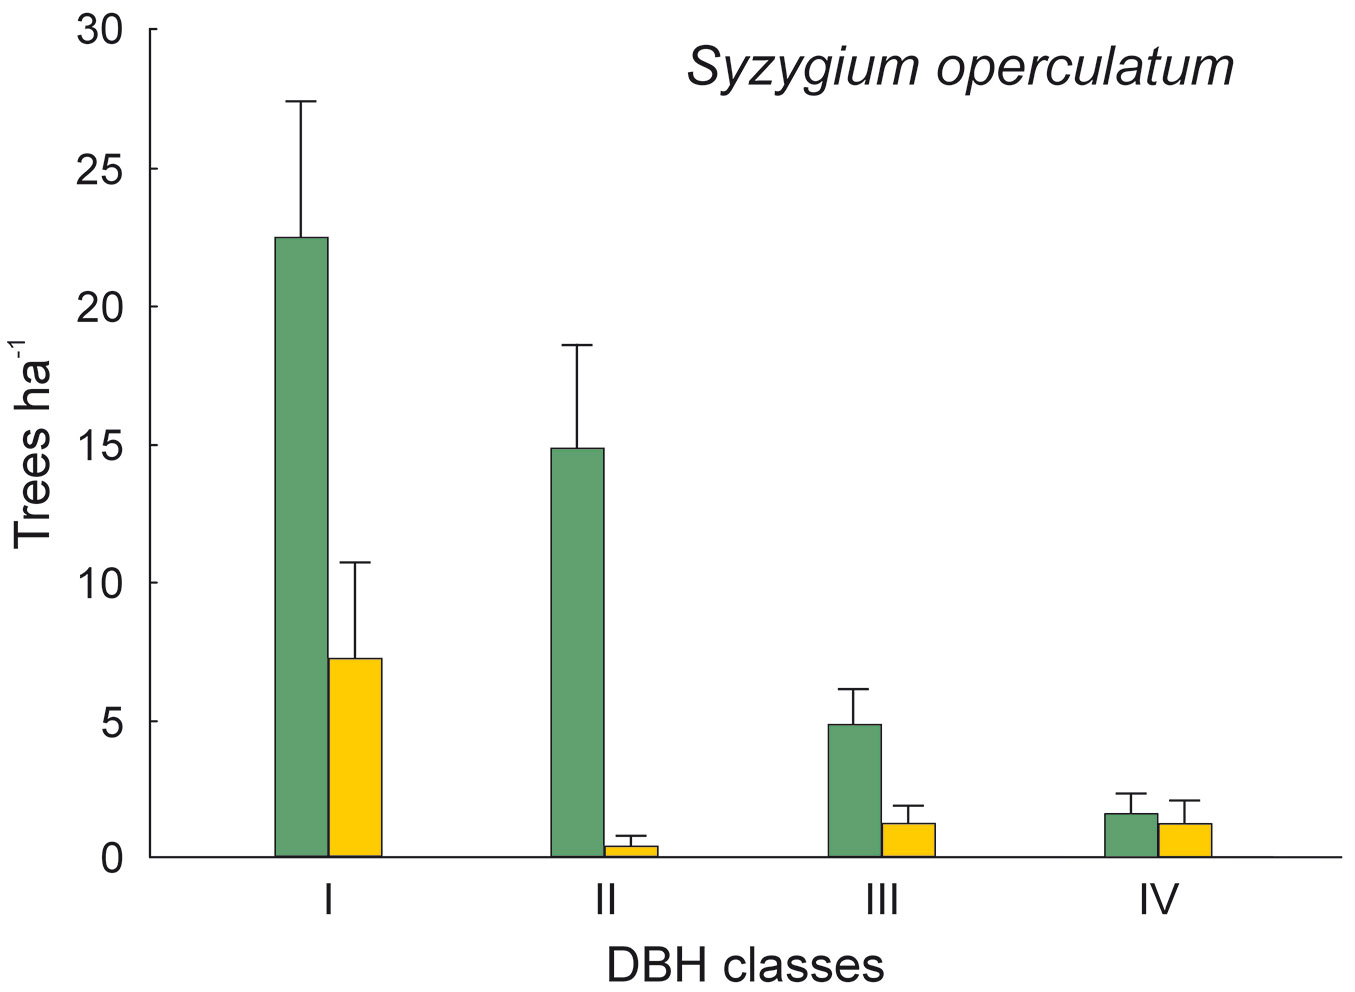
Fig. 5 - Distribution of Dillenia pentagyna according its DBH classes in sal forest. Colors represent the two study sites: green - the park site (low human pressure, N = 25) and yellow - the buffer site (higher human pressure, N = 25). Mean and SE are shown.
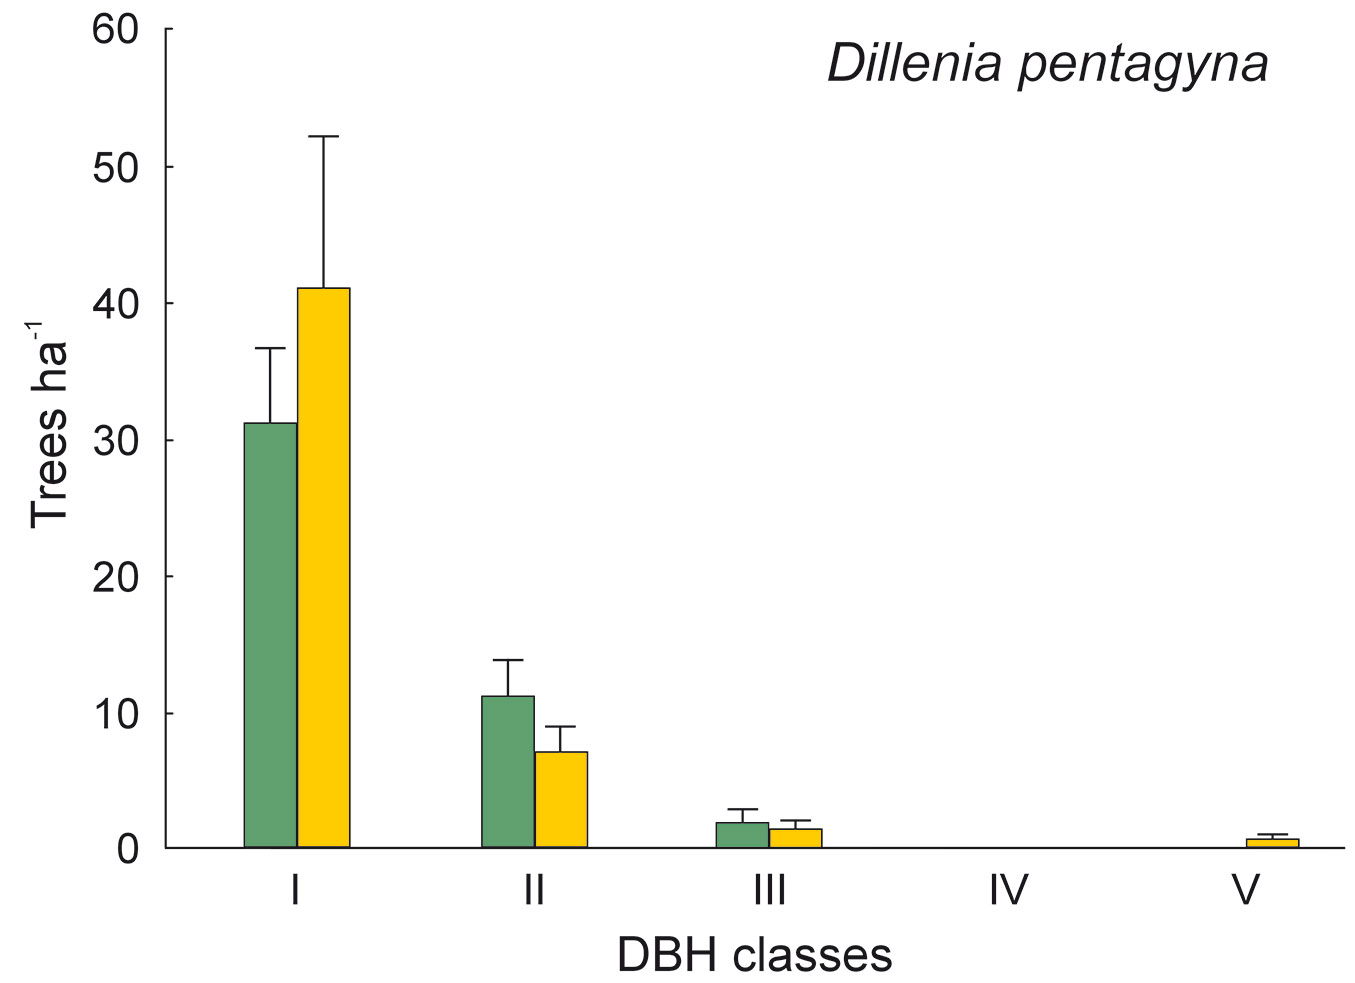
Fig. 6 - Distribution of dead trees according their DBH classes in the sal forest. Colors represent the two study sites: green - the park site (low human pressure, N = 25) and yellow - the buffer site (higher human pressure, N = 25). Mean and SE are shown.
Cavity trees
Density of trees with at least one cavity was slightly higher in the park site (on average: 16.0 ha-1, N = 25) compared to the buffer site (12.4 ha-1, N = 25), but such difference was not significant (p > 0.05 - Tab. 1). Cavities were found only in 6.7% of all trees in the park site and in 5.3% trees in the buffer site. Most cavity trees were alive (82.5% in the park site and 90.3% in the buffer site - Tab. 3), with no significant differences between sites (χ2 = 0.36, df = 1, p = 0.5513 with Yates correction). Live cavity trees were 5.8% in the park site and 4.9% of all live trees in the buffer site, while dead cavity trees represented 28.0 and 23.1% of all snags, respectively. Snags were overrepresented among the cavity trees both at the park site (χ2 = 13.85, df = 1, p =0.0002) and at the buffer site (χ2 = 6.45, df = 1, p = 0.0111).
Tab. 3 - Number of cavity bearing trees and number of cavities according to tree species in the park site (totally 2.5 ha) and in the buffer site (2.5 ha).
| Species | Park site | Buffer site | Total | ||||||
|---|---|---|---|---|---|---|---|---|---|
| Cavity trees | No. of Cavities |
Cavity trees | No. of Cavities |
Cavity trees | No. of Cavities |
||||
| Live | Dead | Live | Dead | Live | Dead | ||||
| Shorea robusta | 14 | 2 | 20 | 15 | 2 | 21 | 29 | 4 | 41 |
| Syzygium operculatum | 13 | 2 | 20 | 3 | 1 | 6 | 16 | 3 | 26 |
| Dillenia pentagyna | 4 | 0 | 5 | 6 | 0 | 13 | 10 | 0 | 18 |
| Myrsine semiserrata | 0 | 0 | 0 | 1 | 0 | 5 | 1 | 0 | 5 |
| Terminalia alata | 0 | 0 | 0 | 2 | 0 | 2 | 2 | 0 | 2 |
| Semecarpus anacardium | 0 | 0 | 0 | 1 | 0 | 1 | 1 | 0 | 1 |
| Syzygium cumini | 1 | 0 | 1 | 0 | 0 | 0 | 1 | 0 | 1 |
| Toona ciliata | 1 | 0 | 1 | 0 | 0 | 0 | 1 | 0 | 1 |
| Unknown species | 0 | 3 | 9 | 0 | 0 | 0 | 0 | 3 | 9 |
| Total | 33 | 7 | 57 | 28 | 3 | 48 | 61 | 10 | 104 |
Considering all 50 plots from both sites together, only one cavity was found in 50 out of 71 cavity trees, while 21 trees had from 2 to 5 cavities. In 16 trees two cavities were found, and only five trees had more than two cavities. In live cavity trees an average of 1.41 ± 0.88 cavities (n = 61) were found, and in snags 1.80 ± 1.23 cavities (n = 10), but this difference was not significant (z = 1.17, p = 0.2406).
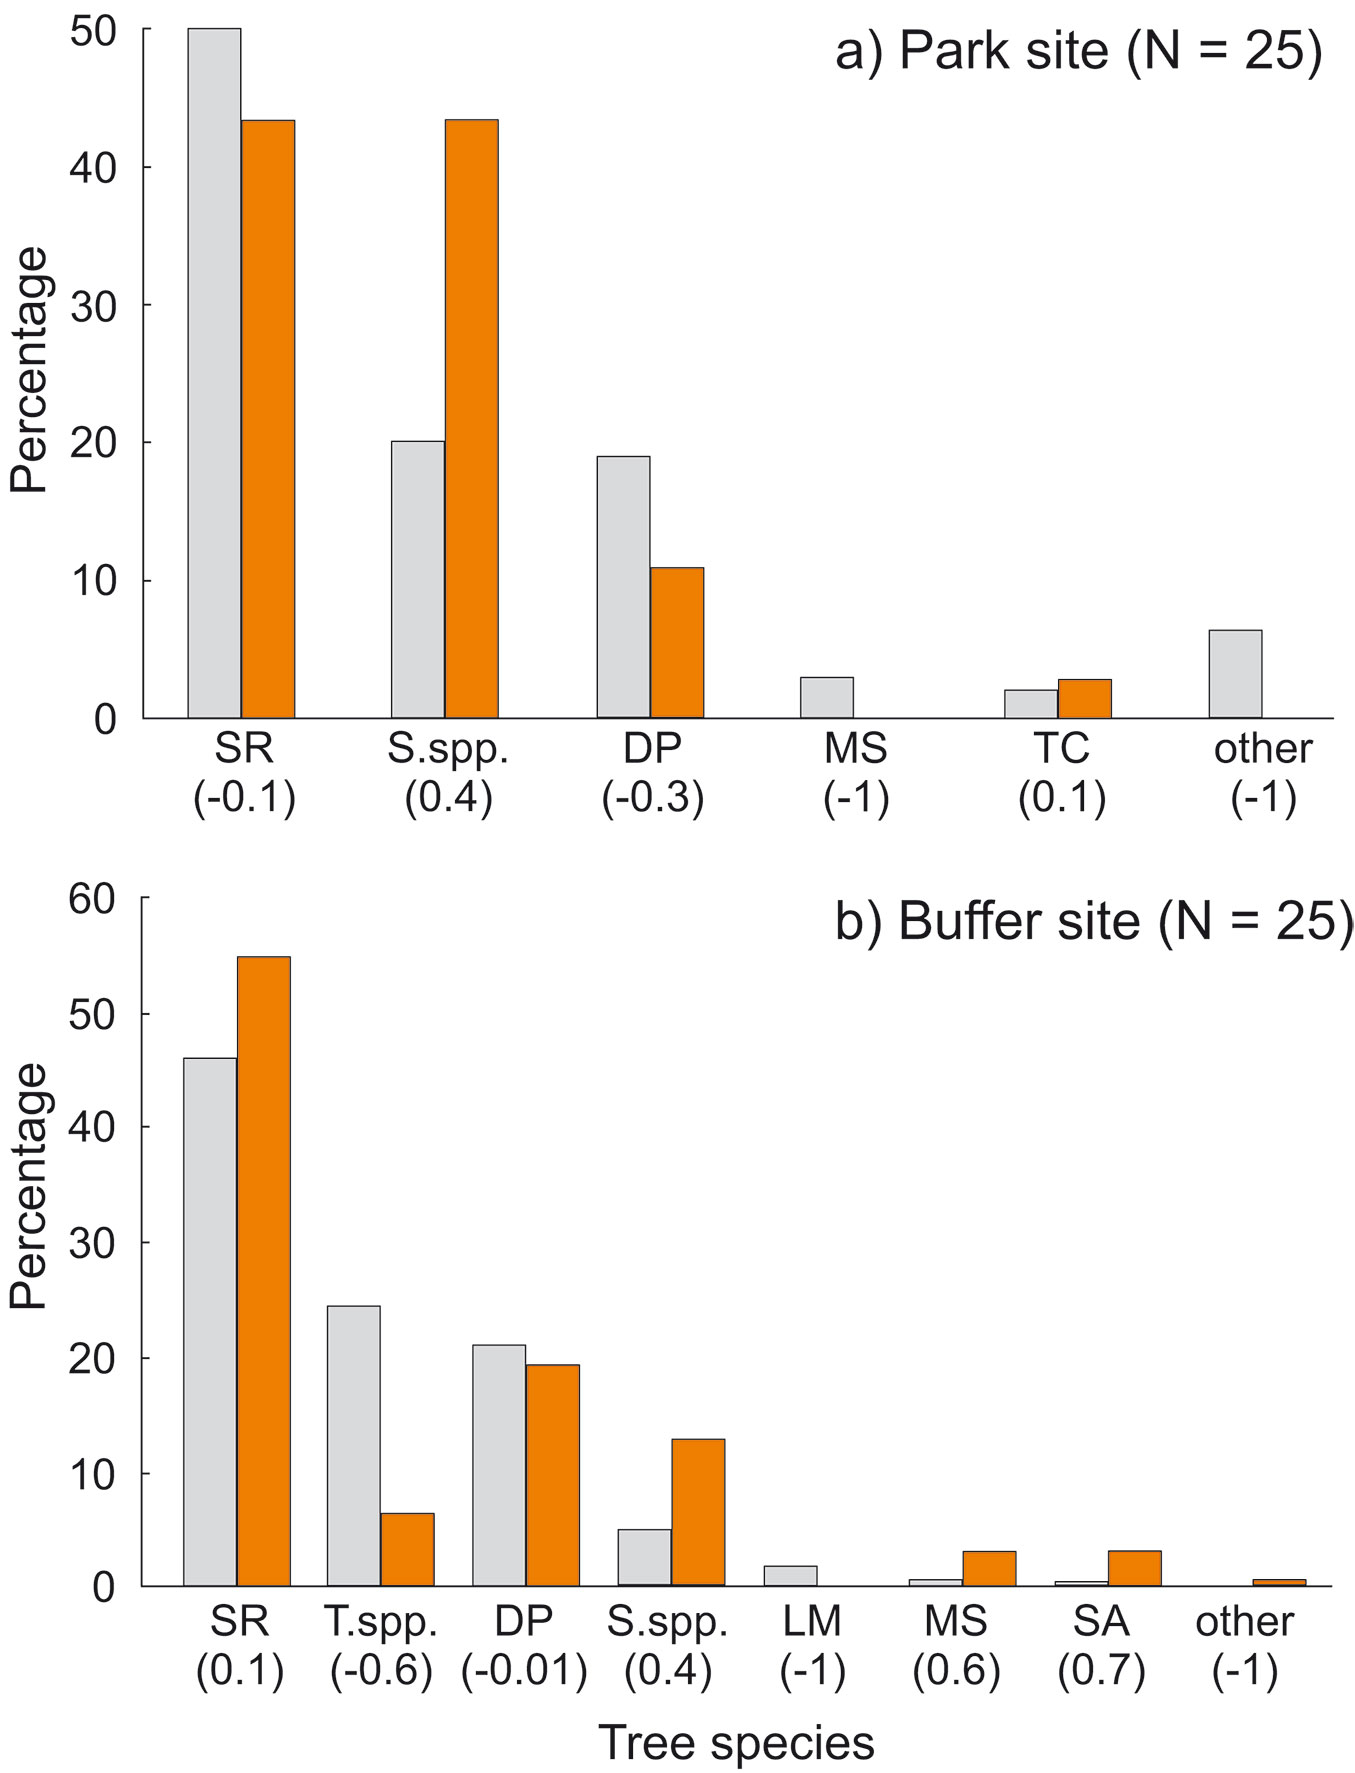
We recorded cavities in eight tree species. In both sites most cavities were found on trees of three species, i.e., S. robusta, S. operculatum and D. pentagyna. The other species rarely contained cavities (Tab. 3). Some species were clearly overrepresented among cavity trees: Syzygium operculatum in all plots (Ivlev’s index 0.37 in the park site and 0.44 in the buffer site), Myrsine semiserrata and Semecarpus anacardium in the buffer site (Ivlev’s index 0.65 and 0.72, respectively - Fig. 7).
Fig. 7 - Percentage of cavity trees in relation to tree species availability in: (a) the park site (low human pressure); and (b) the buffer site (higher human pressure). All live and dead trees combined. (SR): Shorea robusta; (S.spp): Syzygium spp.; (DP): Dillenia pentagyna; (MS): Myrsine semiserrata; (TC): Toona ciliata; (T.spp.): Terminalia spp.; (LM): Litsea monopetala; (SA): Semecarpus anacardium. Ivlev’s electivity index in parentheses (positive values: overrepresented species; negative values: underrepresented species). Colors represent trees: grey - resources; orange - cavity trees.
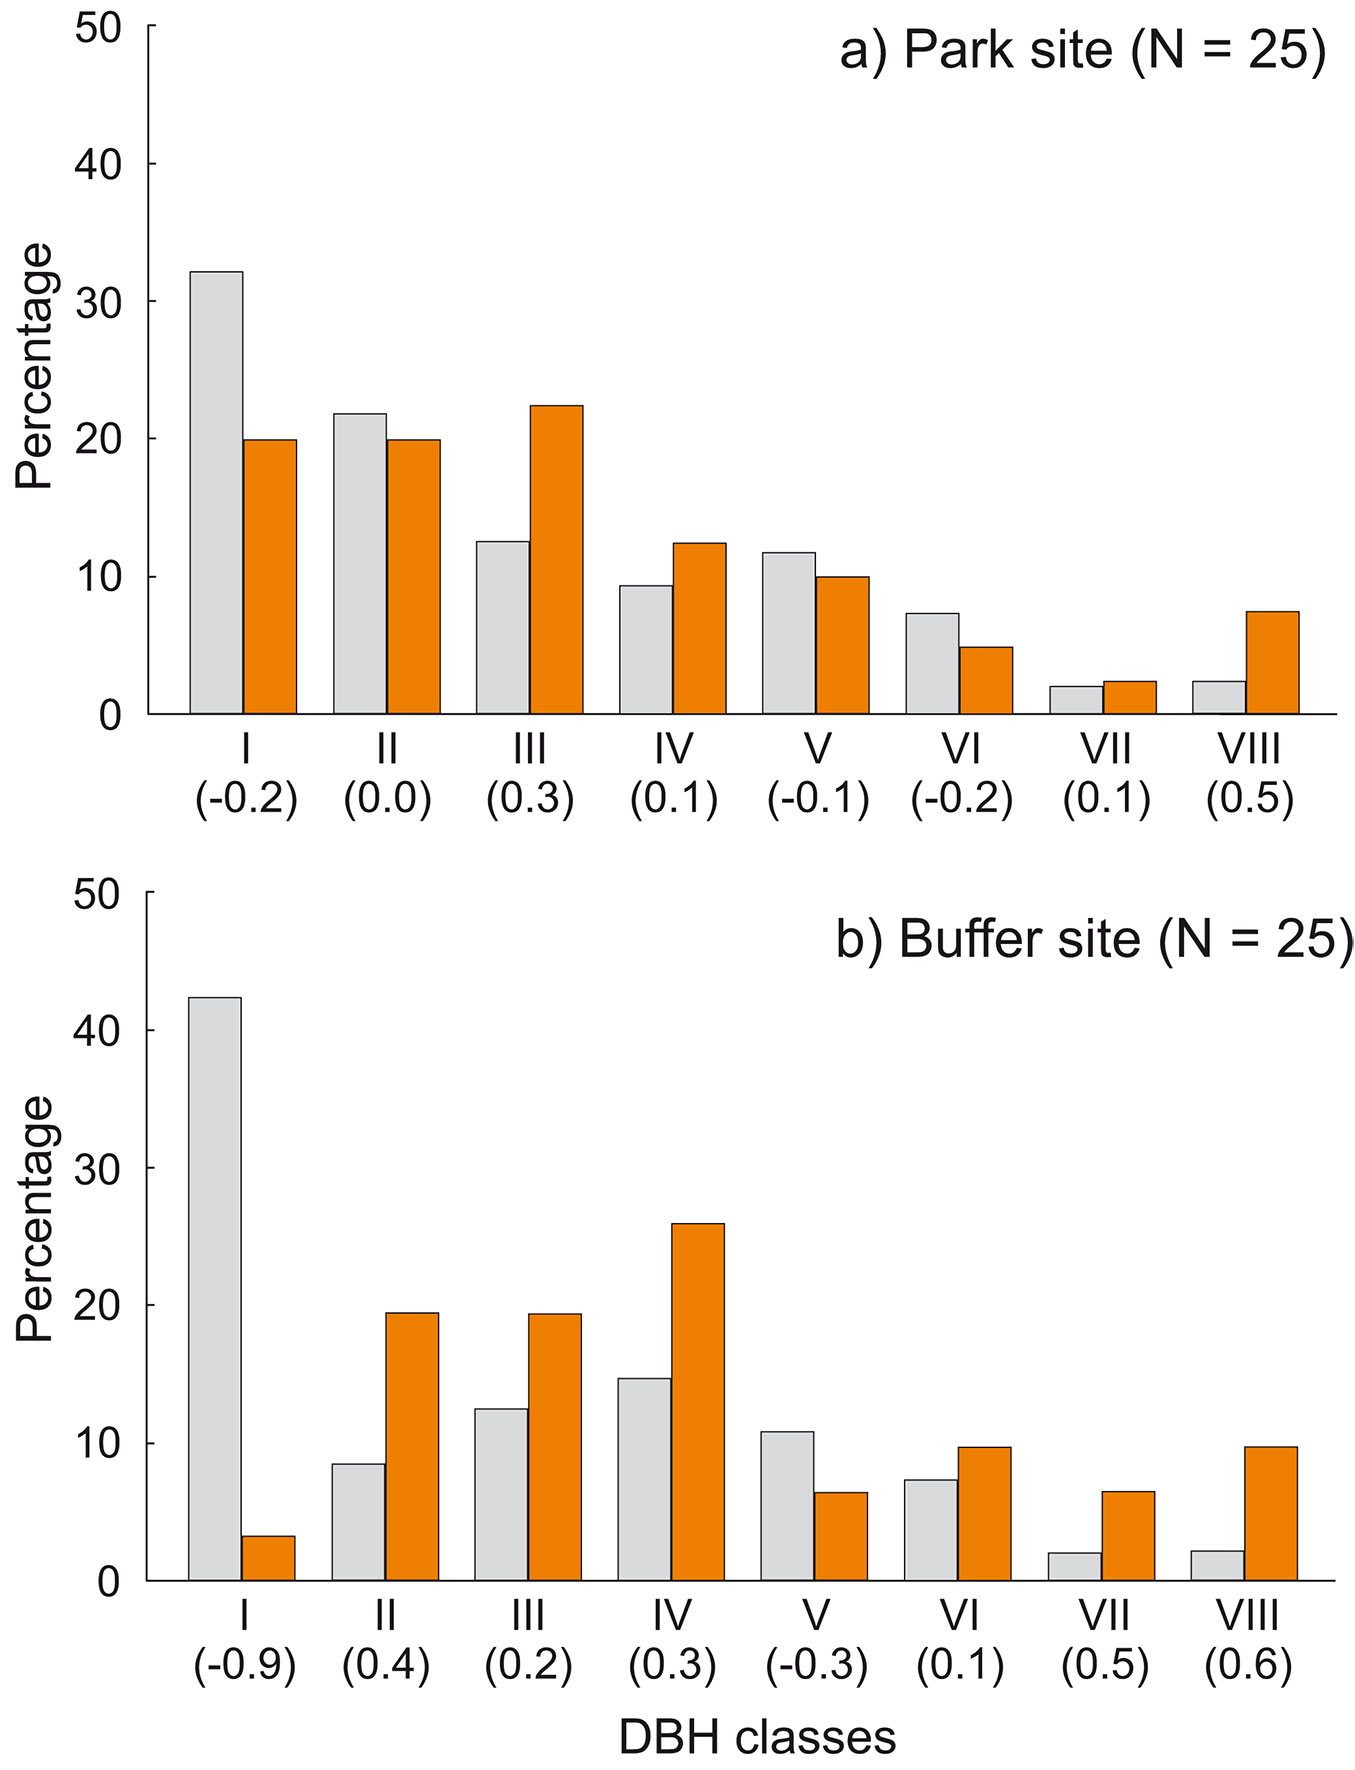
Cavity trees were on average thinner in the park site (DBH 38.7 ± 19.97 cm, n = 40) compared to the buffer site (47.7 ± 22.53 cm, n = 31), but these differences were not significant (z = -1.95, p = 0.0508). DBH of cavity trees ranged from 12 to 111 cm, and differed depending on the species: the thickest were S. robusta (55.7 ± 22.48 cm, n = 33), while S. operculatum had 29.7 ± 10.34 cm, n = 19 and D. pentagyna 26.87 ± 7.51 cm, n = 10 (Fig. 8). Two-thirds of cavity trees were at least 30 cm in DBH. Within DBH classes, thickest trees were overrepresented: in the park site VIII class (Ei = 0.47), in the buffer site VIII and VII (Ei = 0.63 and 0.52, respectively - Fig. 9).
Fig. 8 - Average DBH of the most common tree species with cavities (live and dead combined) in all study plots in the sal forest. Boxes represent the mean ± SD, whiskers represent ± SE.
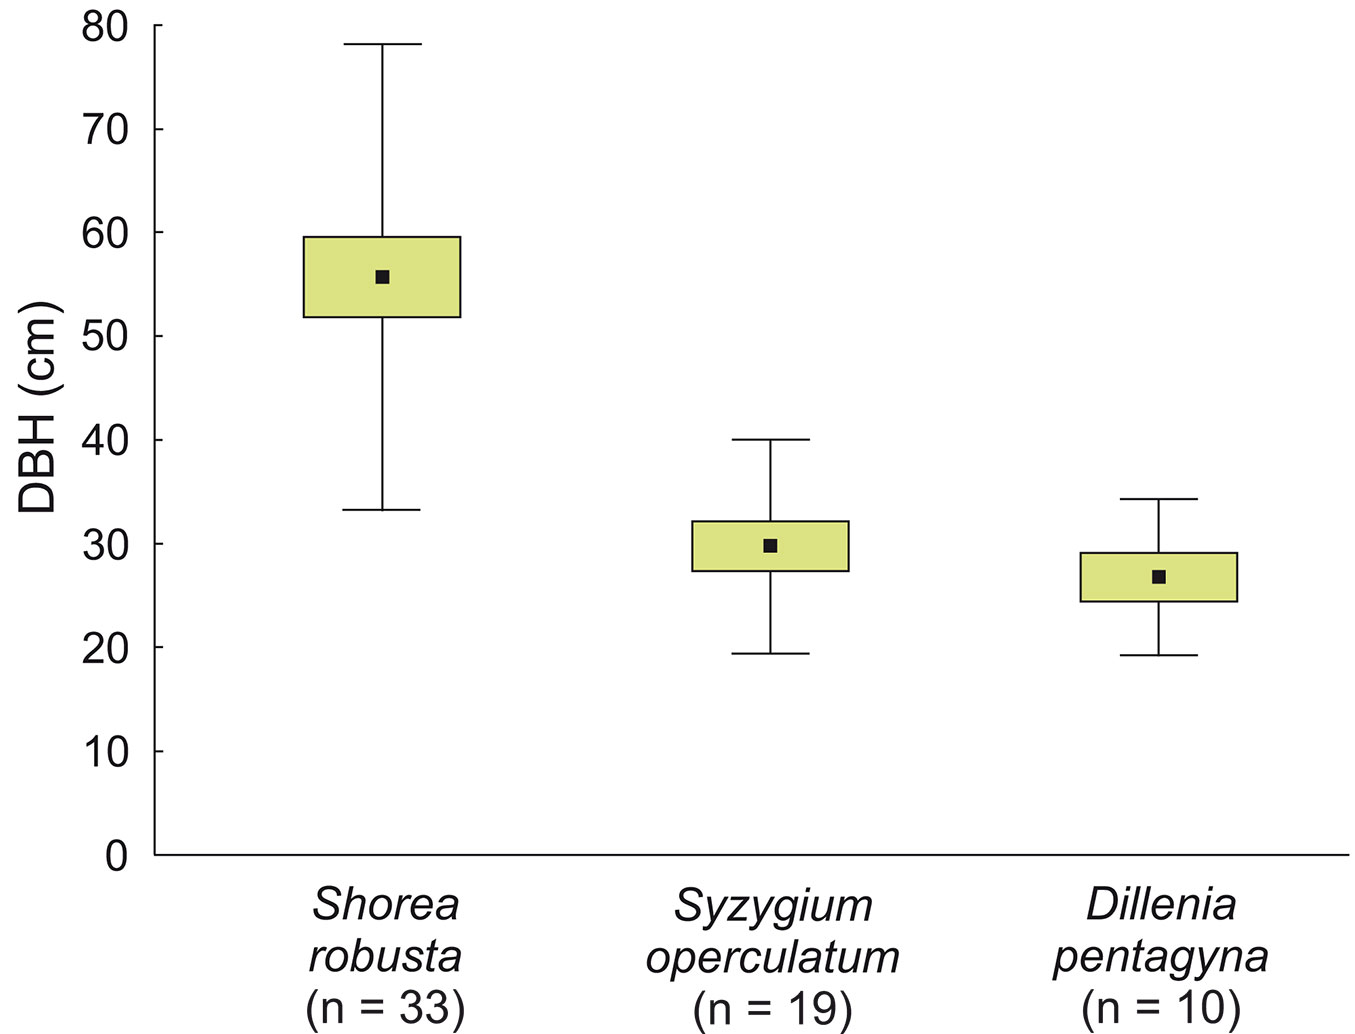
Fig. 9 - Percentage of cavity trees in relation to DBH classes availability in: (a) the park site (low human pressure); and (b) the buffer site (higher human pressure). All live and dead trees combined. Ivlev’s electivity index in parentheses (positive values: overrepresented DBH classes; negative values: underrepresented DBH classes). Colors represent trees: grey - resources, orange - cavity trees.
The generalized linear models indicated that tree species, tree condition and DBH were important variables for predicting the presence of cavities (Tab. 4). DBH had a significant positive effect - the larger the DBH of a tree, the higher the probability of cavity presence (z = 5.20, p < 0.001). Presence of cavities was less likely in dead trees, as suggested by the significant effect of tree condition. The results indicated that chances for the presence of cavities significantly differed between the tree species (Tab. 4).
Tab. 4 - Generalized linear models (GLMs) predicting the probability of a cavity occurrence in trees (N= 1049, cavity present = 68, cavity absent = 981). The top-ranked model (first line), selected by step-wise deletion using the Akaike’s information criterion (AIC), was used to estimate the parameters reported in Tab. 5. (w): Akaike weights; (AUC): area under the curve.
| Model | AIC | ΔAIC |
w
|
AUC |
|---|---|---|---|---|
| Species + Condition + DBH | 474.52 | 0 | 0.02 | 0.743 |
| Species + Condition + DBH + Site | 474.99 | 0.47 | 0.08 | 0.749 |
| Species + Condition + DBH + Site + Condition × DBH | 475.71 | 1.19 | 0.21 | 0.750 |
| Species + Condition + DBH + Site + Condition × DBH + Site × DBH | 477.71 | 3.19 | 0.31 | 0.752 |
| Species + Condition + DBH + Site + Condition × DBH + Site × DBH + Species × DBH | 480.88 | 6.36 | 0.39 | 0.786 |
Cavities
The density of cavities was on average 22.4 ± 4.04 ha-1 in the park site (N = 25) and 19.2 ± 3.31 ha-1 in the buffer site (N = 25), and these differences were not significant (p >0.05 - Tab. 1). Most of the cavities were non-excavated (natural cavities, 71.4% in the park site and 77.1% in the buffer site - Tab. 1), and the proportion of natural and excavated cavities in the two sites was similar (χ2 = 0.43, df = 1, p = 0.5120). Only three out of the 27 woodpecker-made cavities were located in snags (11.1%) while almost one-fifth of 77 natural cavities (19.5%) were located in snags.
Discussion
Despite the different management regimes, we found that the two study sites (the park site and the buffer site) were structurally similar. This may be explained by the fact that both sites are included in a conservation area, with only some differences in the human impact (see below). Indeed, the two study sites represent an intermediate part of a gradient from natural to heavily-managed sal forests, whose extremes are likely to present more pronounced differences. Nonetheless, our study sites differed in several structural parameters like density of snags, density of several tree species and the distribution of size classes of trees. Moreover, we found a positive effect of tree size and condition on the presence of cavities, i.e., cavities were significantly more frequent on living trees with larger DBH. Our main results and their implications for the conservation of biodiversity in sal forests are discussed below in a management perspective.
Trees in studied areas
The lower density of snags observed at the buffer site may be easily explained by a more intense removal of dead wood by villagers. The Chitwan National Park authorities does not allow removal of dead trees within the park, though some snags are illegally removed regardless ([41]). Annual prescribed fires also has the potential to lower the number of snags in both sites, as dead trunks of some tree species burn more readily than other species that are fire resistant (e.g., sal dead trunks - [19]). In general, the amount of dead wood is usually much lower in managed forests in comparison to protected forests ([48], [25], [15]). However, this pattern is highly dependent on forest history, intensity of forest management, natural disturbance regimes and forest type ([29], [16]).
As compared to temperate forests, snags are generally less abundant in the tropical forest due to their higher decomposition rates ([21]). Indeed, in the European temperate deciduous forests of the Bialowieza National Park (Poland), the proportion of dead trees with DBH > 20 cm was 9.9% of the total number of stems, while their density was as much as 26.7 trees ha-1 ([48]). Such figure is about 4-6 times higher than that observed at the Chitwan National Park, which has a subtropical monsoon climate with high humidity during the rainy season, thus favoring a more rapid decomposition of wood. However, S. robusta, the dominant species in our study area (both in terms of living and dead trees) is extremely durable and resistant to decay ([35]).
The thinnest DBH classes (I and II) of living trees represented half of all trees found in each studied site, indicating a well established regeneration at both sites. The most common species S. robusta had more trees of the thinnest class in the buffer site stand than in the park site. This may be due to the frequent logging and firewood collection at the buffer site as compared with the park site, thereby creating suitable conditions for younger generation of trees to develop. Similarly, the DBH class of S. operculatum ranged from I to IV class in both forest types with higher presence in the park site, while D. pentagyna ranged from I to III DBH classes with a higher share in the buffer site.
An interesting finding is the reverse pattern of occurrence of S. operculatum and T. alata in the park site vs. the buffer site. Both Syzygium operculatum and Terminalia alata represent the seral communities towards the climax of the sal forest. Such species are found more often in the mixed forest type, i.e., in the buffer site than in the relatively pure sal stand of the park site. However, S. operculatum and T. alata trees are also found in the park site but only at the edge forest/grassland. S. operculatum has no economic or cultural value, though its edible fruits likely favor seed dispersal by people. Also, both species are not particularly palatable for cattle, thus having a higher chance of persistence in the forest. On the other hand, T. alata has valuable timber, and sometimes the leaves are used as fodder for cattle. As a consequence, branch cutting may promote the formation of cavities in this species.
Characteristic of cavity trees
The average density of cavities in our study was higher than the global average estimated by Remm & Lõhmus ([39]) which was 16 ha-1. However, cavity density may be much higher in low-latitude forests ([36], [45]). It was well documented in North American forests that, when non-excavated cavities are scarce, tree stands can sustain anyway healthy community of cavity nesters if enough suitable trees for excavators are available ([1]). A meta-analysis by Remm & Lõhmus ([39]) showed that forest management strongly affects the distribution of tree cavities. A surplus of tree cavities can exist in natural forests ([18], [46], [9], [13], [54]). In this study, we found a similar availability of cavities at two sites that nominally differed in their management intensity. Nonetheless, the human impact on the park site was not negligible (as mentioned above), and this could have hampered the detection of differences between sites under different management intensities. However, it is worth to notice that, despite the human use of the forest for firewood and livestock, quite a few cavities were found at the buffer site. This is in contrast with the outcome of intensive forest management practices applied in European or American forests, that dramatically reduce tree cavity resources ([10], [49]).
Although most cavities were found in S. robusta (the most common species in the study sites), cavities were clearly underrepresented in this species. Differences in cavity occurrence among species have been already reported ([1], [54], [55]). In our study, in addition to S. robusta, S. operculatum and D. pentagyna were important cavity trees. On the other hand, our results concerning S. operculatum are contradictory to some extent (compare Tab. 5 and Fig. 7), suggesting that not the species itself but its DBH distribution may affect the presence of cavities in this species. When DBH was included in the model as covariate, the species effect of S. operculatum was not significant anymore. Furthermore, both S. operculatum and D. pentagyna, that actually never grow very high and thick, captured a substantial proportion of cavities in our study. Although the wood of the above-mentioned species is considered hard (D. pentagyna), very hard (S. operculatum) or even extremely hard (S. robusta), their predisposition to the formation of cavities is apparent ([26]). This is probably linked to processes like wood cracking, branch breakage and also wood decaying caused by fungi. For example, old specimens of S. robusta are generally resistant to fire, but fire wounds result in infection and the trees became prone to heart rot due to fungi ([5]).
Tab. 5 - Parameter estimates for the minimal adequate model (AIC = 474.52) for the prediction of the probability of cavity occurrence in trees (N = 1049, cavity present = 68, cavity absent = 981). The incidence of cavities in trees was the response variable (binomial GLM). Dillenia pentagyna was the reference species to which other species were compared.
| Coefficients | Estimate | Std. Error | z value | Pr(>|z|) |
|---|---|---|---|---|
| Intercept | -2.307 | 0.612 | -3.768 | <0.001 |
| Other species | -0.685 | 1.086 | -0.631 | 0.528 |
| Species Litsea monopetala | -14.820 | 1088.0 | -0.014 | 0.989 |
| Species Myrsine semiserrata | -0.244 | 1.090 | -0.224 | 0.823 |
| Species Semecarpus anacardium | 0.008 | 1.105 | 0.007 | 0.994 |
| Species Shorea robusta | -1.464 | 0.502 | -2.915 | 0.004 |
| Species Syzygium operculatum | 0.670 | 0.427 | 1.570 | 0.116 |
| Species Terminalia alata | -2.296 | 0.850 | -2.701 | 0.007 |
| Species Toona ciliata | 0.313 | 1.096 | 0.286 | 0.775 |
| Species Trewia nudiflora | -14.750 | 1314.0 | -0.011 | 0.991 |
| Tree condition Live | -1.376 | 0.499 | -2.756 | 0.006 |
| DBH | 0.044 | 0.009 | 5.217 | <0.001 |
Cavity trees were found mostly to be relatively thick (average DBH: 43 cm). Most cavities were found on living trees rather than on snags in both forest types. Similar result were found in a tropical forest of Costa Rica ([6]) and in Canadian forests ([2], [6]). In contrast, Hussain et al. ([23]) found 59% of cavities in dead trees in a coniferous forest of Pakistan, and Walankiewicz et al. ([50]) recorded the three-fourth of cavities in snags of coniferous forests in the Bialowieza National Park (Poland). In summary, the proportion of cavities found in living trees vs. snags seems to be dependent on stand type, as well as on the wood characteristics of the tree species (softness/hardness).
Our study revealed that non-excavated cavities in both forest types (77%) were more common than excavated (woodpecker-made) cavities. In a mature forest in Mongolia three-fourth of secondary cavity birds nested in non-excavated cavities ([4]). The presence of woodpeckers does not seem a prerequisite to support a diverse cavity-dependent community, as exemplified by the existence of forest ecosystems without woodpeckers or other active excavators in Australia and New Zealand ([20]). In contrast, the Chitwan forest has a diverse woodpecker community (over 15 species) providing a fairly high number of newly-excavated cavities each year. Our study from sal forest indicates that these cavities account only for a minor share of all available cavities. The assessment of their use by cavity-dependent organisms shall be the object of future research.
Management implications
Although we did not find any evidence that human impact may reduce the density of tree cavities, a lower density of snags at the buffer site compared to the park site was found. Dead trees are relatively important for the occurrence of tree cavities. Furthermore, based on our results we cannot exclude that several differences could exist in the usage by dependent organisms of snag cavities as compared with those found on living trees. According to the operational plan of forest management in the Khorsor buffer zone, selected dead, dying, diseased, depressed wood is allowed to be removed from the forest. Based on the above considerations, we recommend to ensure the presence of some snags in the managed forests, as they are the potential substrate for cavities of specialized species, as well as the habitat for beetles and other insects which represent the preferential food for woodpeckers. Moreover, we found that non-excavated cavities on living trees were more abundant than woodpecker-made cavities at both study sites. Based on our findings, S. robusta and S. operculatum are particularly important tree species for cavity formation in both living and dead trunks. Therefore, management plans should take into account the release of a certain amount of potential cavity substrate, both living trees and snags, according to the species and their trunk dimensions.
Our study is based on a limited dataset not covering the whole spectrum of environmental conditions of the sal forests in Nepal. Indeed, the two study sites represent a small part of the broader gradient from natural to heavily-managed sal forests. Therefore, our results should be considered as an initial assessment of cavity resources in this broadly-distributed forest ecosystem. Further studies are needed to throw light on the use of cavity resources by the community of cavity-dependent organisms, as well as on S. robusta as keystone tree species for cavity formation in the forests of the whole Indian Subcontinent.
Acknowledgements
This research was funded by the Swedish University of Agricultural Sciences, Sweden, and Siedlce University of Natural Sciences and Humanities, Poland (19/91/S). Anil Gurung, Suresh Chaudhari, Shiva Raj Thanet, Prakash Chapaghai and Bindu Adhikari helped us in the field work. The Institute of Forestry, Pokhara Campus, Department of National Park and Wildlife Conservation, and the Chitwan National Park and National Trust for Nature Conservation authority made our work possible by providing permission to conduct fieldwork. We thank all of the contributors. We also heartily thank Kerry L. Nicholson for valuable comments on an earlier version of manuscript and for language improvement.
References
Gscholar
Gscholar
Gscholar
Gscholar
Gscholar
Gscholar
Gscholar
Gscholar
Gscholar
Gscholar
Gscholar
Authors’ Info
Authors’ Affiliation
Tribhuvan University, Institute of Forestry, Pokhara Campus (Nepal)
Wieslaw Walankiewicz
Department of Zoology, Siedlce University of Natural Sciences and Humanities, Prusa 12, 08-110 Siedlce (Poland)
Mammal Research Institute, Polish Academy of Sciences, Waszkiewicza 1, 17-230 Bialowieza (Poland)
Tribhuvan University, Department of Zoology, Kathmandu (Nepal)
National Trust for Nature Conservation, Bachhauli-2, Sauraha, Chitwan 44204 (Nepal)
Swedish University of Agricultural Sciences, Department of Ecology, Grimsö Wildlife Research Station, SE-73091 Riddarhyttan (Sweden)
Swedish University of Agricultural Sciences, School for Forest Management, P.O. Box 43, SE-73921 Skinnskatteberg (Sweden)
Corresponding author
Paper Info
Citation
Bhusal P, Czeszczewik D, Walankiewicz W, Churski M, Baral R, Lamichhane BR, Mikusinski G (2015). Availability of tree cavities in a sal forest of Nepal. iForest 9: 217-225. - doi: 10.3832/ifor1493-008
Academic Editor
Massimo Faccoli
Paper history
Received: Nov 05, 2014
Accepted: Jul 08, 2015
First online: Oct 16, 2015
Publication Date: Apr 26, 2016
Publication Time: 3.33 months
Copyright Information
© SISEF - The Italian Society of Silviculture and Forest Ecology 2015
Open Access
This article is distributed under the terms of the Creative Commons Attribution-Non Commercial 4.0 International (https://creativecommons.org/licenses/by-nc/4.0/), which permits unrestricted use, distribution, and reproduction in any medium, provided you give appropriate credit to the original author(s) and the source, provide a link to the Creative Commons license, and indicate if changes were made.

Web Metrics
Breakdown by View Type
Article Usage
Total Article Views: 53474
(from publication date up to now)
Breakdown by View Type
HTML Page Views: 43985
Abstract Page Views: 3828
PDF Downloads: 4299
Citation/Reference Downloads: 14
XML Downloads: 1348
Web Metrics
Days since publication: 3932
Overall contacts: 53474
Avg. contacts per week: 95.20
Article Citations
Article citations are based on data periodically collected from the Clarivate Web of Science web site
(last update: Mar 2025)
Total number of cites (since 2016): 7
Average cites per year: 0.70
Publication Metrics
by Dimensions ©
Articles citing this article
List of the papers citing this article based on CrossRef Cited-by.
Related Contents
iForest Similar Articles
Short Communications
An assessment of the availability of cavities for secondary cavity-nesting birds in certified and conventionally-logged Neotropical rainforests
vol. 13, pp. 318-322 (online: 28 July 2020)
Research Articles
The Habitat-Trees experiment: using exotic tree species as new microhabitats for the native fauna
vol. 8, pp. 464-470 (online: 22 October 2014)
Research Articles
The recreational valuation of a natural forest park using travel cost method in Iran
vol. 2, pp. 85-92 (online: 10 June 2009)
Research Articles
Inorganic and organic nitrogen uptake by nine dominant subtropical tree species
vol. 9, pp. 253-258 (online: 02 December 2015)
Research Articles
Factors affecting the quantity and type of tree-related microhabitats in Mediterranean mountain forests of high nature value
vol. 14, pp. 250-259 (online: 21 May 2021)
Book Reviews
National forest inventories: contributions to forest biodiversity assessments (2010)
vol. 4, pp. 250-251 (online: 05 November 2011)
Research Articles
Investigating the effect of selective logging on tree biodiversity and structure of the tropical forests of Papua New Guinea
vol. 9, pp. 475-482 (online: 25 January 2016)
Research Articles
An index of structural complexity for Apennine beech forests
vol. 8, pp. 314-323 (online: 03 September 2014)
Research Articles
Single-tree influence on understorey vegetation in five Chinese subtropical forests
vol. 5, pp. 179-187 (online: 02 August 2012)
Research Articles
Influence of pH, nitrogen and sulphur deposition on species composition of lowland and montane coniferous communities in the Tatrzanski and Slowinski National Parks, Poland
vol. 12, pp. 141-148 (online: 27 February 2019)
iForest Database Search
Search By Author
Search By Keyword
Google Scholar Search
Citing Articles
Search By Author
Search By Keywords
PubMed Search
Search By Author
Search By Keyword


