Investigating the effect of selective logging on tree biodiversity and structure of the tropical forests of Papua New Guinea
iForest - Biogeosciences and Forestry, Volume 9, Issue 3, Pages 475-482 (2016)
doi: https://doi.org/10.3832/ifor1732-008
Published: Jan 25, 2016 - Copyright © 2016 SISEF
Research Articles
Abstract
Unsustainable exploitation of tropical forest resources is raising worldwide concern. In Papua New Guinea (PNG) timber harvesting has been identified as a major contributor to deforestation and forest degradation but its impact on biodiversity is still poorly understood. In this study we investigated the effect of selective logging on tree taxonomic composition, structure and diversity of PNG forests. We used data from 101 one-hectare permanent sample plots (PSPs) belonging to two vegetation types: low altitude forests on plains and fans (type P) and low altitude forests on uplands (type H). We used multivariate techniques to test for significant differences in species composition between plots of different vegetation types and disturbance regimes, identifying the tree taxa to which these differences could be ascribed. ANOVA was used to test for differences between logged-over and unlogged forest PSPs with respect to biodiversity (richness, Shannon’s diversity, Pielou’s evenness) and stand structure (stem density, basal area - BA). Temporal trends of forest features were analyzed using linear regression. Significant differences in taxonomic composition were found between logged-over and unlogged plots of the H type (p = 0.04). No differences were found in richness, diversity and evenness between logged-over and unlogged forest plots, while stem density was higher in the latter (421 ± 153 stems ha-1). Greater BA was found in unlogged forests (30.28 ± 4.45 m2 ha-1) of the H type when compared to the logged-over stands (15.52 ± 4.04 m2 ha-1). We detected positive trends in richness (0.55 ± 0.19 taxa ha-1 yr-1) and diversity after logging. Furthermore, H type forest exhibited positive trends in stem density (9 ± 1 stems ha-1 yr-1) and BA (0.42 ± 0.06 m2 ha-1 yr-1) with elapsed time since harvesting. Our analysis highlights some significant effects of logging activities on biodiversity and structure of PNG forests. Additionally, forests exhibited a significant recovery with respect to richness, diversity and stand structure. These preliminary results will be compared with data collected by the forthcoming National Forest Inventory in order to assess and monitor the effects of human activities and ecological factors on PNG forest biodiversity and develop appropriate conservation measures and sustainable management strategies.
Keywords
Selective Logging, Biodiversity, Basal Area, Papua New Guinea, Multivariate Analysis, National Forest Inventory, Permanent Sample Plots, REDD+
Introduction
Tropical forests cover less than 10% of the global land area though likely harbor more than half of all species on Earth. The island of New Guinea possesses the third largest tropical rainforest on the planet after the Amazon and the Congo Basin. About half of that forest belongs to Papua New Guinea (PNG) with about 33 Mha covered by closed natural forest ([40]). The forests of PNG have been ranked among the world’s ten most ecologically distinctive forest regions ([17], [51], [16]), accounting for an estimated 6% of the world biodiversity ([21], [14], [42]) and providing habitat for approximately 11 000 plant species currently described, and some 9 000-14 000 yet to be discovered ([65]).
Deforestation and forest degradation are listed among the main causes of species loss in biodiversity hotspots ([48], [55], [64]), particularly in tropical areas. However, well managed logged forests still provide many important ecological services such as carbon sequestration, soil erosion control, water regime regulation ([24], [12]) and are home to numerous animal and plant species ([23], [59]). In PNG, logging operations have suffered in the past from poor performance and a high level of corruption ([8], [27]), which finally led to the passing of the National Forestry Act of 1991 ([56]), aiming to provide regulations for a more sustainable supply of timber.
Nonetheless, logging of native forests in PNG is still criticized for a host of unsustainable practices ([44], [45]). Timber concessions usually exceed 80 000 ha each and the timber removed during harvesting operations averages about 15 m3 ha-1, while the planned return period is usually of 35-40 years ([41]). Previous studies questioned the sustainability of current logging practices, without achieving unanimous agreement as for the rate and extent of deforestation and forest degradation. Sherman et al. ([62], [63]) highlighted a net loss of 15.0% of primary rain forest - at an annual rate of 1247 km2 - and a degradation of 8.8% to secondary forest between 1972 and 2002. On the other hand, Filer et al. ([28]) criticized the former and reported the lower deforestation rate by Bellamy & McAlpine ([11]) - 392 km2 per year - as more reliable. Nevertheless, they acknowledged the complex long-term effects of timber harvesting on forest carbon stocks.
In order to address such issues, remuneration for forest values such as carbon sequestration capacity has generated much interest in PNG, particularly as an alternative income source to large-scale timber harvesting ([30]). In this respect, useful data will be provided by the forthcoming multipurpose National Forest Inventory (NFI), which will be a key component of the National Forest Monitoring System that PNG is required to establish for Reducing Emission from Deforestation and Forest Degradation (REDD+). REDD+ is an expected mechanism under the United Nations Framework Convention on Climate Change (UNFCCC), which consists in a wide range of activities aimed at preserving forest carbon stock, as well as promoting biodiversity conservation ([37], [47], [33]).
With this study we aimed to contribute to PNG’s REDD+ preparedness activities by providing a first insight on the effect of selective logging on forest biodiversity. To that end, we analyzed data from an existing set of Permanent Sample Plots (PSPs) that was established to assist planning of forest management options ([4]) and to provide a ground-based estimation of forest C and C flux associated with selective logging ([31], [32]). We used PNG’s PSP data to shed light on the impact of selective logging on PNG’s forest structure as well as on tree taxonomic diversity, which has shown a significant cross-taxon congruency and can therefore be considered as a proxy for other taxonomic groups ([36], [39], [9]). In particular, we sought to: (1) determine the effect of selective-logging on tree taxonomic composition by using multivariate analyses techniques; (2) assess the impact of selective-logging on indicators such as forest structure, richness, diversity and evenness: (3) analyze changes of these indicators in relation to the years after logging (YAL).
The sampling scheme of the existing PSPs was not meant to provide an assessment of the effect of forest management on biodiversity in such a wide and heterogeneous area as PNG. A systematic assessment and a clear experimental design are lacking, which makes it difficult to go beyond the analyses described in this paper. Since only a few studies have been carried out to this purpose, some of which were limited to specific regions ([60], [45]) and some focused on stand structure rather than biodiversity ([68]), we decided to conduct a first extensive preliminary evaluation despite the current limitations, to inform the design of the forthcoming NFI.
Materials and methods
Dataset
Background
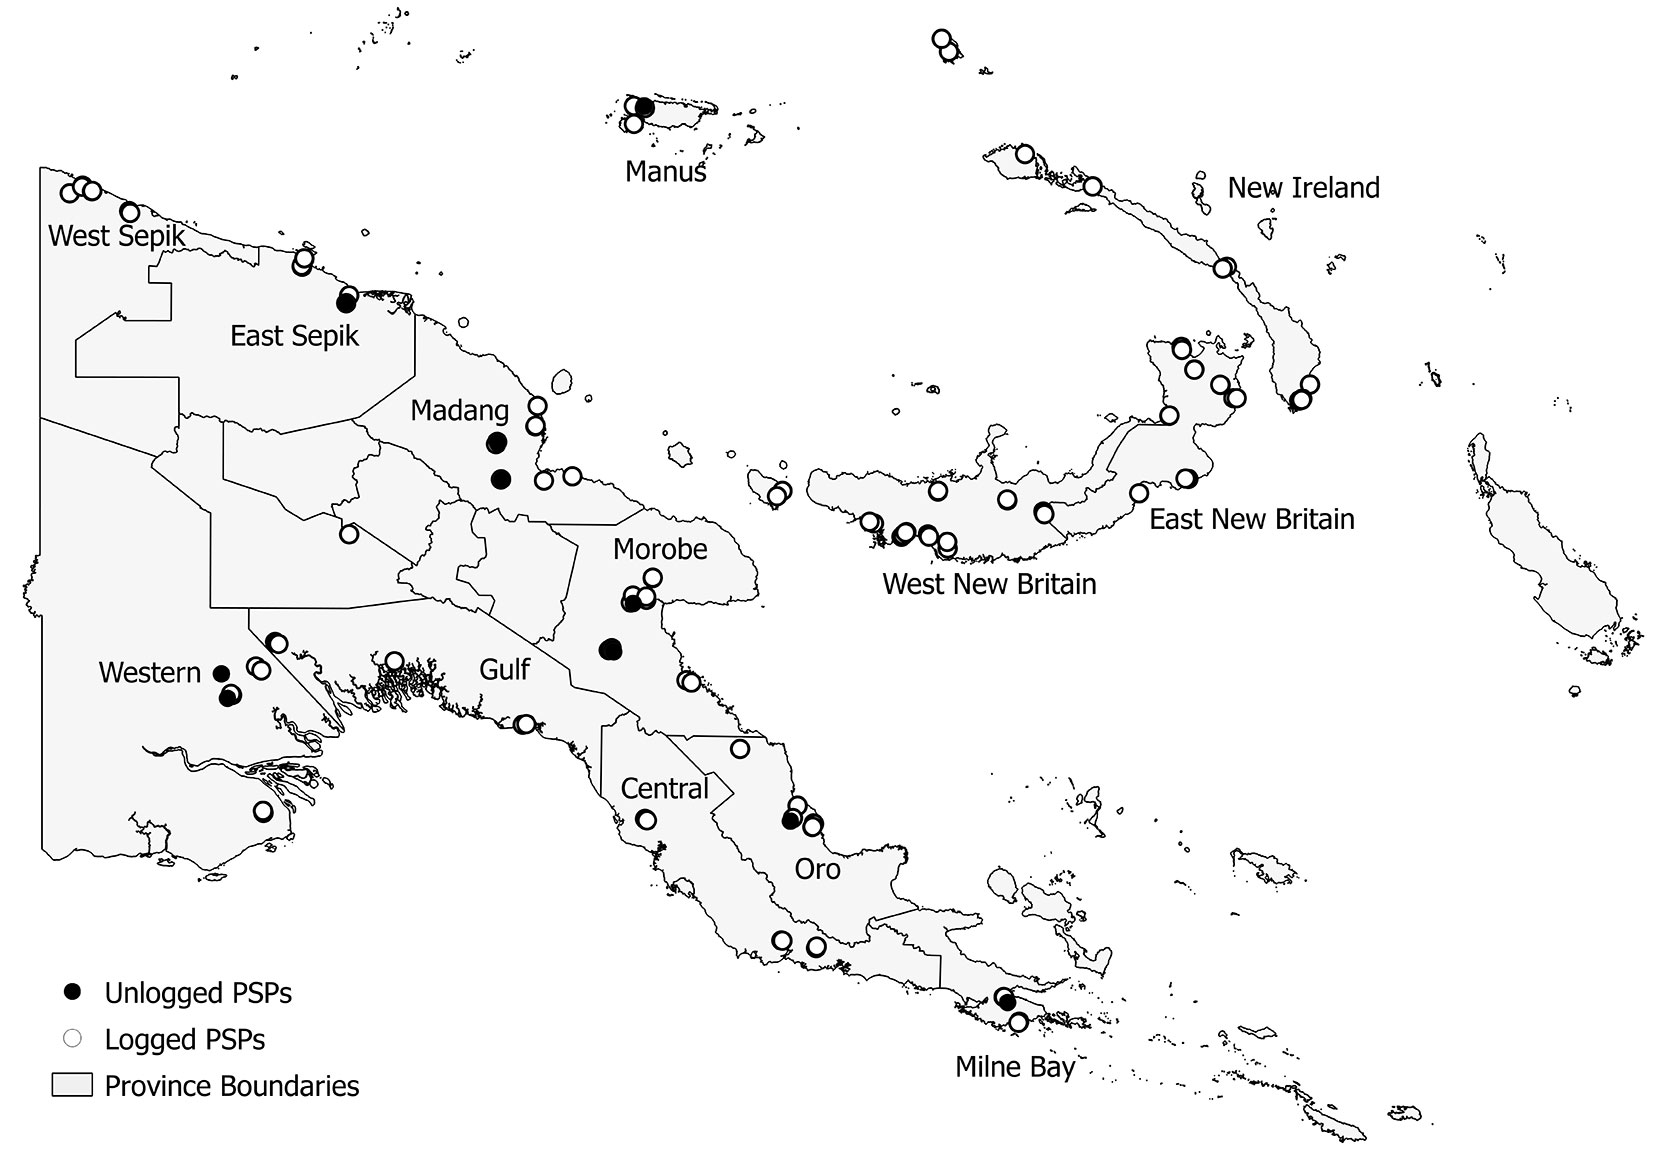
One hundred and thirty five PSPs (Fig. 1) were established and measured by the PNG Forest Research Institute (PNGFRI) between 1992 and 2008. Most PSPs were located in lowland tropical forests (<1000 m a.s.l.) distributed throughout PNG where most harvesting activities took place. Only ten plots were established in montane forests. Annual rainfall in all these plots averages over 3000 mm yr-1. Plots were located on a range of soil groups, with the most common being Alfisols, Entisols, Inceptsols, and Mollisols ([58]). The plots were established in pairs, usually within 1 km of each other, according to the procedures adapted from Alder & Synnott ([3]) which are reported in PNGFRI (unpublished 1994). Each plot is 1 ha (100 × 100 m) in size and subdivided in 25 sub-plots of 20 × 20 m, where all stems ≥ 10 cm diameter at breast height (DBH) are mapped and identified to genus or species level. Measurements taken on trees included DBH and height. The data has previously been collated, cleaned and transferred into a Microsoft Access® database ([29]). A total of 122 plots were established in selectively harvested forests, usually 0-4 YAL (although 7 PSPs were established from 6 to 13 YAL), and were specifically intended to monitor forest recovery and re-growth. Only 13 PSPs were located in unlogged forests.
Fig. 1 - Map of PNG showing PSP locations across the country. Empty circles represent 122 logged-over PSPs, while 13 unlogged PSPs are represented by black circles. Province boundaries as well as province names are shown.
PSP used in the study
Despite the precise field procedure some problems occurred during preliminary analysis of data. Twenty four PSPs were labeled as burnt by fires associated with El Niño Southern Oscillation (ENSO) drought event of 1997/1998 ([10], [31], [32]), which could have influenced the number and abundance of tree species in the plots. Thus, these plots were not included in our analyses. Moreover, montane forests were under-represented with only 10 PSPs, of which just two located in unlogged forests. Hence, to avoid biased results, we carried out the analyses on a set of 101 unburned lowland forest PSPs for a total of 342 censuses with 119 404 tree measurements (32 243 stems recorded at the first census). Stems were identified either to genus or species level, for a total of 527 taxa. Due to the current incomplete taxonomic knowledge of tree species in PNG and the difficulties their identification, this limitation is expected to occur in all forest surveys so that our results are comparable with those from previous similar studies (see [68]) or from the forthcoming NFI.
Forest vegetation types
To account for differences among vegetation types (VTs), the PSPs were superimposed on a PNG vegetation map ([38]) and the corresponding VT was recorded. The 101 plots were distributed into two different lowland VTs: 49 PSPs (6 in unlogged forests) in low altitude forest on plains and fans (P), and 52 PSPs (4 in unlogged forests) in low altitude forests on uplands (H).
Data analysis
Tree taxonomic composition
Selective-harvesting in PNG affects forest structure with respect to basal area (BA), timber volume and number of stems ([68]). Our aim was to determine whether logging activities had an impact on tree species composition, focusing on both commercial and non-commercial species ([22], [57]). To this end, we compared the taxonomic composition of unlogged and logged-over (0-4 YAL) PSPs using multivariate analysis techniques. PRIMER6 version 6.1.14 and PERMANOVA+ version 1.0.6 analysis software ([19]) was used for ordination analyses of tree taxonomic composition. Abundance data was square-root transformed to downweight the importance of the highly abundant species ([20]).
We used canonical analyses of principal coordinates (CAP) ordination method ([7]) with the Bray-Curtis dissimilarity metric ([15]), and permutation multivariate analysis of variance (PERMANOVA - [5]) and PERMDISP ([6]) to test for differences in statistical location and dispersion, respectively, among VTs and logging regimes. Significant differences in dispersion between groups of different logging regimes within a VT would put some constraints in the interpretation of significant PERMANOVA results. For all the tests we set 9999 permutations. The correlation of tree species (after transformation) with the CAP axes was calculated to determine which taxa were responsible for the tested differences. We chose the Pearson correlation coefficient considering only species with an absolute correlation > 0.3 and tested for significant differences between mean abundances of the identified species in different groups using a non-parametric Wilcoxon-Mann-Whitney test. Finally, we identified the life history strategies (LHS) of such species (Damas K.Q., personal communication).
Diversity and structure indexes
To examine the effects of logging on forest diversity, we estimated Shannon’s diversity index ([61]) and Pielou’s evenness measure ([54]) for each plot. The former was calculated as (eqn. 1):
where pi is the proportion of individuals belonging to the i-th species. The Pielou’s index is expressed as (eqn. 2):
where S is the total number of taxa. Additionally, we calculated the total BA and the number of stems for each plot as a measure of tree cover and density.
Differences in richness, diversity, evenness, total BA and stem density between unlogged and logged-over forests (0-4 YAL) within the two VTs were tested with two-way ANOVAs on the first census of the PSPs. Pair-wise Student’s t-tests were carried out when appropriate. To observe trends of the aforementioned indexes with elapsed YAL in both VTs, we fitted five multiple linear regression models. The calculations were carried out using the R software.
Results
Tree taxonomic composition
Significant differences in taxonomic composition were found between the two VTs (Pseudo-F = 1.72; p = 0.01) and between logged-over and unlogged forests (Pseudo-F = 1.76; p = 0.01) which, however, were ascribable only to differences between logged-over and unlogged forests of the H type (t = 1.29; p = 0.04 - Tab. 1). No constraints to the interpretation of PERMANOVA results were detected, as dispersions among the tested groups were homogeneous (Tab. 1).
Tab. 1 - Results of PERMANOVA test for differences in tree taxa composition between PSP of different vegetation types (VT) and logging regime (LOG), pair-wise comparison between levels of factor LOG and PERMDISP test for difference in dispersion. (P): Lowland forests on plains and fans; (H): lowland forests on uplands; (*): p < 0.05; (**): p < 0.01; (***); p < 0.001; (ns): not significant.
| PERMANOVA | Pairwise Comparisons (between LOG levels) |
Dispersion within groups (Mean ± SD) |
PERMDISP test |
||||
|---|---|---|---|---|---|---|---|
| Factors | Pseudo-F | VT | t | Perms | Logged | Unlogged | |
| VT | 1.72 * | P | 1.17 ns | 9869 | 43.28 ± 1.16 | 36.41 ± 2.27 | 2.13 |
| LOG | 1.76 * | H | 1.29 * | 9512 | 42.92 ± 1.39 | 39.14 ± 2.70 | 0.83 |
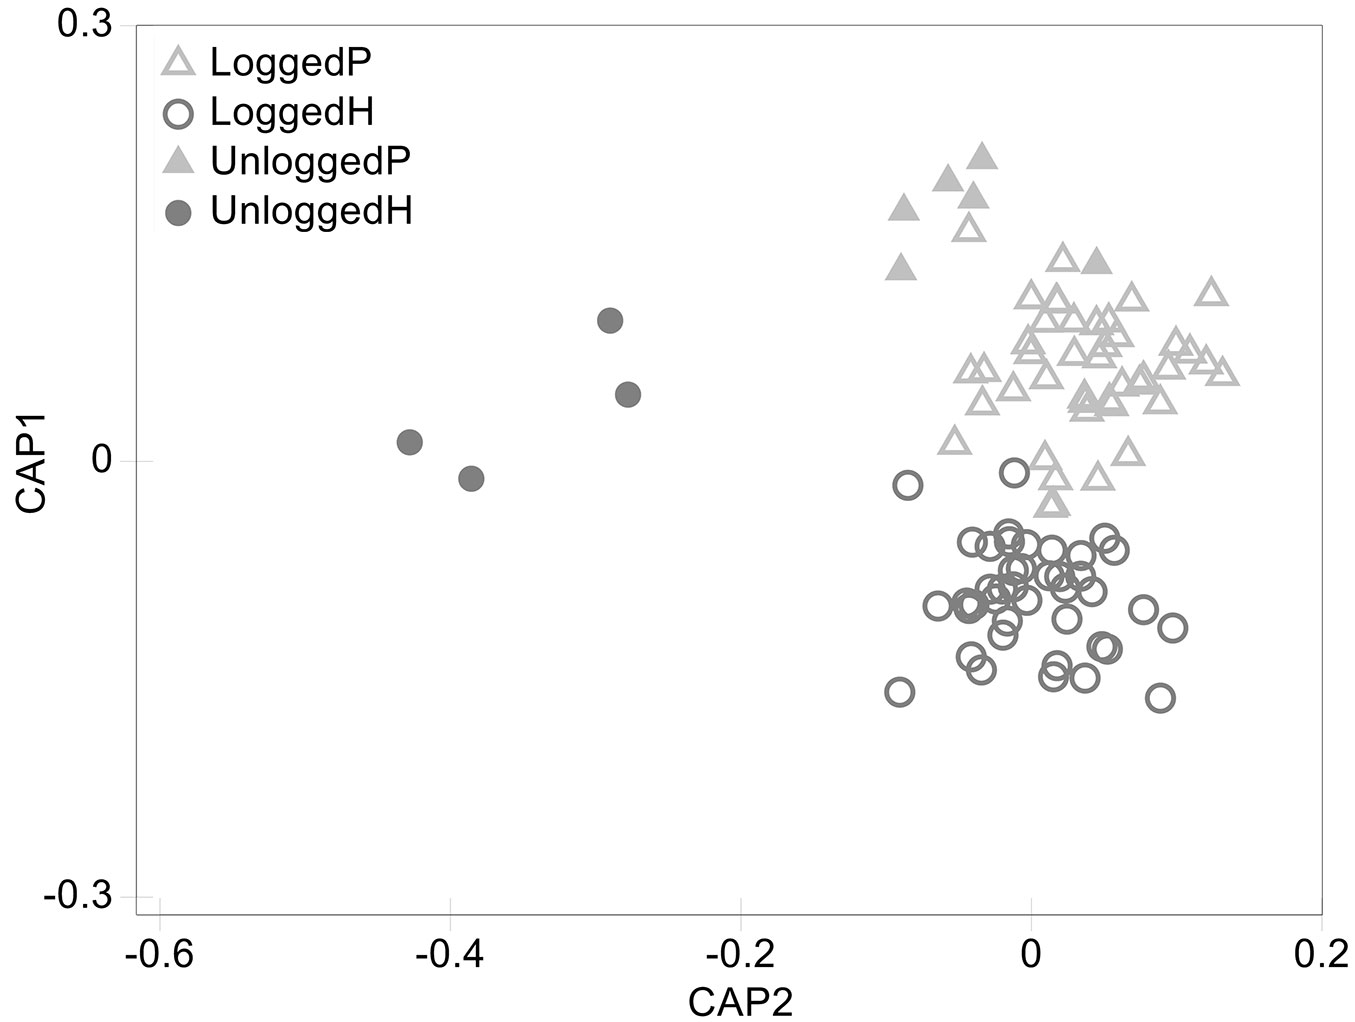
CAP ordination discerned between plots of different VTs and disturbance regimes. However, while logged-over plots are well differentiated from unlogged plots of the type H along axis 2, weaker differences were found between logged-over and unlogged plots of the type P, consistently with PERMANOVA (Fig. 2). The taxa which are responsible for the identified differences within VT H were identified according to their correlation with CAP axis 2. Tab. 2 reports all the taxa with significant differences in abundance between logged-over and unlogged forests of the type H, along with their Pearson’s correlation coefficient and LHS codes. All the taxa showed negative correlation with CAP axis 2, meaning that they were less abundant in logged-over forests (with Calophyllum europhyllum, Dillenia papuana, Litsea firma and Myristica subalulata showing the strongest correlation to the axis 2), the majority of which belonged to the primary species group.
Fig. 2 - CAP ordination of PSPs. Logged-over and unlogged PSPs belonging to different VTs are grouped according to their tree taxonomic composition. (P): Lowland forests on plains and fans; (H) lowland forests on uplands.
Tab. 2 - Pearson’s correlation coefficients of species with CAP axis 2. Average abundances and SDs are reported for logged-over and unlogged forest plot of the H type. (c): commercial species. (LHS): Life History Strategy codes; (SS) short lived secondary species; (LS): long lived secondary species; (P): primary species. (*): p < 0.05; (**): p < 0.01; (***); p < 0.001; (ns): not significant.
| Taxon | Correlation | Logged (stems 100ha-1) |
Unlogged (stems 100ha-1) |
W | LHS |
|---|---|---|---|---|---|
| Alstonia scholaris c | -0.35 | 39 ± 97 | 475 ± 754 | 33.5 * | LS |
| Calophyllum europhyllum c | -0.64 | 39 ± 174 | 1900 ± 2248 | 43.0 ** | LS |
| Dillenia papuana c | -0.56 | 110 ± 526 | 1325 ± 1552 | 24.5 *** | P |
| Drypetes spp . c | -0.36 | 2 ± 16 | 100 ± 141 | 42.5 *** | P |
| Euphorbia spp. | -0.35 | 2 ± 16 | 75 ± 96 | 42.5 *** | SS |
| Litsea firma c | -0.51 | 32 ± 133 | 850 ± 995 | 44.0 ** | P |
| Myristica subalulata c | -0.62 | 78 ± 339 | 2700 ± 3156 | 120.0 ** | P |
| Rhizophora spp. c | -0.48 | 5 ± 22 | 50 ± 58 | 45.0 ** | P |
| Symplocos spp. | -0.58 | 7 ± 26 | 250 ± 332 | 44.0 ** | P |
| Xylopia spp. c | -0.36 | 54 ± 182 | 275 ± 189 | 30.0 ** | LS |
Diversity and structure indexes
Greater taxonomic richness (p = 0.02) and stem density (p = 0.001) were found in P type forests (58 ± 13 taxa ha-1; 355 ± 137 stems ha-1) compared to H type ones (52 ± 12 taxa ha-1; 281 ± 81 stems ha-1). As for richness, diversity (H’) and evenness (J), no significant differences were discovered between logged-over and unlogged forest plots, while we found higher stem density in unlogged PSPs (421 ± 153 stems ha-1) than in logged-over ones (308 ± 110 stems ha-1). Regarding the BA, the interaction factor in ANOVA between logging regime and VT was significant (p = 0.0003). Hence, we analyzed the former separately for the two VTs and found significant differences between logged-over and unlogged plots of the H type forests (p = 0.005 - Tab. 3).
Tab. 3 - Results of the two-way ANOVA for genus richness, diversity (H’), evenness (J), stem density and BA between H and P vegetation types (VT), and logged-over and unlogged (LOG) plots. Separate t-tests were carried out for BA. Means and SDs of the parameters are provided. (P): Lowland forests on plains and fans; (H): Lowland forests on uplands; (*): p < 0.05; (**): p < 0.01; (***); p < 0.001; (ns): not significant.
| Statistics | Factors/Type | Richness (taxa ha-1) |
Diversity ( H’) |
Evenness ( J) |
Stem density (stems ha-1) |
BA (m2 ha-1) |
|
|---|---|---|---|---|---|---|---|
| ANOVA F | VT | 5.50 * | 2.40 ns | 0.06 ns | 10.81 ** | - | 2.47 ns |
| LOG | 0.47 ns | 0.12 ns | 0.04 ns | 8.56 ** | - | 31.46 *** | |
| VT × LOG | 0.20 ns | 0.43 ns | 0.78 ns | 1.27 ns | - | 13.87 *** | |
| Means ± SD | Logged | 54.45 ± 12.66 | 3.39 ± 0.31 | 0.85 ± 0.04 | 307.62 ± 109.64 | Type P | 17.80 ± 4.18 |
| Type H | 15.52 ± 4.04 | ||||||
| t | ns | ||||||
| Unlogged | 57.80 ± 11.93 | 3.43 ± 0.21 | 0.85 ± 0.03 | 421.10 ± 153.30 | Type P | 21.48 ± 7.33 | |
| Type H | 30.28 ± 4.45 | ||||||
| t | ** | ||||||
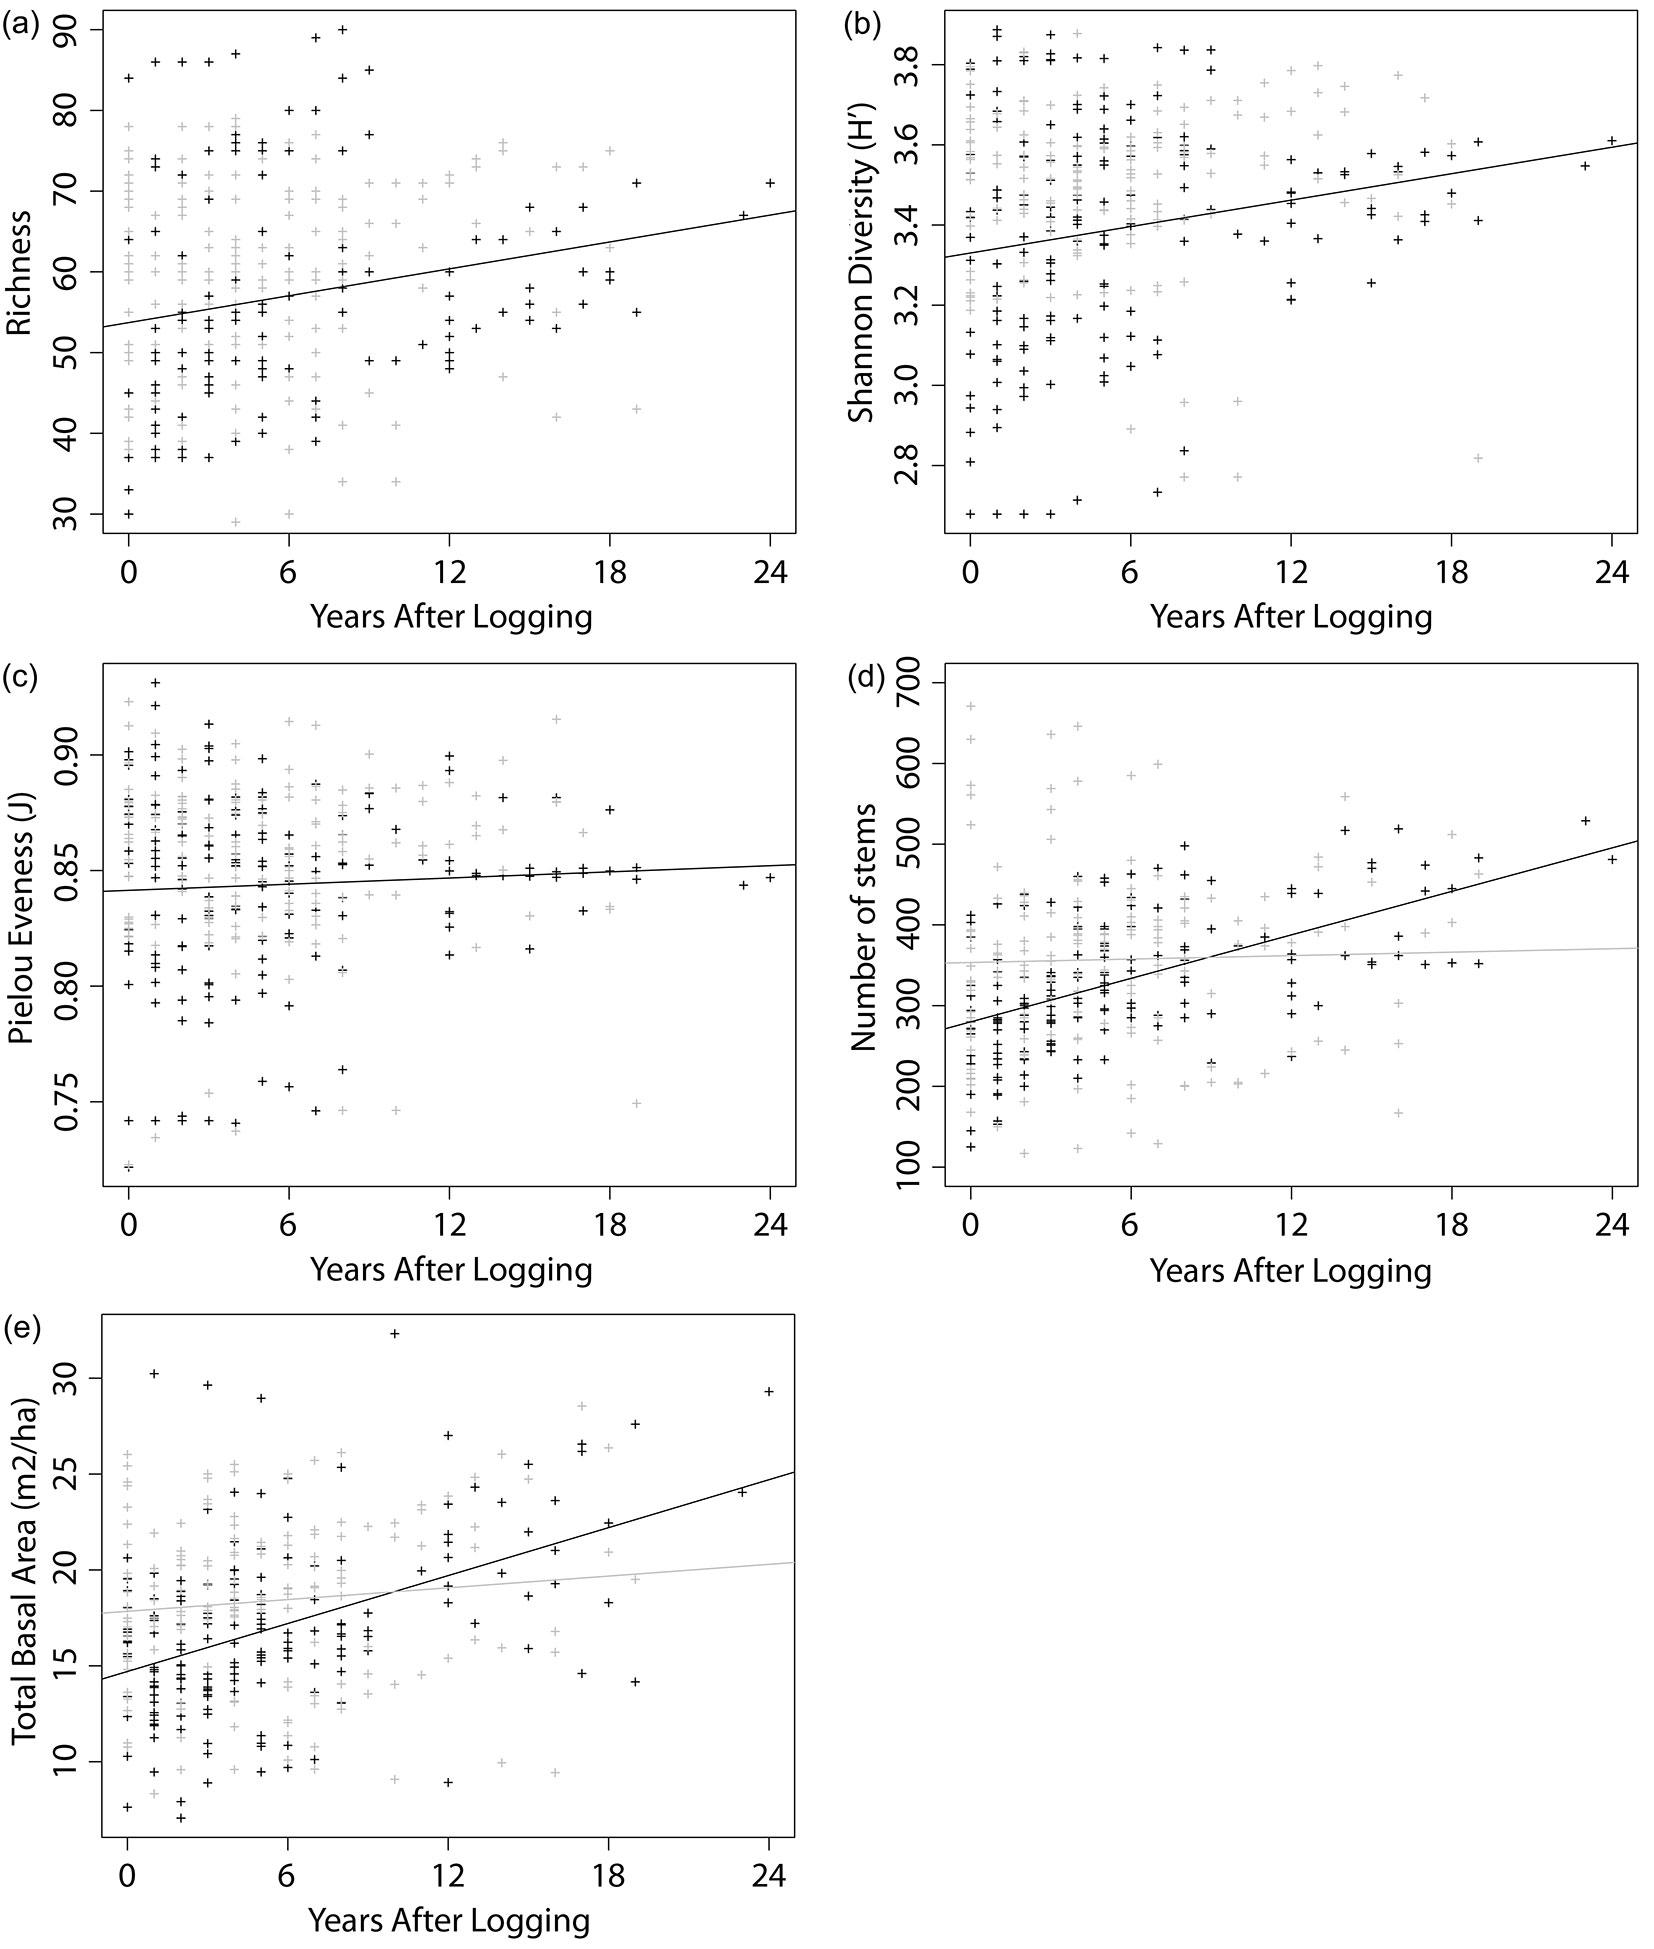
Furthermore, we examined the trends in the considered indexes in relation to the YAL, accounting for different VTs. The outputs of the multiple linear regression models are reported in Tab. 4. The analysis of richness trend with elapsed YAL highlighted a slight increase in the number of taxa (Fig. 3a), with a gain of about one new taxon per hectare every two years. Similarly, diversity showed some increase with time (Fig. 3b), while evenness remained roughly constant through the years (Fig. 3c). The interaction factor (VT × YAL) of the linear model was found significant for stem density and BA (Tab. 4), thus we built separate linear models to analyze their trends with YAL for the two VTs (Tab. 5). No significant trend in relation to the YAL was detected for stem density and BA in P type forests, while H type forests showed a gain of 9 ± 1 stems ha-1 yr-1 and 0.42 ± 0.06 m2 ha-1 yr-1 (Fig. 3d, Fig. 3e).
Tab. 4 - Outputs of the multiple linear regression models for five stand features. Factors considered are vegetation type (VT) and years after logging (YAL). Coefficients values (± SE) and their significance are provided. Adjusted R2 values and significance of the models are reported. (*): p < 0.05; (**): p < 0.01; (***); p < 0.001; (ns): not significant.
| Variable | Adj. R2 | F | Parameter | Intercept | VT | YAL | VT × YAL |
|---|---|---|---|---|---|---|---|
| Richness (taxa ha-1) | 0.036 | 5.05 ** | Coeff. | 53.73 ± 1.41 | 3.69 ± 2.10 | 0.55 ± 0.19 | -0.18 ± 0.29 |
| t | 38.12 *** | 2.98 ns | 1.76 ** | -0.63 ns | |||
| Diversity (H’) | 0.033 | 4.60 ** | Coeff. | 3.33 ± 0.03 | 0.10 ± 0.004 | 0.01 ± 0.05 | -0.01 ± 0.01 |
| t | 106.09 *** | 2.65 * | 2.21 ** | -0.83 ns | |||
| Evenness (J) | 0.006 | 1.67 *** | Coeff. | 0.84 ± 0.004 | 0.01 ± 0.001 | 0.0004 ± 0.01 | 0.0004 ± 0.001 |
| t | 193.20 *** | 0.77 ns | 1.80 ns | -0.54 ns | |||
| Stem Density (stems ha-1) | 0.127 | 16.53 *** | Coeff. | 280.06 ± 10.45 | 73.40 ± 15.58 | 8.98 ± 1.38 | -8.27 ± 2.15 |
| t | 26.79 *** | 4.71 *** | 6.51 *** | -3.84 *** | |||
| Basal area (m2 ha-1) | 0.134 | 17.58 ns | Coeff. | 14.71 ± 0.48 | 3.14 ± 0.72 | 0.42 ± 0.06 | -0.31 ± 0.10 |
| t | 30.44 *** | 4.36 *** | 6.53 *** | -3.17 ** |
Fig. 3 - Scatter plots showing trends in stand features. The graphs reports 322 censuses of 91 logged-over PSPs’ belonging to two different vegetation types: H (black) and P (grey). Linear regression lines are shown. Richness (a) and Shannon diversity (b) showed significant increase in both vegetation types. Stem density (d) and BA (e), increased only in H type forests. Evenness (c) showed no significant change with years after logging.
Tab. 5 - Outputs of the linear regression models for stem density and basal area with years after logging (YAL) in two vegetation types (P and H). Coefficients values (± SE) and their significance are provided. Adjusted R2 values and significance of the models are reported. (P): Lowland forests on plains and fans; (H): Lowland forests on uplands; (*): p < 0.05; (**): p < 0.01; (***); p < 0.001; (ns): not significant.
| Vegetation Type | Variable | Adj. R2 | F | Parameter | Intercept | YAL |
|---|---|---|---|---|---|---|
| P | Stem density (stems ha-1) | 0.005782 | 0.1262 | Coeff. | 353.46 ± 14.07 | 0.71 ± 2.01 |
| t | 25.13 *** | 0.36 ns | ||||
| Basal area (m2 ha-1) | 0.004483 | 1684.0 | Coeff. | 17.85 ± 0.55 | 0.10 ± 0.08 | |
| t | 32.45 *** | 1.30 ns | ||||
| H | Stem density (stems ha-1) | 0.3067 | 75.32 *** | Coeff. | 280.06 ± 7.84 | 8.98 ± 1.04 |
| t | 35.73 *** | 8.68 *** | ||||
| Basal area (m2 ha-1) | 0.2084 | 45.23 *** | Coeff. | 14.71 ± 0.47 | 0.42 ± 0.06 | |
| t | 31.33 *** | 6.73 *** |
Discussion
Our analyses revealed significant differences in tree taxonomic composition between VTs and between logged-over and unlogged forests of the H type (Tab. 1). CAP ordination provided a meaningful graphical representation of these results (Fig. 2). Plots belonging to different VTs were grouped separately along axis 1, despite being very close to each other. Indeed, they shared some of the most common species that are present in PNG lowland forests, such as Pometia pinnata, and Pimeleodendron amboinicum and several common genera like Syzigium spp. and Cananga spp. (which together account for more than 50% of all the identified taxa). Conversely, some species were only present in H type plots (e.g., Calophyllum europhyllum, Gmelina dalrympleana, Decaspermum fruiticosum and Timonius pulposus) while others were found only in plots of the P type (e.g., Gulubia costata, Hopea papuana, Tetrameles nudiflora and Trichospermum burretii). Thus, their subtle differences could be attributed to the relative abundance of the most common taxa and to the composition of the rarest. This is coherent with PNG’s elevation-zone based vegetation classification by Hammermaster & Saunders ([35]), which places all forests between 0 and 1000 m a.s.l. in the same class. An explanation to this could be that, given the narrow altitudinal range, differences in tree species composition of the two lowland forests might rather be related to soil conditions and water drainage ([52]), even though further studies are required to test this hypothesis. When looking at taxonomic composition of H type forests, logged-over and unlogged ones are clearly differentiated (Fig. 2 and Tab. 2). In particular, most of the taxa showing the highest absolute correlation with CAP axis 2 belong to the commercial group and include Calophyllum europhyllum, Dillenia papuana, Litsea firma, Myristica subalulata and Rhizophora spp. This indicates lower abundance of these taxa in logged-over plots, which could be ascribed to commercial harvesting activities. Even some non-commercial taxa, such as Euphorbia spp. and Symplocos spp., were less abundant in logged-over forest plots, suggesting that logging activities affect their abundance as in the case for commercial ones. These effects could be explained by the relatively low selectivity of logging practices that are usually carried out in PNG. Accidental damages during felling of other trees or skidding and construction of logging roads are frequent ([18], [67], [1], [49], [62]) and have a significant impact on all tree species, regardless of their commercial value. Indeed, when 21% of stems were harvested in Bulolo, in the Morobe Province of PNG, only 17% of them remained after the logging operation ([25]). Predictably, a higher abundance of primary taxa (such as Dillenia papuana, Litsea firma and Myristica subalulata) in unlogged forests emerged from the correlation analysis, even though some secondary taxa (Alstonia scholaris, Calophyllum europhyllum, Euphorbia spp., Xylopia spp.) have also shown high correlation with CAP axis 2. This could be explained by taking into account natural (e.g., fire or drought) and anthropogenic disturbance, as the majority of plots was established close to roads in order to facilitate re-measurement. Therefore, human-induced disturbances might have affected even the unlogged plots, favoring the growth of such species. Differently from what observed on type H, no significant differences were detected between logged-over and unlogged forests of the type P. However, even unlogged P forests were characterized by greater abundance of both commercial (e.g., Cananga spp., Hibiscus spp., Sterculia spp.) and non-commercial genera (e.g., Gonocaryum spp., Haplolobos spp., Tristania spp.) and were slightly isolated by CAP ordination (Fig. 2).
Unlogged PSPs seemed to exhibit slightly greater average taxonomic richness and diversity than logged-over plots, although the difference was not statistically significant (Tab. 3). This is consistent with several previous studies, which have reported that the species diversity of logged-over tropical forest was not significantly different from adjacent, undisturbed forest within a relatively short period after logging (e.g., <20 years - [53], [34], [66], [13]). Nevertheless, we believe that our unlogged plots were probably too few to provide a reliable evaluation of the tree richness and diversity which, due to the high variability and heterogeneity of tropical forests, could have been under-estimated.
Earlier studies indicated that BA in PNG primary forests could reach about 30-33 m2 ha-1 and drop to values as low as 10 m2 ha-1 in case of high intensity logging ([50], [2], [43]). The results we obtained for H type forests are in line with these figures, with BA exhibiting higher values in unlogged PSPs (30.28 ± 4.45 m2 ha-1) compared to logged-over plots (15.52 ± 4.04 m2 ha-1). This result witnesses the remarkable level of harvesting in some PNG lowland forests and is very close to the 15 m2 ha-1 reported by Keenan et al. ([41]). Again, forests plots of the P type did not show any difference in this regard, probably because unlogged forests on plains and fans - with only 21.48 ± 7.33 m2 ha-1 - were exposed to some kind of perturbation. This may also explain why no difference was detected between the taxonomic composition of unlogged and logged-over PSPs belonging to the P type. Additionally, stem density was significantly greater in unlogged forests (421 ± 153 stems ha-1) compared to logged-over ones (308 ± 110 stems ha-1) in both VTs.
When looking at trends, both BA and stem density in H type forests significantly increase with YAL (p < 0.0001 - Fig. 3d, Fig. 3e) and reach, after 24 years, values that are comparable to those of unlogged forests (29.30 m2 ha-1 and 481 stems ha-1). This result corroborates the findings of Ferry Slik et al. ([26]), who analyzed recovery processes after logging in the tropical forests of Indonesia. On the other hand, P type forests did not exhibit any significant trend. Diversity indexes revealed differential patterns of change in relation to the YAL. While richness and diversity showed slightly positive trends with elapsed YAL (Fig. 3a, Fig. 3b), evenness remained roughly constant through time. One possible explanation is that new taxa recorded in the plots were represented by very few individuals, thus leading to an increase in richness and diversity only. Moreover, as the available dataset included only trees >10 cm DBH, our analyses did not account for short-lived pioneer species, or species only present as saplings and seedlings, which could strongly influence species evenness, richness and compositional dynamics in the years following timber harvesting.
Conclusions
Our analysis highlighted some significant effects of logging activities on tree biodiversity and structure of PNG forests, although showing contrasting results. These spatio-temporal patterns could be further clarified with an improved sample design, as well as with before-after control-impact (BACI) studies ([46]) with different intensities of timber harvesting. Additionally, the number of unlogged forest plots should be increased to obtain a precise assessment of the impact of logging in PNG forests, and consecutive censuses should be carried out in both logged-over and unlogged plots at the same time, in order to allow for meaningful monitoring of forest dynamics following disturbance. However, our results provided some important preliminary insights on the topic and will be useful when compared with those that will be acquired with the new NFI, which is being developed under the arrangements for REDD+. This will be instrumental in assessing and monitoring the impact of human activities and ecological factors on PNG forest biodiversity, and will support the development of sound strategies for the conservation and sustainable management of the nation’s biodiverse forest heritage.
Acknowledgements
RT, GG and FA conceived the study. AF and RT performed the statistical analyses. CY, SS and MDS helped to draft the manuscript.
This study was supported by FAO Mountain Partnership Secretariat and the Italian Development Cooperation (DCGS).
References
Gscholar
Gscholar
Gscholar
Gscholar
Gscholar
CrossRef | Gscholar
Gscholar
Gscholar
Gscholar
Gscholar
Gscholar
Gscholar
Gscholar
Gscholar
Gscholar
Gscholar
Gscholar
Gscholar
Gscholar
Gscholar
Gscholar
Gscholar
Gscholar
Gscholar
Gscholar
Gscholar
Gscholar
Gscholar
Gscholar
Gscholar
Authors’ Info
Authors’ Affiliation
Giorgio Grussu
Food and Agriculture Organization of the United Nations, v.le delle Terme di Caracalla, I-00153, Roma (Italy)
Cossey Yosi
Papua New Guinea Forest Research Institute, P.O. Box 314, Lae 411, Morobe Province, Papua (New Guinea)
Department of Public Health and Infectious Diseases, “Sapienza” University of Rome, p.le Aldo Moro 5, I-00185 Roma (Italy)
Michele De Sanctis
Fabio Attorre
Department of Environmental Biology, “Sapienza” University of Rome, p.le Aldo Moro 5, I-00185 Roma (Italy)
Corresponding author
Paper Info
Citation
Testolin R, Saulei S, Farcomeni A, Grussu G, Yosi C, De Sanctis M, Attorre F (2016). Investigating the effect of selective logging on tree biodiversity and structure of the tropical forests of Papua New Guinea. iForest 9: 475-482. - doi: 10.3832/ifor1732-008
Academic Editor
Gianluca Piovesan
Paper history
Received: Jun 05, 2015
Accepted: Nov 01, 2015
First online: Jan 25, 2016
Publication Date: Jun 01, 2016
Publication Time: 2.83 months
Copyright Information
© SISEF - The Italian Society of Silviculture and Forest Ecology 2016
Open Access
This article is distributed under the terms of the Creative Commons Attribution-Non Commercial 4.0 International (https://creativecommons.org/licenses/by-nc/4.0/), which permits unrestricted use, distribution, and reproduction in any medium, provided you give appropriate credit to the original author(s) and the source, provide a link to the Creative Commons license, and indicate if changes were made.

Web Metrics
Breakdown by View Type
Article Usage
Total Article Views: 43437
(from publication date up to now)
Breakdown by View Type
HTML Page Views: 35153
Abstract Page Views: 3433
PDF Downloads: 3732
Citation/Reference Downloads: 29
XML Downloads: 1090
Web Metrics
Days since publication: 3007
Overall contacts: 43437
Avg. contacts per week: 101.12
Article Citations
Article citations are based on data periodically collected from the Clarivate Web of Science web site
(last update: Feb 2023)
Total number of cites (since 2016): 3
Average cites per year: 0.38
Publication Metrics
by Dimensions ©
Articles citing this article
List of the papers citing this article based on CrossRef Cited-by.
Related Contents
iForest Similar Articles
Technical Advances
Improved estimates of per-plot basal area from angle count inventories
vol. 7, pp. 178-185 (online: 17 February 2014)
Book Reviews
National forest inventories: contributions to forest biodiversity assessments (2010)
vol. 4, pp. 250-251 (online: 05 November 2011)
Research Articles
High resolution biomass mapping in tropical forests with LiDAR-derived Digital Models: Poás Volcano National Park (Costa Rica)
vol. 10, pp. 259-266 (online: 23 February 2017)
Review Papers
Remote sensing of selective logging in tropical forests: current state and future directions
vol. 13, pp. 286-300 (online: 10 July 2020)
Research Articles
Can traditional selective logging secure tree regeneration in cloud forest?
vol. 10, pp. 369-375 (online: 07 March 2017)
Research Articles
Comparing land use registry and sample based inventory to estimate forest area in Podlaskie, Poland
vol. 10, pp. 315-321 (online: 23 February 2017)
Research Articles
Assessment of hedge stand types as determinants of woody species richness in rural field margins
vol. 6, pp. 201-208 (online: 27 May 2013)
Research Articles
Approaches to classifying and restoring degraded tropical forests for the anticipated REDD+ climate change mitigation mechanism
vol. 4, pp. 1-6 (online: 27 January 2011)
Review Papers
Towards better practices of salvage logging for reducing the ecosystem impacts in Mediterranean burned forests
vol. 13, pp. 360-368 (online: 25 August 2020)
Research Articles
The conversion into high forest of Turkey oak coppice stands: methods, silviculture and perspectives
vol. 13, pp. 309-317 (online: 10 July 2020)
iForest Database Search
Google Scholar Search
Citing Articles
Search By Author
Search By Keywords
PubMed Search
Search By Author
Search By Keyword


