Tree species diversity of three Ghanaian reserves
iForest - Biogeosciences and Forestry, Volume 10, Issue 2, Pages 362-368 (2017)
doi: https://doi.org/10.3832/ifor2056-010
Published: Mar 07, 2017 - Copyright © 2017 SISEF
Research Articles
Abstract
Among tropical areas, Africa is considered to be poor in terms of biodiversity as compared with Amazon or South-East Asia, especially with respect to forest diversity. Despite this lower diversity, some African tropical zones, such as Ghana, harbour a plethora of species, particularly of trees. Unfortunately, as a result of anthropogenic impacts, biological diversity in West Africa dramatically decreased in the last decades, with very limited reference to evaluate the amount of the loss. Due to these growing pressure, a collection of relevant biodiversity information in this region seems to be urgent. We surveyed 127 temporary plots randomly distributed within 3 protected areas in Ghana and we collected data on tree (dbh>10 cm) species richness and their abundances. We also performed α, and β diversity analyses, and estimated the effective number of species, adopting various indices and approaches to provide further information on each assemblage. The main goals of this research were: (i) to provide a wide tree species database (abundance-based data), together with some biodiversity analyses; (ii) to estimate the sampling effort needed for next biodiversity surveys in the same and similar regions; and (iii) to calculate some indices useful to monitor the future of these protected areas both in terms of conservation and biodiversity research.
Keywords
Introduction
Biological diversity is critical for the maintenance of ecosystems ([22]) and each species plays a fundamental role ([27]). The presence of different species ensures ecosystem resilience and the ability to keep life conditions within tolerance levels around an oscillating equilibrium ([29]). The XXI century is experiencing a dramatic decline of global biological diversity, which is more evident in tropical regions ([8]), and it is mainly due to increasing anthropogenic impacts ([4], [9]).
Biodiversity assessments in some tropical areas are scarce and data are scanty, and this is due to different factors: (i) the plethora of species living in tropical forests and reef barriers ([16], [10]); (ii) the difficulties to reach and monitor some of the most remote places on Earth ([17]); and (iii) the high level of complexity of tropical ecosystems ([5]). Among tropical areas, Africa is one of the least studied regions, especially in terms of rainforest diversity ([34]). Moreover, different protocols for surveying biodiversity in different regions of the world have been adopted, making difficult to compare studies and datasets ([21]).
Timber extraction is the principal anthropogenic impact and the main cause of species extinction in terrestrial forest ecosystems ([24]), and even selective logging has been questioned for its negative effects on both animal and plant diversity ([19], [7], [41]). African tropical forests have been exploited and severely disturbed by anthropogenic activities for many centuries ([43]). In particular, West African forests were overexploited for timber exportation and agricultural development during the European colonization ([3]). The result is a fragmented landscape from Guinea to Nigeria, composed by patches of forest interspersed in a rural environment ([40]). Consequently, biological diversity dramatically decreased in the last few decades, with very limited reference to evaluate the amount of the loss ([18]). Due to the growing anthropogenic pressure in the West African region, it seems urgent to collect relevant biodiversity information. These data could be used as a baseline for future studies aimed at the analysis of environmental changes ([31]).
Tree diversity is often considered as a good proxy to estimate diversity of other taxonomic groups ([20]). Because tree diversity can be measured at different levels, in this research we evaluated three biodiversity components, in order to provide an exhaustive biodiversity information: (i) α diversity, as the mean species diversity of each study site; (ii) β diversity, as both the difference in diversity among sites and among plots at each site; and (iii) effective species number, as the overall species richness in each study site.
On a theoretical basis, at the spatial scale of a hectare or less, evolutionary-biogeographical influences and variation in physical factors are constrained to a minimum ([30]). For instance, one such set of interactions is described by the Janzen-Connell mechanism, which proposes that the probability of survival of a seed or the successful establishment of a seedling increases with distance from its parent tree. Seeds that fall relatively far from the parent increase survival, as they grow distant from predators, herbivores and/or pathogens which affect mother plants ([26], [15]). In micro-scale, Janzen-Connell’s idea could explain the high tree diversity observed within small plots in tropical areas, but further basic and detailed data on tropical tree diversity are needed to test this and other hypotheses.
The objectives of this study are: (i) to provide baseline information on tree diversity in the form of a wide database for the three protected areas surveyed in Ghana; (ii) to estimate the minimum sampling effort needed to collect the effective number of species in other comparative studies in the same or ecologically similar protected areas; (iii) to provide multiple biodiversity measures able to summarize these data.
In order to achieve these targets, we surveyed three protected areas in Ghana where we collected data at species level, performing α and β diversity analyses. We also estimated the effective number of species and the minimum sampling area, employing various indices and measures.
Materials and methods
Study sites
Bia Conservation Area (CA) is located in the Juabeso-Bia District in southwest Ghana, close to the border with Ivory Coast. This CA covers approximately 306 km2 (Fig. S1 in Supplementary material) and comprises Bia National Park (NP, 77 km2 in the northern part) and Bia Resource Reserve (RR, 228 km2 in the southern part). More than 300 plant species per hectare can be observed. Species beloging to Makore, Dahoma, Khaya and Marantis genera are widespread (see also Appendix 1 in Supplementary material).
Dadieso Forest Reserve (FR) lays in the north of Boin river FR and Disue FR (Fig. S1 in Supplementary material). The FR is included in the Aowin Suaman District Assembly jurisdiction. The area is 171 km2 and comprises 4.50 km2, along the border with Ivory Coast, in which farms are admitted. The vegetation is transitional between moist evergreen and wet evergreen types. Swamps are common throughout the forest and in some areas they cover hundreds of hectares. Some species are common in this forests reserve, such as Berlinia tomentella, Calpocalyx brevibracteatus and Strombosia glaucescens (see also Appendix 1).
In 1976 Nini Suhien National Park and Ankasa Game Reserve (now renamed Ankasa Conservation Area) were established: together they account for 513 km2 (Fig. S1 in Supplementary material). The vegetation of Ankasa is characterized by a wet evergreen forest, with high floristic and structural diversity and it is restricted to the highest rainfall zone in Ghana ([23]). The landscape is shaped by the presence of low, steep hills with an average elevation of 90 m; an extensive swampy area dominates the eastern portion. Species typical of this CA include Cynometra ananta, Lophira alata, and Heritiera utilis (see also Appendix 1 in Supplementary material).
Biodiversity data sampling
Field data were collected in the abovementioned study sites between 2011 and 2013 in the framework of different research projects, retaining for the present analysis only variables common to all the surveys and collected with same protocols. Identification of tree species was conducted with the help of the same botanists in all areas (Appendix 1).
Rectangular (20×25 m in Ankasa CA) or square (20×20 m in Bia NA and Dadieso FR) spatially separated plots were arranged in each study site with a random placement protocol ([32], [35]), within a circular area of 1 km of radius, established in the geometrical center of each reserve.
For all study sites we chosen a minimum common threshold of diameter at breast height (dbh) of 10 cm, as this encompassed the main diversity of the analysed tropical forest, and 5<dbh<10 cm did not add relevant information to the data ([7]). All trees with dbh>10 cm were identified at species level and their abundances were assessed (Tab. S1 in Supplementary material). Tab. 1 illustrates the number of field plots, the area sampled and the number of recorded trees. The identification of the species functional guilds was conducted following the classification developed by Hawthorne ([25]) who identified pioneer, non-pioneer light demanding (NPLD), shade tolerant, and swamp species.
Tab. 1 - Sampling effort and α diversity indices for the three study areas.
| Study site | Total no. of plots |
Area sampled (ha) |
No. of trees |
|---|---|---|---|
| Ankasa CA | 34 | 1.70 | 841 |
| Dadieso FR | 46 | 1.84 | 402 |
| Bia CA | 47 | 1.88 | 625 |
| Index | Ankasa CA | Bia CA | Dadieso FR |
| Number of Species (S) | 147 | 128 | 120 |
| Number of Individuals (N) | 841 | 625 | 402 |
| Margalef’s (Richness) | 21.68 | 19.73 | 19.85 |
| Relative dominance | 0.081 | 0.077 | 0.060 |
| Singletons | 54 | 51 | 48 |
| Doubletons | 22 | 18 | 22 |
| Uniques | 57 | 54 | 55 |
| Alpha-Fisher | 51.55 | 48.74 | 57.91 |
| Alpha-Fisher SD | 2.94 | 3.15 | 4.57 |
| ACE | 205.83 | 192.87 | 169.26 |
| Chao 1 | 213.19 | 200.13 | 172.23 |
| Shannon | 4.23 | 4.26 | 4.35 |
| Shannon Evenness | 0.85 | 0.88 | 0.91 |
| Simpson (1/D) | 39.15 | 44.68 | 51.47 |
| Simpson Evenness | 0.27 | 0.35 | 0.43 |
| Guild Pioneer % | 7.53 | 18.97 | 18.33 |
| Guild Shadow tolerant % | 21.23 | 35.34 | 35.83 |
| Guild NPLD % | 61.64 | 43.10 | 41.67 |
| Guild Swamp % | 6.85 | 2.59 | 2.50 |
| Not classified % | 2.74 | 0.00 | 1.67 |
Calculation and statistics
To perform α and β species diversity analyses we used the software package EstimateS ([13]). We computed a variety of biodiversity statistics, including rarefaction and accumulation curves, estimators of effective species number, diversity indices, and similarity measures. Standard error buffers and bootstraps techniques were employed when appropriate.
We produced species-area curves (SACs) as accumulation curves for comparison purposes, due to their wide use in botanical research; these curves allow comparison of sites and provide information on the minimum sampling efforts needed to capture the local diversity ([32]). SACs were calculated for each study site by plotting sampling area (A) increments (in terms of accumulating number of plots) against number of species sampled (S), with 100 randomization of sample units to obtain a smoothed curve. A log-log transformation of SACs was utilized to derive c and z parameters of the equation (eqn. 1):
or in log scale (eqn. 2):
We estimated the species-area saturation value for each area adopting the Chao1 and the Abundance-Coverage Estimator (ACE) indexes ([32]). These measures can provide an approximation of the expected tree diversity in each area, and can also be considered as a proxy of the effective number of species ([32]). SACs are sources of reliable information to adequately sample the assemblages ([21]).
We derived Coleman’s rarefaction curves to evaluate the number of species at the same abundances level, thus comparing the richness of three study areas characterized by different sampling efforts. We also plotted the frequency-distribution graph to analyse dominance/evenness patterns, and the rank-abundance (Whittaker’s) plot to evaluate the total richness, the abundances distribution, and to evidence differences in evenness among the assemblages. We tested the significance of the abundances distribution patterns by the Kolmogorov-Smirnov statistical test (here at 95% confidence level).
Together with the Whittaker’s plots we show the Empirical Cumulative Distribution Function (ECDF) graph, which allows a better discrimination of different assemblages obtained by rescaling the ranks according to the richness ([32]).
β-diversity analysis were performed computing the Marczewski-Steinhaus index to understand the dissimilarity between pairs of sites (i.e., β-diversity among sites). Because this measure considers only species presence and not species abundances data, it is not influenced by the dominance of certain species in the assemblage ([32]). Thus, we also computed the complement of Morisita-Horn abundance-based β-diversity measure (1-CMH) to understand which influence the abundance of species can have on similarity. β-diversity was also calculated among plots of each study site (β-diversity within site) to evaluate “internal” small-scale diversity patterns.
The effective number of species was estimated at study area level by the Chao1 index and the Abundance-Coverage Estimator (ACE - [32]).
Results
Richness, α diversity and guild composition
The list of species and their abundances in each study site are reported in Tab. S1 (Supplementary material). The results illustrated in Tab. 1 indicates that Bia and Dadieso are very similar in α-diversity and guilds’ percentage composition, while Ankasa differs from both. Although the sampling effort in Ankasa was the smallest, species richness (147) of this CA was higher by 19 and 27 species, respectively, than Bia and Dadieso. Margalef, ACE and Chao1 indices of Ankasa were also the highest.
The number of singletons recorded in Ankasa was also greater than the other two areas, with 54 singletons out of 147 species sampled in this area. The guilds percentages analysis shows that Ankasa was the only site characterized by a dominant guild reaching 60%, with almost 20% of shadow tolerant species and a low amount (<10%) of pioneer species. Bia and Dadieso, instead, had a lower percentage (≈ 40%) of dominant species and a similar level of shadow tolerant species, while pioneers ranged between 15-20%. The swamp guild was more represented in Ankasa (≈ 7%) than in the other two sites (2.50% and 2.59% in Dadieso and Bia, respectively).
Accumulation and rarefaction curves, and abundance-frequency distribution
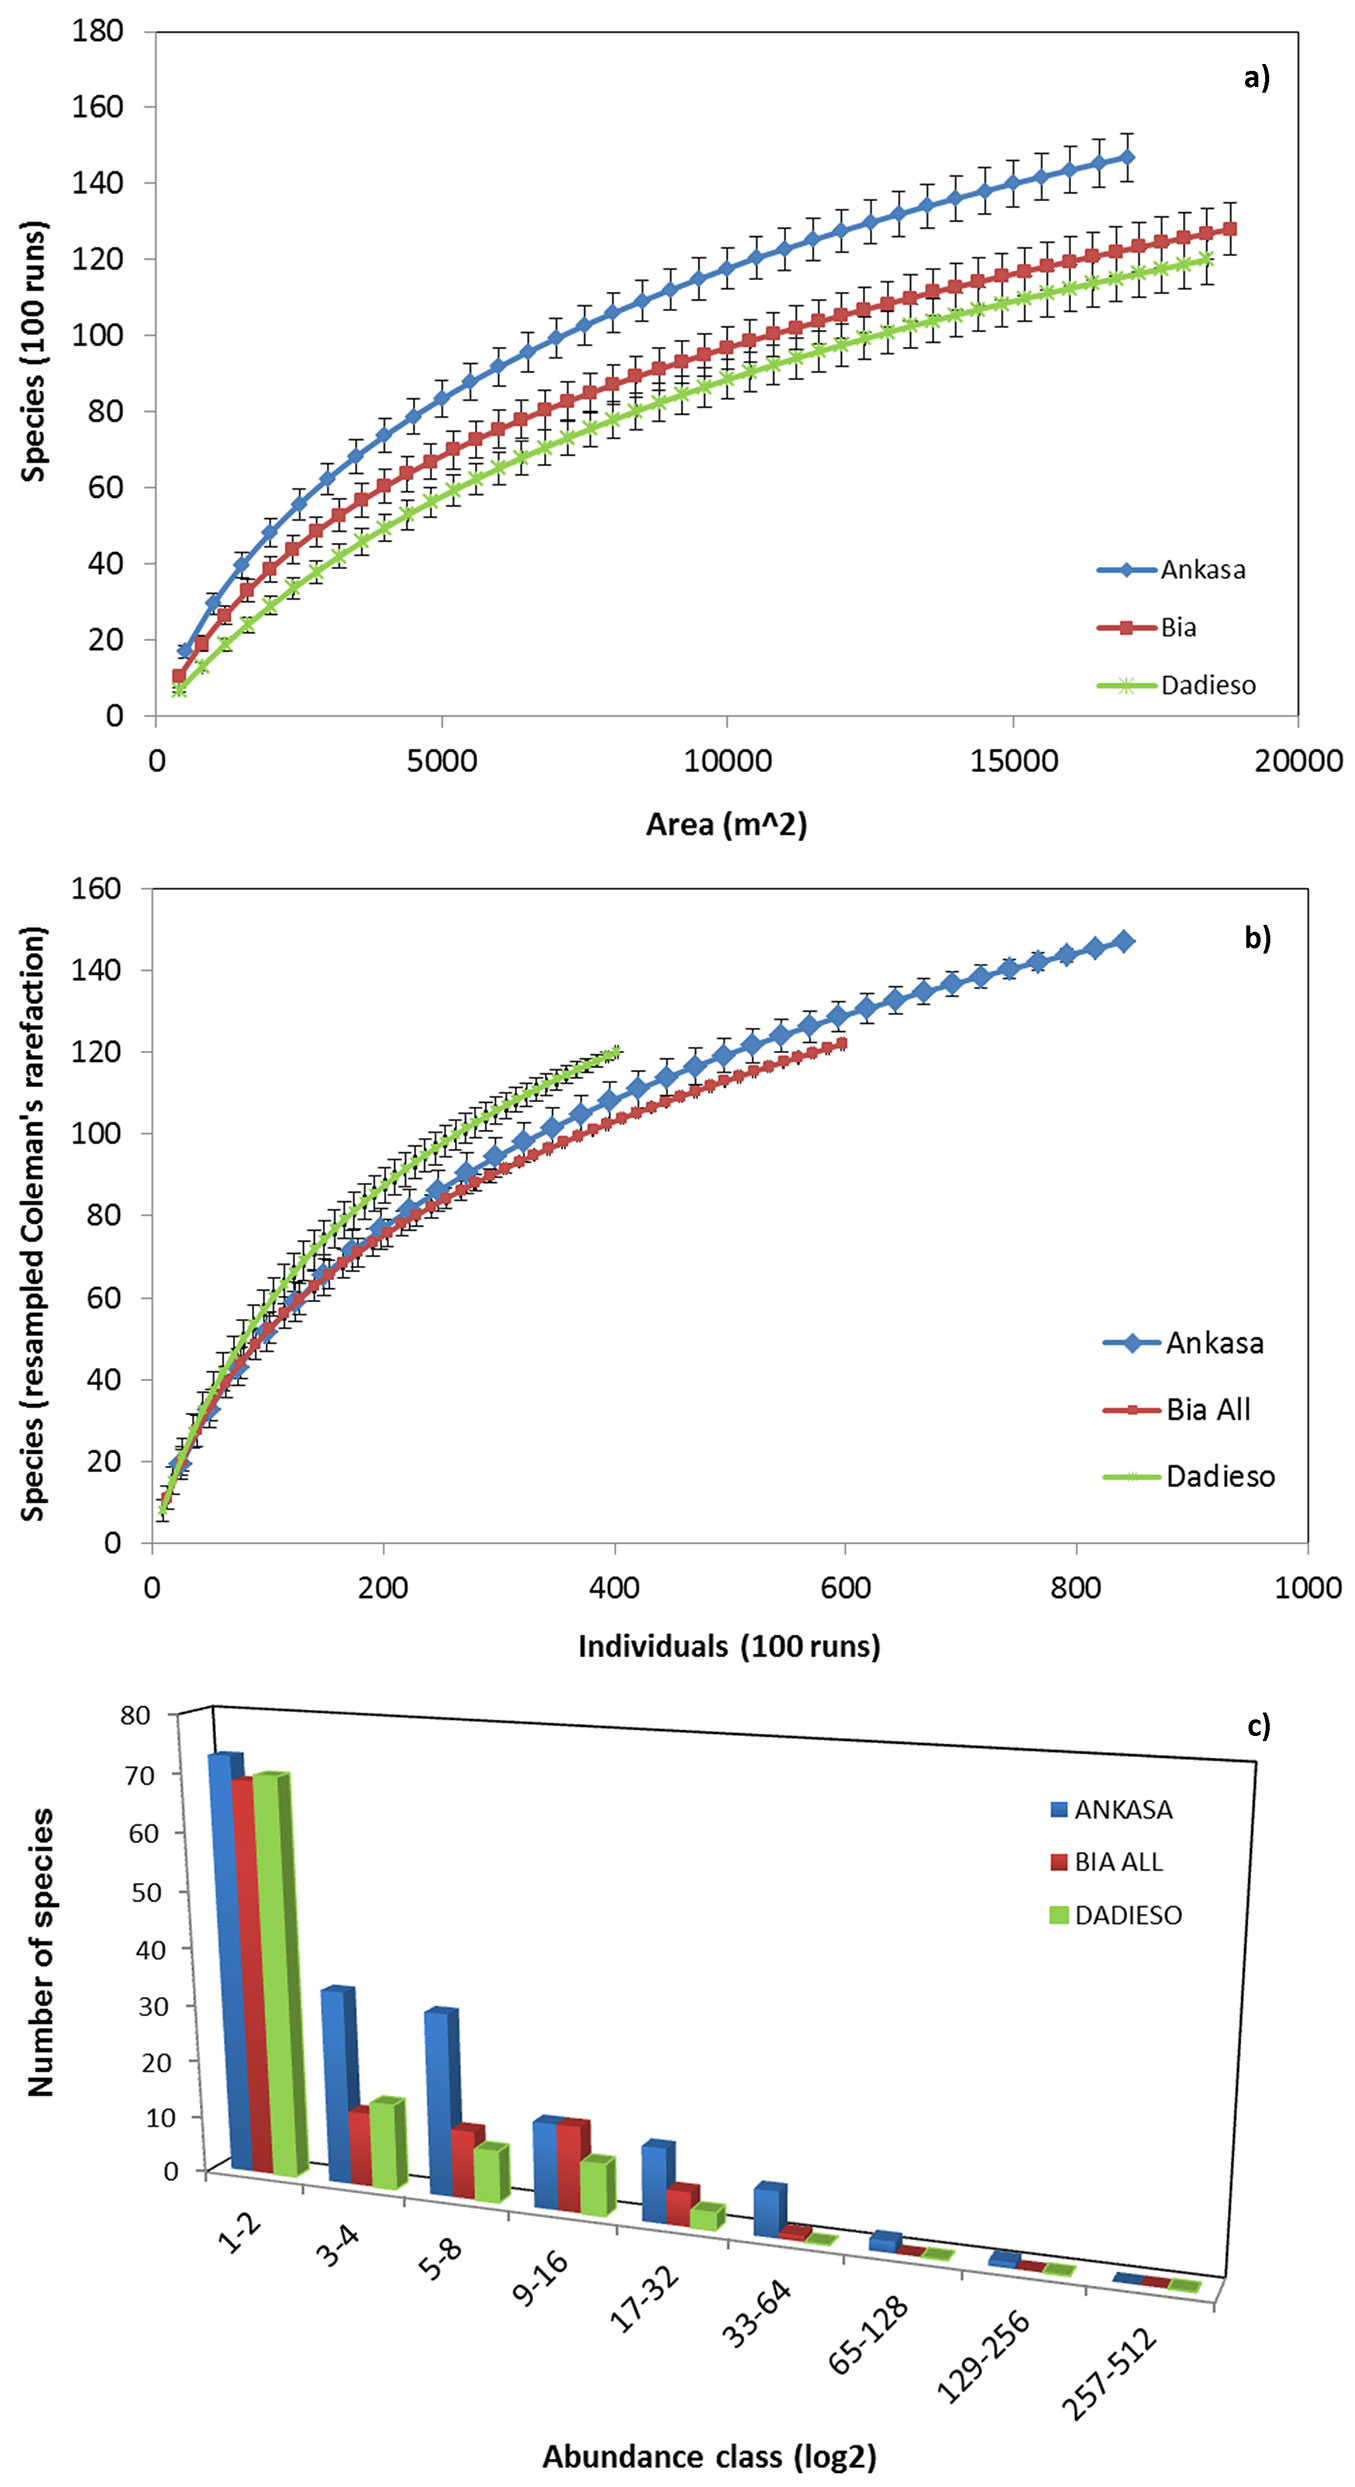
Ankasa showed the upper SAC curve, even considering the standard deviation buffers (Fig. 1a). The minimum sampling area needed to achieve a representative collection of species at each site is presented in Tab. 2. This estimation indicates minimum values of about 3 ha in each of the three sites.
Fig. 1 - Species-area curves (a), Coleman’s rarefaction curves (b) and frequency-abundance distributions (c) for the three study areas. Error bars represent the standard deviation.
Tab. 2 - Minimum sampling area estimation.
| Study site | log c |
c
|
z
|
1/z(Rad z) |
Chao 1 | Area saturation Chao 1 (ha) |
ACE | Area saturation ACE (ha) |
|---|---|---|---|---|---|---|---|---|
| Ankasa CA | -0.225 | 0.595 | 0.57 | 1.754 | 213 | 3.02 | 206 | 2.84 |
| Dadieso FR | -0.895 | 0.127 | 0.71 | 1.408 | 195 | 3.07 | 188 | 2.92 |
| Bia CA | -0.374 | 0.422 | 0.59 | 1.694 | 200 | 3.43 | 193 | 3.22 |
Coleman’s rarefaction curves, obtained after rarefaction at the minimum sample size (equal to 384 individuals), indicated that Dadieso was the richest site, while Ankasa was intermediate and Bia was the poorest (Fig. 1b). The frequency-distribution plot (Fig. 1c) evidenced the differences among the study areas. Ankasa has well represented frequencies in 3-4, 5-8 and the following abundance classes, which slightly decline. Dadieso and Bia showed lower frequencies in classes other than 1-2 and zero frequency at abundance value higher than 33-64 individuals per species. Moreover, Bia showed a bimodal distribution that peaks at 1-2 and 9-16 classes of abundance.
Species-abundance curves, rank-abundance plots, and ECDF
Cumulative abundance of species was plotted against the species ranked according to their abundances (Fig. 2a). The x-axes level of the inflection point indicates the quota of dominant species.
Fig. 2 - Abundance-species curve (a), rank-abundance plots (b) and ECDF (c) for the three study are-sites. n/N is the relative abundance.
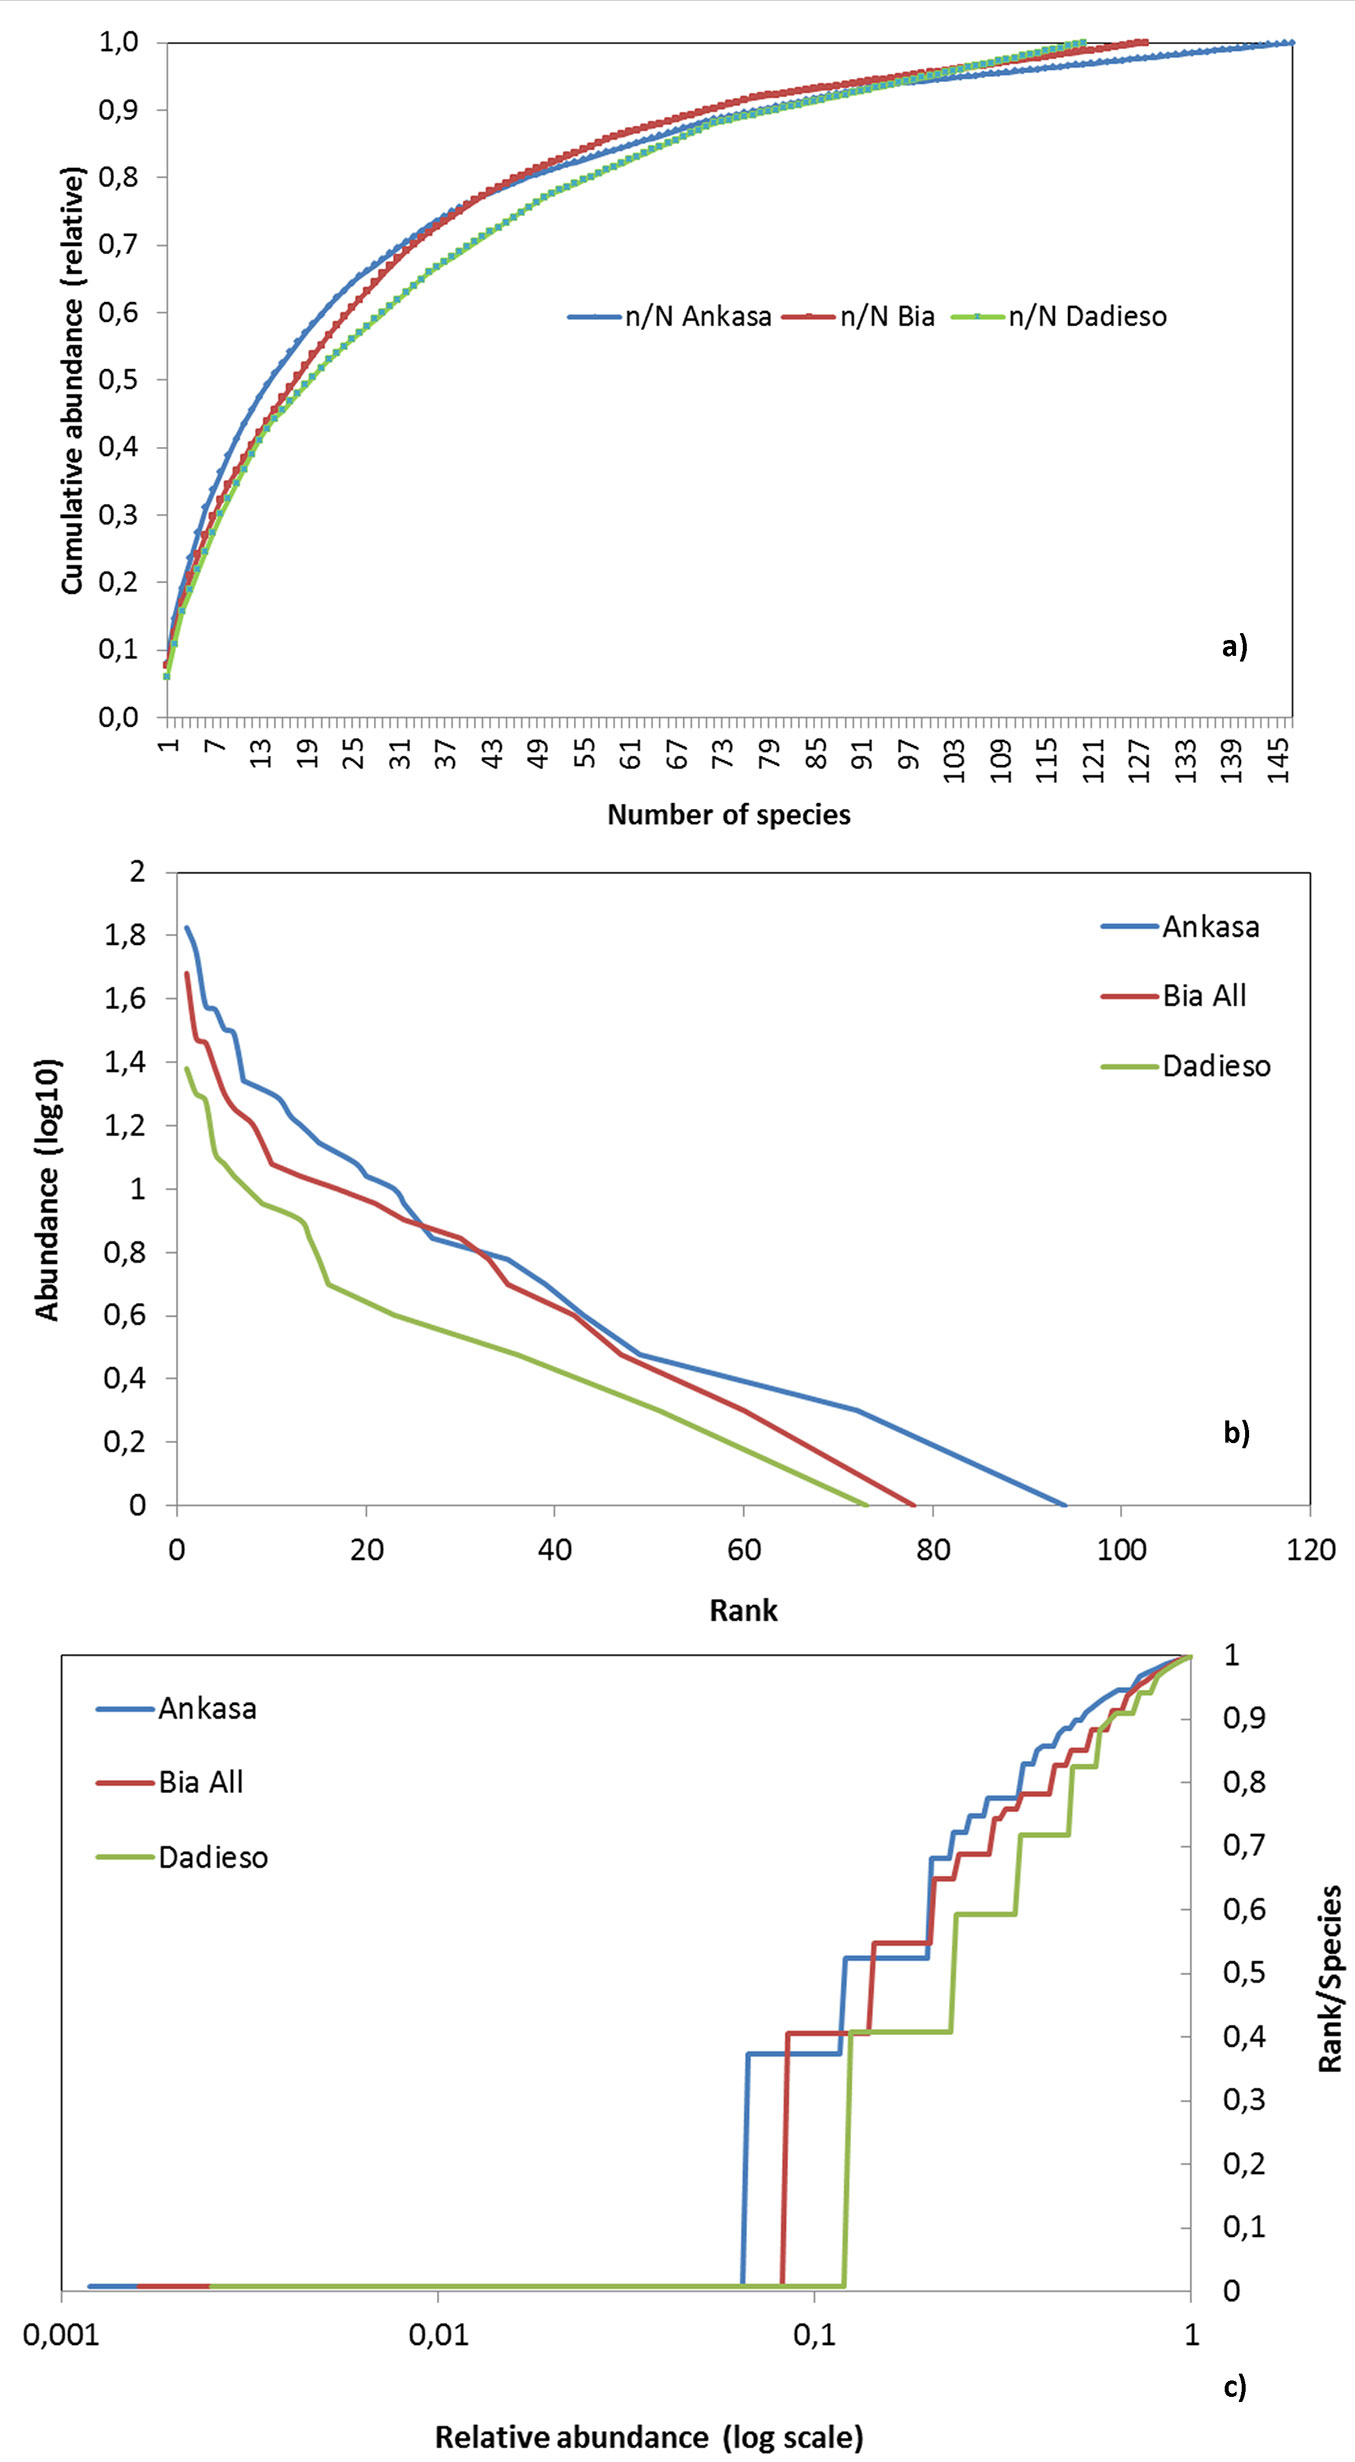
Fig. 2b shows the Whittaker’s plots of the study areas. Ankasa has a lightly steeper curve than Bia and Dadieso. Being the richness estimated from the x-axes point where the curves end, this diagram remarks the increasing richness from Dadieso, to Bia and then to Ankasa. The distributions of abundances were not significantly different (p>0.05) for any CA pair after two-samples Kolmogorov-Smirnov test (Dadieso-Ankasa D[120, 147] = 0.09; Ankasa-Bia D[147, 128] = 0.05; Bia-Dadieso D[128, 120] = 0.08).
The ECDF for the three areas is shown in Fig. 2c. Plotting the assemblages with this function, Ankasa curve was still higher than those of Bia and Dadieso. Ankasa curve was also steeper, which means that it is less even than the other two CAs. The lower left part of the curves show that Ankasa and Bia accounted for more rare species than Dadieso, which is upper positioned.
Effective number of species and diversity
The ACE and Chao1 indices (here considered as proxy of the effective number of species) were the highest for Ankasa, Bia values were intermediate and those of Dadieso the lowest (Tab. 1). The minimum sampling area estimates, which is based on those measures, showed a value of about 3 ha to collect the expected number of species for each of the study sites (Tab. 2).
Marczewski-Steinhaus and complement Morisita-Horn indices calculated among paired study areas shows that Bia-Ankasa pair was characterized by the highest β diversity, while Dadieso-Bia pair by the lowest, and Ankasa-Dadieso stands in the middle (Tab. 3a). The same indexes calculated within each area shows that the highest internal β diversity was found in Dadieso, while the lowest was in Ankasa, with intermediate values in Bia (Tab. 3b).
Tab. 3 - Among (a) and within (b) study areas β diversity. (SD): standard deviation.
| (a) | Marczewski-Steinhaus | Morisita-Horn (1-CMH) | ||
|---|---|---|---|---|
| Ankasa | Bia | Ankasa | Bia | |
| Dadieso | 0.77 | 0.59 | 0.81 | 0.51 |
| Ankasa | - | 0.79 | - | 0.87 |
| (b) | Mean ± SD | Mean ± SD | ||
| Ankasa | 0.86 ± 0.06 | 0.73 ± 0.16 | ||
| Bia | 0.91 ± 0.08 | 0.84 ± 0.16 | ||
| Dadieso | 0.95 ± 0.07 | 0.93 ± 0.12 | ||
Discussion
We provided tree diversity data for three protected areas in Ghana, including information on the abundances of species, in a region where field data are sometimes scarce and relatively difficult to collect. The evaluation of different indices and measures allowed to preliminary characterize part of the diversity of the areas, also providing indication on the minimum sampling effort needed to collect the effective number of species in these and similar forests, which could encompass and include the species missed by our pilot study.
Since only a portion of the reserves was considered, results cannot be extrapolated to the entire areas, but this study should be considered as a pilot report in order to provide background information for future research. Moreover, sample plots of different shape and size could have caused possible bias. For instance, Ankasa CA, with the largest and rectangular sample plots, was also the richest, and this may be at least partially due to different shape and size of the plots.
Most of the indices and graphs indicate that Ankasa is the richest site among those surveyed, although the sampled area is the smallest among sites. This confirms what was observed by Martin ([33]) that this Conservation Area has the highest tree richness level found in West Africa. While most of the tested indexes, measures and curves have higher values in Ankasa (e.g., Margalef, ACE, Chao1, rare species, N, S, SAC curve, ECDF), the Shannon and Simpson diversity measures for this area are, instead, the lowest among the three sites, and Alpha-Fisher shows an intermediate value. This result was expected as these diversity measures are strongly influenced by the abundances of dominant species: the presence of few dominant and many rare species produces a low evenness. This is also evidenced in Ankasa by the species-abundance curve. Coleman’s rarefaction curves show Ankasa in an intermediate position, between Dadieso and Bia. We argue that the random removal of almost half of the individuals through rarefaction procedure (from the 841 collected in Ankasa to the rarefaction value of 384.52) proportionally reduced the richness of uneven sites more than the richness of even ones. As documented in other tropical and complex ecosystems ([39], [7]), richness measures do not always match the diversity indexes, and it is advisable to carefully consider both richness and diversity measures. The occurrence of swamps in Ankasa creates a diversification of this ecosystem, with a consequent addiction of species in the related guild, which also contributes to the high richness of this site. Moreover, the total number of species we collected in Ankasa is higher than those recorded by other studies in the same area ([2]).
A major difference among the study sites is the presence of pioneer species. Even if untouched forest can also harbour some of them, pioneers are considered as an indicator of disturbance and degradation ([28]). Ankasa showed a much lower percentage of pioneers than Bia and Dadieso and this is a confirmation of the low disturbance occurred in this area, which also allowed the development of such a rich site. An additional evidence of the low disturbance in Ankasa results from the comparison of the abundance-frequency distributions and Whittaker’s plots of the three study areas.
Nevertheless, due to sampling limitations and the consequent lack of a full collection of very rare species, in each protected area the left side of abundances-frequency distributions is hidden ([38]).
The Kolmogorov-Smirnov test evidenced no significant difference in the distributions of the abundances of species among the three sites. It follows that, although different in vegetation type, logging history and climatic zone, the species composition of these protected areas can be easily compared in terms of their diversity. This could be the reason why we obtained the same minimum sampling area of about 3 hectares in every study areas. This value is much higher than what was previously adopted in other studies on tree diversity of the region ([2], [1]). We estimate that the mean effective number of species ([14]) that can be collected in a minimum sampling areas of 3 hectares in each site is about 200 (SChao1 ± SD = 202.67 ± 9.29; SACE ± SD = 195.67 ± 9.29). If considered together, a total of 250 species and 1868 individuals were recorded within the three protected areas (see Tab. S1 in Supplementary material for the plot-based abundance data).
We looked at SACs to locate the number of species per hectare we collected in our study sites, which is in the range of 88-118. Then we compared these values to some other tropical forest sites in the Amazon and in tropical Asia, where tree (dbh≥10 cm) species number per hectare reached values of 300 ([42]) and 200 ([36]), respectively.
As mentioned before, the results of this study are preliminary and should be considered with caution, as only a small portion of the sites have been sampled and our data could not be representative of the whole reserves. Nonetheless, we found that all the three protected areas we surveyed are richer than other other African tropical forests, where the number of tree species with dbh ≥ 10 cm per hectare was no more than 73 ([44]). A more recent study ([37]) analysed different tropical forests, reporting values of 86-92 tree species per hectare in Ghana and 56 in Uganda. This confirms that Bia and Dadieso forests are within the range of other Ghanaian forests as for species number, but still richer than other tropical African sites. Contrastingly, Ankasa is always well above the richness of all Ghanaian and most of African forests.
To better evaluate richness similarities and differences, in order to reduce the bias due to the area effect, we considered the number of species per 500 individuals reported in Phillips et al. ([37]) and compared it with our values derived from Coleman’s rarefaction curves. In the previous study 82-89 species/500 individuals were collected in Ghana, while applying rarefaction to the same number of individuals on our data we found 114-120 species/500 individuals in all the three sites. Unexpectedly, these values are in line with most of Amazonian sites (Costa Rica, Venezuela, Ecuador and Brazil, in particular) reported by Phillips et al. ([37]), with the only exception of Peru. South-east Asian forests show always higher numbers of tree species. This preliminary comparison suggests that the tree diversity of African forests might be reconsidered, as it could be comparable with that of some South American sites when individuals, instead of area, are taken into account. This underlines that tropical forest diversity is not always a matter of quantity (i.e., number of species in area units), but sometimes an issue of quality (i.e., how individuals distribute in space and among species - [6], [11]).
The within plots β-diversity of Dadieso is much higher than those of the other two forests. This means that this forest reserve has a great spatial diversity of species richness, which usually reflects the heterogeneity of the environment. Indeed, Dadieso is a transitional forest that preserves both moist evergreen and wet evergreen species, including species typical of swamps.
The highest β-diversity between sites was found for the Ankasa-Bia pair and this diversity evidences the climatic and ecological differences (wet vs. moist evergreen) between these forest types. Dadieso has intermediate values when paired with both Ankasa and Bia, reflecting the mixed vegetation type that characterizes this reserve.
In conclusion, the data and indices we provide could be useful to address next studies on these and similar sites, and can be considered as a reference in order to monitor the future of the surveyed protected areas.
Acknowledgments
We acknowledge the ERC grant Africa GHG #247349 for providing research funding. We are very grateful to the Ghana Forestry Commission staff, the botanist Mr Ntim Gyakari, Justice Mensah, and all the collaborators who supported the field activities in Ghana.
References
Gscholar
CrossRef | Gscholar
Online | Gscholar
Gscholar
Gscholar
Gscholar
Gscholar
CrossRef | Gscholar
CrossRef | Gscholar
CrossRef | Gscholar
Authors’ Info
Authors’ Affiliation
Biological Diversity and Ecology Laboratory, Bio-Clim-Land Centre of Excellence, Tomsk State University (TSU), 36 Lenin Prospekt, Tomsk, 634050 (Russia)
Riccardo Valentini
Impacts of Agriculture, Forests and Ecosystem Services Division, Euro-Mediterranean Center on Climate Change (IAFES-CMCC), v. Pacinotti 5, I-01100 Viterbo (Italy)
Riccardo Valentini
Department for Innovation in Biological, Agro-Food and Forest Systems (DIBAF), University of Tuscia, I-01100 Viterbo (Italy)
Corresponding author
Paper Info
Citation
Cazzolla Gatti R, Vaglio Laurin G, Valentini R (2017). Tree species diversity of three Ghanaian reserves. iForest 10: 362-368. - doi: 10.3832/ifor2056-010
Academic Editor
Marco Ferretti
Paper history
Received: Mar 14, 2016
Accepted: Jan 03, 2017
First online: Mar 07, 2017
Publication Date: Apr 30, 2017
Publication Time: 2.10 months
Copyright Information
© SISEF - The Italian Society of Silviculture and Forest Ecology 2017
Open Access
This article is distributed under the terms of the Creative Commons Attribution-Non Commercial 4.0 International (https://creativecommons.org/licenses/by-nc/4.0/), which permits unrestricted use, distribution, and reproduction in any medium, provided you give appropriate credit to the original author(s) and the source, provide a link to the Creative Commons license, and indicate if changes were made.

Web Metrics
Breakdown by View Type
Article Usage
Total Article Views: 54944
(from publication date up to now)
Breakdown by View Type
HTML Page Views: 44105
Abstract Page Views: 3818
PDF Downloads: 5606
Citation/Reference Downloads: 39
XML Downloads: 1376
Web Metrics
Days since publication: 3394
Overall contacts: 54944
Avg. contacts per week: 113.32
Article Citations
Article citations are based on data periodically collected from the Clarivate Web of Science web site
(last update: Mar 2025)
Total number of cites (since 2017): 10
Average cites per year: 1.11
Publication Metrics
by Dimensions ©
Articles citing this article
List of the papers citing this article based on CrossRef Cited-by.
Related Contents
iForest Similar Articles
Research Articles
Wildfire incidence in Spanish Natura 2000 sites is largely explained by forest land cover
vol. 19, pp. 195-200 (online: 04 June 2026)
Research Articles
Implications of ecotourism development in protected areas: a study from Rema-Kalenga Wildlife Sanctuary, Bangladesh
vol. 3, pp. 23-29 (online: 22 January 2010)
Review Papers
The forest biodiversity artery: towards forest management for saproxylic conservation
vol. 9, pp. 205-216 (online: 26 October 2015)
Review Papers
An overview of tree ecology and forest studies in the Northern Western Ghats of India
vol. 17, pp. 213-221 (online: 22 July 2024)
Research Articles
The effects of forest management on biodiversity in the Czech Republic: an overview of biologists’ opinions
vol. 15, pp. 187-196 (online: 19 May 2022)
Research Articles
Taxonomic distinctness of climbing plants and epiphytes in central-Chilean forests: an alternative diversity measure from unequal species lists
vol. 18, pp. 283-292 (online: 20 October 2025)
Research Articles
Early responses of biodiversity indicators to various thinning treatments in mountain beech forests
vol. 11, pp. 609-618 (online: 25 September 2018)
Research Articles
Geostatistical techniques for estimating aboveground biomass in eastern Amazonia
vol. 19, pp. 85-93 (online: 13 March 2026)
Technical Reports
Allometric biomass and carbon factors database
vol. 1, pp. 107-113 (online: 09 July 2008)
Technical Reports
A new database for time-series monitoring data: the NitroEurope approach
vol. 4, pp. 226-232 (online: 03 November 2011)
iForest Database Search
Search By Author
Search By Keyword
Google Scholar Search
Citing Articles
Search By Author
Search By Keywords
PubMed Search
Search By Author
Search By Keyword


