Leaf morphology of progenies in Q. suber, Q. ilex, and their hybrids using multivariate and geometric morphometric analysis
iForest - Biogeosciences and Forestry, Volume 11, Issue 1, Pages 90-98 (2018)
doi: https://doi.org/10.3832/ifor2577-010
Published: Jan 31, 2018 - Copyright © 2018 SISEF
Research Articles
Collection/Special Issue: INCOTW - Sassari, Italy (2017)
International Congress on Cork Oak Trees and Woodlands
Guest Editors: Piermaria Corona, Sandro Dettori
Abstract
The genus Quercus is known for the occurrence of frequent hybridization events between species. Although this phenomenon is not common among holm oak (Q. ilex) and cork oak (Q. suber), these species can hybridize when they coexist in mixed stands. The result of hybridization is a viable hybrid progeny with very heterogeneous leaf morphology. Literature concerning the leaf morphology of suber-ilex hybrid seedlings is scarce, and non-existent from a quantitative point of view. In the case of the leaf morphology of hybrids and their progeny, it has been observed a high frequency of leaves with fluctuating asymmetry or developmental abnormalities, which can have a marked effect on fitness. In this work, we have characterized seedlings’ leaf morphology corresponding to two- and four-year-old half-sib progenies of holm oak, cork oak and their hybrids. For this purpose, three to ten leaves of each individual were collected, and two methodologies were used for analysis. Firstly, we used a classic morphological analysis of twelve variables that were reduced using multivariate techniques. On the other hand, shape of the leaves was thoroughly analyzed by geometric morphometric analysis methods. The extent of fluctuating asymmetry and the presence of developmental abnormalities of seedlings were analyzed calculating an asymmetry index. The results indicate that thickness is the most discriminating trait between species, and that the hybrid progenies do not show a third different phenotype compared to the parental species. However, half-siblings tend to show similar leaf morphology between them, depending on the genetic adscription of the parents. While fluctuating asymmetry was found in half-sib progenies of the parental species and the hybrids, a significant proportion of hybrid half-sibs showed strong leaf asymmetry, probably due to modifications of the epigenetic systems that control leaf development at the shoot apical meristems and leaf primordia.
Keywords
Hybridization, Fluctuating Asymmetry, Leaf Morphology, Procrustes Analysis
Introduction
Quercus suber and Q. ilex are two Mediterranean oak species that are included into different subgeneric groups (Ilex and Cerris), and can be easily distinguished according to phenotypic traits of bark, cupules of the acorns, or leaves ([4]). However, when both species occur in sympatric populations in the siliceous or decarbonated areas from the Western Mediterranean, they hybridize, and individuals with intermediate or mixed phenotypes can be found in natural populations ([23]).
These hybrids are able to produce viable acorns when pollinated by Q. suber, or by Q. ilex ([25]). The seedling stage is crucial for plant population dynamics due to its higher vulnerability to environmental constraints in comparison with seed and adult stages ([17]). Provided the low hybrid frequency found at the adult stage in natural populations ([9]), the question arises whether hybrid seedlings have different phenotypes to those of the parental species; and, if so, whether those different phenotypes may involve a more reduced fitness of hybrid seedlings.
The detection of hybrids in the field could be masked by the way the phenotypic characters segregate in the the first generation of offspring (F1), and subsequent generations. The phenotypic analysis of F1 hybrids in 46 plant taxa showed 44.6 % of intermediate characters, while 45.2 % of the characters in hybrids were similar to either parental species, and 10.2 % presented transgressive characters ([44]). For the Q. ilex - Q. suber complex, a recent study has approached the molecular characterization of seedlings of Q. ilex, Q. suber, and Q. ilex × suber progenies grown in nursery conditions in three different years ([25]). The quantitative analysis of phenotypes on these progenies, specifically of leaf morphological traits, may shed light on the way these characters segregate in relation to the specific category of the seedlings previously estimated.
Leaf morphology plays an important role in species adaptations related to photosynthetic ability of plants: heat dissipation, light interception and hydraulic resistance, among others, and is crucial in early stages of seedling growth ([53]). The relationship of leaf morphological traits and the specific categories of hybrid oaks determined with molecular markers has been widely studied in natural populations ([22]). Leaf traits are extremely variable between and within populations, and even among branches within a tree ([8]). Moreover, significant ontogenetic ([20]) and seasonal ([6]) variation have also been reported. Therefore, in order to reduce bias and obtain sound results, leaf morphological approaches should be performed in controlled conditions on known pedigree individuals, or on controlled crosses or field trials ([16]). However, to our knowledge, the analysis of leaf morphology of hybrid seedlings of different age has not been addressed in the Q. ilex - Q. suber complex.
One of the undesired effects of hybridization on leaf morphology is the yielding of asymmetries in the lamina that may have an effect on seedling stability and fitness when they are of great magnitude ([35]). According to the intensity and causes of leaf distortions, two types of asymmetries have been described for oak leaves: (i) fluctuating asymmetry that consists of small random variations in the right and left sides of a bilateral trait that deviate from perfect symmetry ([15]), which is usually related to environmental variation in oaks ([19], [41], [50]), but also to genotypic variation ([3]); and (ii) strong asymmetries produced by cytonuclear inconsistence or (epi)genetic stress during leaf blade differentiation ([24]). Both types of asymmetry may increase with hybridization and introgression ([52], [3]).
Therefore, the specific aims of present study were: (i) to quantify developmental and fluctuating asymmetry in hybrid progenies; (ii) to characterize the leaf morphology of two and four year-old progenies from open pollinated Q. ilex × Q. suber mother trees; (iii) to identify the factors (cohort, species, family, genotype) accounting for variation in leaf morphological traits; and (iv) to inspect the correlation of morphological variables and previously inferred specific assignation of seedlings.
Material and methods
Experimental design
The sampling site is a mixed dehesa, i.e., a highly anthropised open woodland, located in Central Spain (39° 59′ N, 5° 7′ W). Four mature hybrids were identified according to their phenotypes. The hybrids occur in three areas of contrasting density and specific composition: (1) “La Isla” (Is), where Q. ilex and Q. suber mix at a density of 38 trees ha-1, being Q. suber slightly more abundant; (2) “La Laguna” (LG), a low density area (20 trees ha-1) dominated by Q. ilex, where two hybrids co-occur; and (3) ZL, which is a denser area of 123.5 trees ha-1 (38.3 trees ha-1 for Q. ilex and 85.2 trees ha-1 for Q. suber).
To obtain open pollinated, half-sib progenies, acorns were collected from the canopy of the four hybrids, in November 2012, and 2014. In addition, acorns were also collected from two Q. ilex, and four Q. suber individuals in 2012, and from two Q. ilex and two Q. suber individuals in 2014, respectively. The sampling scheme is detailed in Tab. 1. The full sampling scheme and the procedure to obtain half-sib families of seedlings is detailed in López De Heredia et al. ([25]).
Tab. 1 - Number of analyzed plants by cohort, species and family.
| Species | Family | Cohort | |
|---|---|---|---|
| 2012 | 2014 | ||
| Hybrids | LG1 | 21 | 38 |
| LG2 | - | 5 | |
| IS | 59 | 77 | |
| ZLR | 19 | 14 | |
| Total | 99 | 134 | |
| Q. ilex | I1 | 19 | 5 |
| I2 | 9 | 4 | |
| I3 | - | 4 | |
| I4 | - | 3 | |
| Total | 28 | 16 | |
| Q. suber | S1 | 8 | 2 |
| S2 | 11 | 4 | |
| S3 | - | 4 | |
| S4 | - | 4 | |
| Total | 19 | 14 | |
In January 2016, three to ten (mean = 5.4; s.d. = 2.86) fully-developed leaves were collected from the surviving 2012 (1361 leaves) and 2014 (1631 leaves) seedlings. Leaves were collected in alternate position along the entire stem. Leaves were dried in a plant press and scanned for further analysis, always visualizing the abaxial side of the leaf. The specific category of each seedling was assessed by the value of the qs parameter obtained with the Bayesian procedure implemented in the software Structure ([40]) for eight nuclear microsatellite genetic data as implemented in Burgarella et al. ([9]) ([25]).
Fluctuating and developmental leaf asymmetry
Fluctuating and developmental leaf asymmetry were investigated using semi-automated measures of the leaf surface in the right and left sides that were performed with the software ImageJ ([1]). Further, an asymmetry index was computed for each leaf as follows (eqn. 1):
where LS is the surface of the left side of the leaf lamina and RS is the surface of the right side of the leaf lamina. For LSAI < 0.05, leaves are symmetrical; for 0.05 < LSAI < 0.2, leaves show fluctuating asymmetry; and for LSAI > 0.2, leaves present strong asymmetries related to developmental anomalies.
The frequency of plants showing leaf fluctuating asymmetry was quantified by a fluctuating seedling asymmetry index defined as (eqn. 2):
where N′i is the number of leaves of seedling i with a LSAI value ranging between 0.05 and 0.2, and Ni is the measured number of leaves of seedling i.
The frequency of plants showing strong asymmetries related to development was quantified by a developmental seedling asymmetry index defined as (eqn. 3):
where N″i is the number of leaves of seedling i with a LSAI value higher than 0.2, and Ni is the measured number of leaves of seedling i.
Leaf morphological multivariate analysis
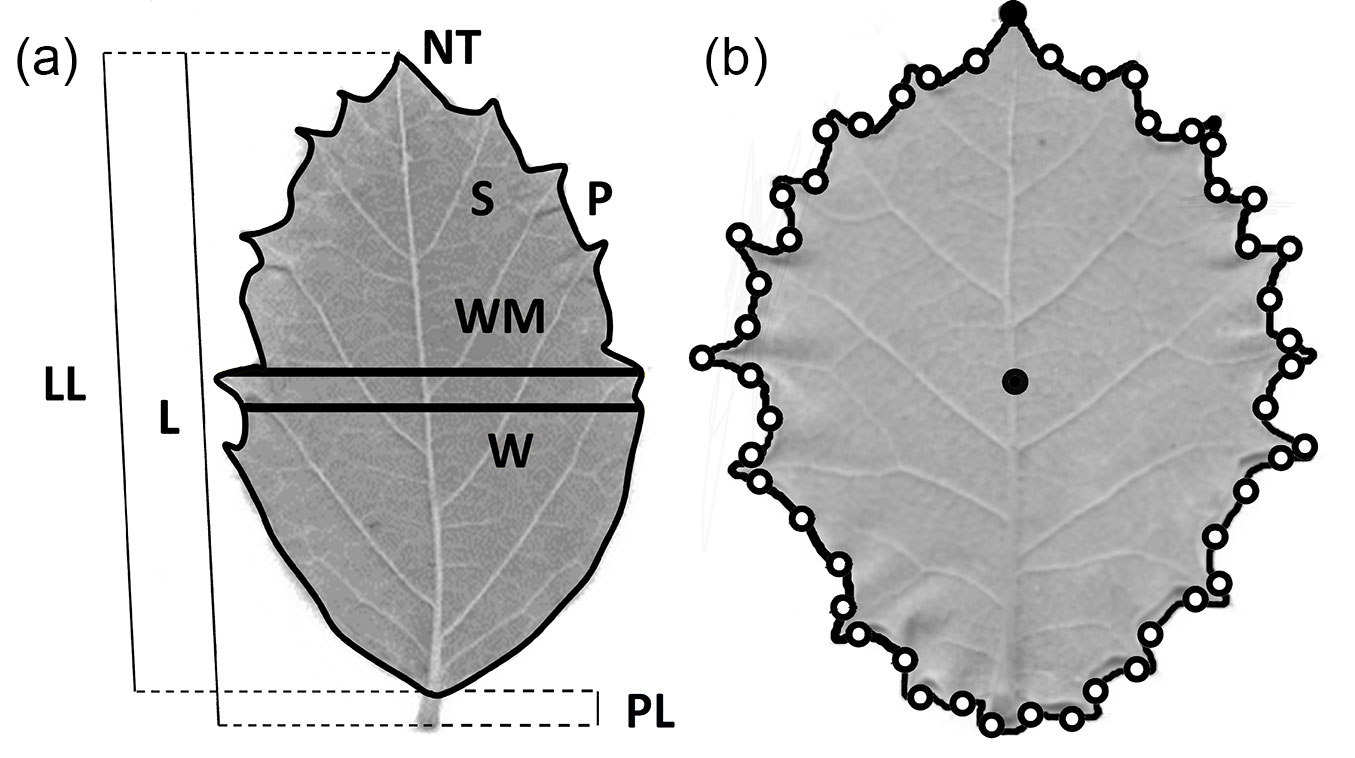
Twelve leaf morphological traits were measured for multivariate analysis. Dried leaves were weighed with a precision balance to estimate dry weight (DW). The thickness of the leaf lamina (T) was estimated as the mean value of four measurements at different points of the lamina. The number of teeth (NT) was manually counted and log-transformed to achieve normality. The remaining nine leaf traits were automatically obtained from scanned leaves with the image analysis system WinFolia™ (Regent Instruments Inc., Canada), and were the following (Fig. 1a): leaf lamina perimeter (P); leaf lamina surface (S); leaf total length (L); leaf width at 50 % of leaf total length (W); leaf lamina length (LL); leaf lamina maximum width (WM); petiole length (PL); ratio between the leaf lamina maximum width and the leaf lamina length (WM/LL); a shape coefficient (SH) estimated as 4∏S/P2. Measures on leaves that showed strong asymmetries, i.e., leaves with LSAI > 0.2 were discarded from further analyses.
Fig. 1 - (a) Leaf variables measured for multivariate analysis with the image analysis software WinFolia™. (b) Schematic position of leaf apex and centroid (full black dots), and landmarks (empty black dots) for morphometric geometric analysis of shape determined with the software LeafAnalyser.
Median, mean, maximum/minimum values and standard deviation were scored for each variable at family, species and cohort levels, respectively. A principal component analysis (PCA) was performed by scaling the original variables with the “princomp” command from the R 3.3.1 “stats” package ([43]). The two principal components (PCs) explaining most of the total variance were selected. New variables were created from the scores of the components, thus simplifying further analysis. The mean scores by individual of the first two principal components were bi-plotted to graphically inspect differences between species, and one-way ANOVAs were performed for this factor. Post-hoc comparisons were performed in order to determine the differences between levels of the specific factor. Tukey’s HSD (Honestly Significant Difference) test was performed with the “HSD.tsts” function from the “agricolae” library ([31]) of R package.
Leaf morphometric geometric analysis
Landmark-based morphometric geometric analysis provides a deeper insight on leaf shape variation than the analysis of the shape coefficient (4∏S/P2) and the ratio between the leaf lamina maximum width and the leaf lamina length (WM/LL) of the standard morphological multivariate analysis ([7]). The geometric morphometric analysis was conducted using the software LeafAnalyser ([51]) upon the scanned leaves. To obtain 2D landmarks as X-Y coordinates it is necessary to define two reference points in the leaf (Fig. 1b): (i) a centroid that was automatically computed by the software using the mean of all the X-Y coordinates of all pixels within the leaf margin; and (ii) the leaf apex, so the leaf is oriented. Forty-nine additional equidistant points were defined along the leaf margin, for which their respective X-Y coordinates were scored.
Once the X-Y coordinates were scored, we used the “gpagen” function from the “geomorph” library ([2]) in R 3.3.1 to perform Procrustes superimposition ([45]). Generalized Procrustes Analysis translates all landmark configurations to a common location, re-scaling all to unit centroid size, and rotating all into an optimal least-squares alignment with an iteratively estimated mean reference shape. These transformations minimize the differences in location between compared landmark data.
A Principal Component Analysis was performed with the “plotTangentSpace” function and the first two principal components were bi-plotted to visualize differences between groups. The “morphol.disparity” function was used to estimate the morphological disparity between cohort, species and families, respectively, as the Procrustes distance, and the significance of differences among groups was estimated through a p-value.
Mixed effects linear models and variance components estimations
Based upon the new variables (i.e., principal components scores) that mostly contributed to the overall variation for both morphological and morphometric geometric analysis, mixed effects linear model considering the cohort as a fixed effect and species (Q. suber, Q. ilex and hybrids), family and plant as nested factors as random effects were built with the “lme” function of the “nlme” library ([37]) of R package. The model was the following (eqn. 4):
where µ is the mean of the principal component, αi is the effect of cohort i, βj is the effect of species j, γk(j) is the effect of the family k within species j, δl(k(j)) is the effect of the plant l within family k within species j, and εijklm is the terms the error (E).
All the random factors showed a normal distribution as follows: βj: N(0; σS); γk(j): N(0; σS(F)); δl(k(j)): N(0; σS(F(P))); and εijklm: N(0; σE). The “varcomp” command was used to obtain estimators of the random terms of the model σ(S), σS(F), σS(F(P)), and σE for PC1 (size), PC2 (thickness) and PC1.shape (shape) using the restricted maximum likelihood method to identify the factors that contribute significantly to variation in the principal components of the model above.
Correlation of leaf morphology with genetic specific category parameters
Correlations between the mean principal component scores obtained for morphological and morphometric geometric analyses and the specific category of hybrid seedlings and inferred fathers, estimated as the q values obtained from Bayesian analysis from microsatellite data ([25]), were calculated with Pearson’s r coefficient using the “cor” function of R. Linear models were fitted for the principal component scores that showed high correlation values.
Results
Leaf fluctuating and developmental asymmetry
Fluctuating asymmetry was detected for a significant percentage of the seedling progenies, irrespective of the parental specific category. According to the results of the FSAIi parameter, evidence of fluctuating asymmetry was obtained for leaves of Q. suber, Q. ilex, and hybrid progenies in very similar proportions (Fig. S1a in Supplementary material). A closer examination of the distribution of fluctuating asymmetry for the hybrids progenies revealed that there were slight differences between seedlings of different cohorts depending on the family to which the plants belong (Fig. S1b, Fig. S1c, Fig. S1d). Actually, there were no significant differences between cohorts for the Is progeny (F = 0.65, p-value = 0.421), and only slight, yet significant, differences were scored for the LG1 (F = 5.95, p-value = 0.0179), and ZL (F = 8.17, p-value = 0.0075) families.
Strong asymmetries of diverse nature (Fig. S2 in Supplementary material) related to developmental anomalies were detected for 29.9 % of all seedlings. This type of asymmetry was almost an exclusive character of the hybrid progenies, with only a single Q. ilex individual showing leaf asymmetry (Fig. S3a). In this case, however, strong differences in the frequency of asymmetric leaves were scored between two and four year-old seedlings of the hybrid progenies, specially for IS (F = 42.34, p-value < 0.0001 - Fig. S3b), and to a less extent for ZL (F = 2.184, p-value = 0.145 - Fig. S3d) families. For LG family, although the boxplots suggest that there were differences between cohorts (Fig. S3c), these differences were not significant (F = 6.542, p-value = 0.0156). In all three cases, higher proportion of asymmetric leaves was detected for two than for four year-old seedlings.
Leaf morphological multivariate analysis
After removing asymmetric leaves related to developmental anomalies, the first three principal components explained 82.2 % of total variance. The variables that mostly contributed to the two first principal components were related to size (DW, dry weight; S, surface; P, perimeter; L, total length; W, leaf width at 50 % of leaf total length; LL, lamina length; and WM, leaf lamina maximum width) for PC1, and to leaf thickness (T) for PC2 (Tab. 2). The variables that mostly contributed to PC3 were related to leaf shape (WM_LL, ratio between the leaf lamina maximum width and the leaf lamina length - Tab. 2). However, PC3 only explained 8.3 % of the total variance, so it was not considered in further analysis. Indeed, variation in shape is better captured using morphometric geometric analysis than with the WM_LL variable (see below).
Tab. 2 - Contribution of the measured variables to the first three principal components. (*): variables that contributed most to each PC.
| Variable | PC1 | PC2 | PC3 |
|---|---|---|---|
| NT | -0.54505911 | 0.57133737 | 0.06719112 |
| DW | -0.94474033* | 0.02529156 | -0.0277579 |
| T | 0.00236017 | 0.83459101* | 0.05697182 |
| S | -0.95021391* | -0.2347433 | -0.04317772 |
| P | -0.96134823* | 0.12877999 | 0.05231506 |
| L | -0.9329851* | -0.23694868 | 0.09173586 |
| W | -0.964661* | -0.05444766 | -0.11786569 |
| LL | -0.93677664* | -0.23051776 | 0.08068672 |
| WM | -0.96422764* | -0.05474921 | -0.11193033 |
| PL | -0.58461261 | -0.06033392 | -0.02877686 |
| WM_LL | -0.0613093 | 0.22895923 | -0.95775912* |
| SH | 0.51759531 | -0.63655759 | -0.22501442 |
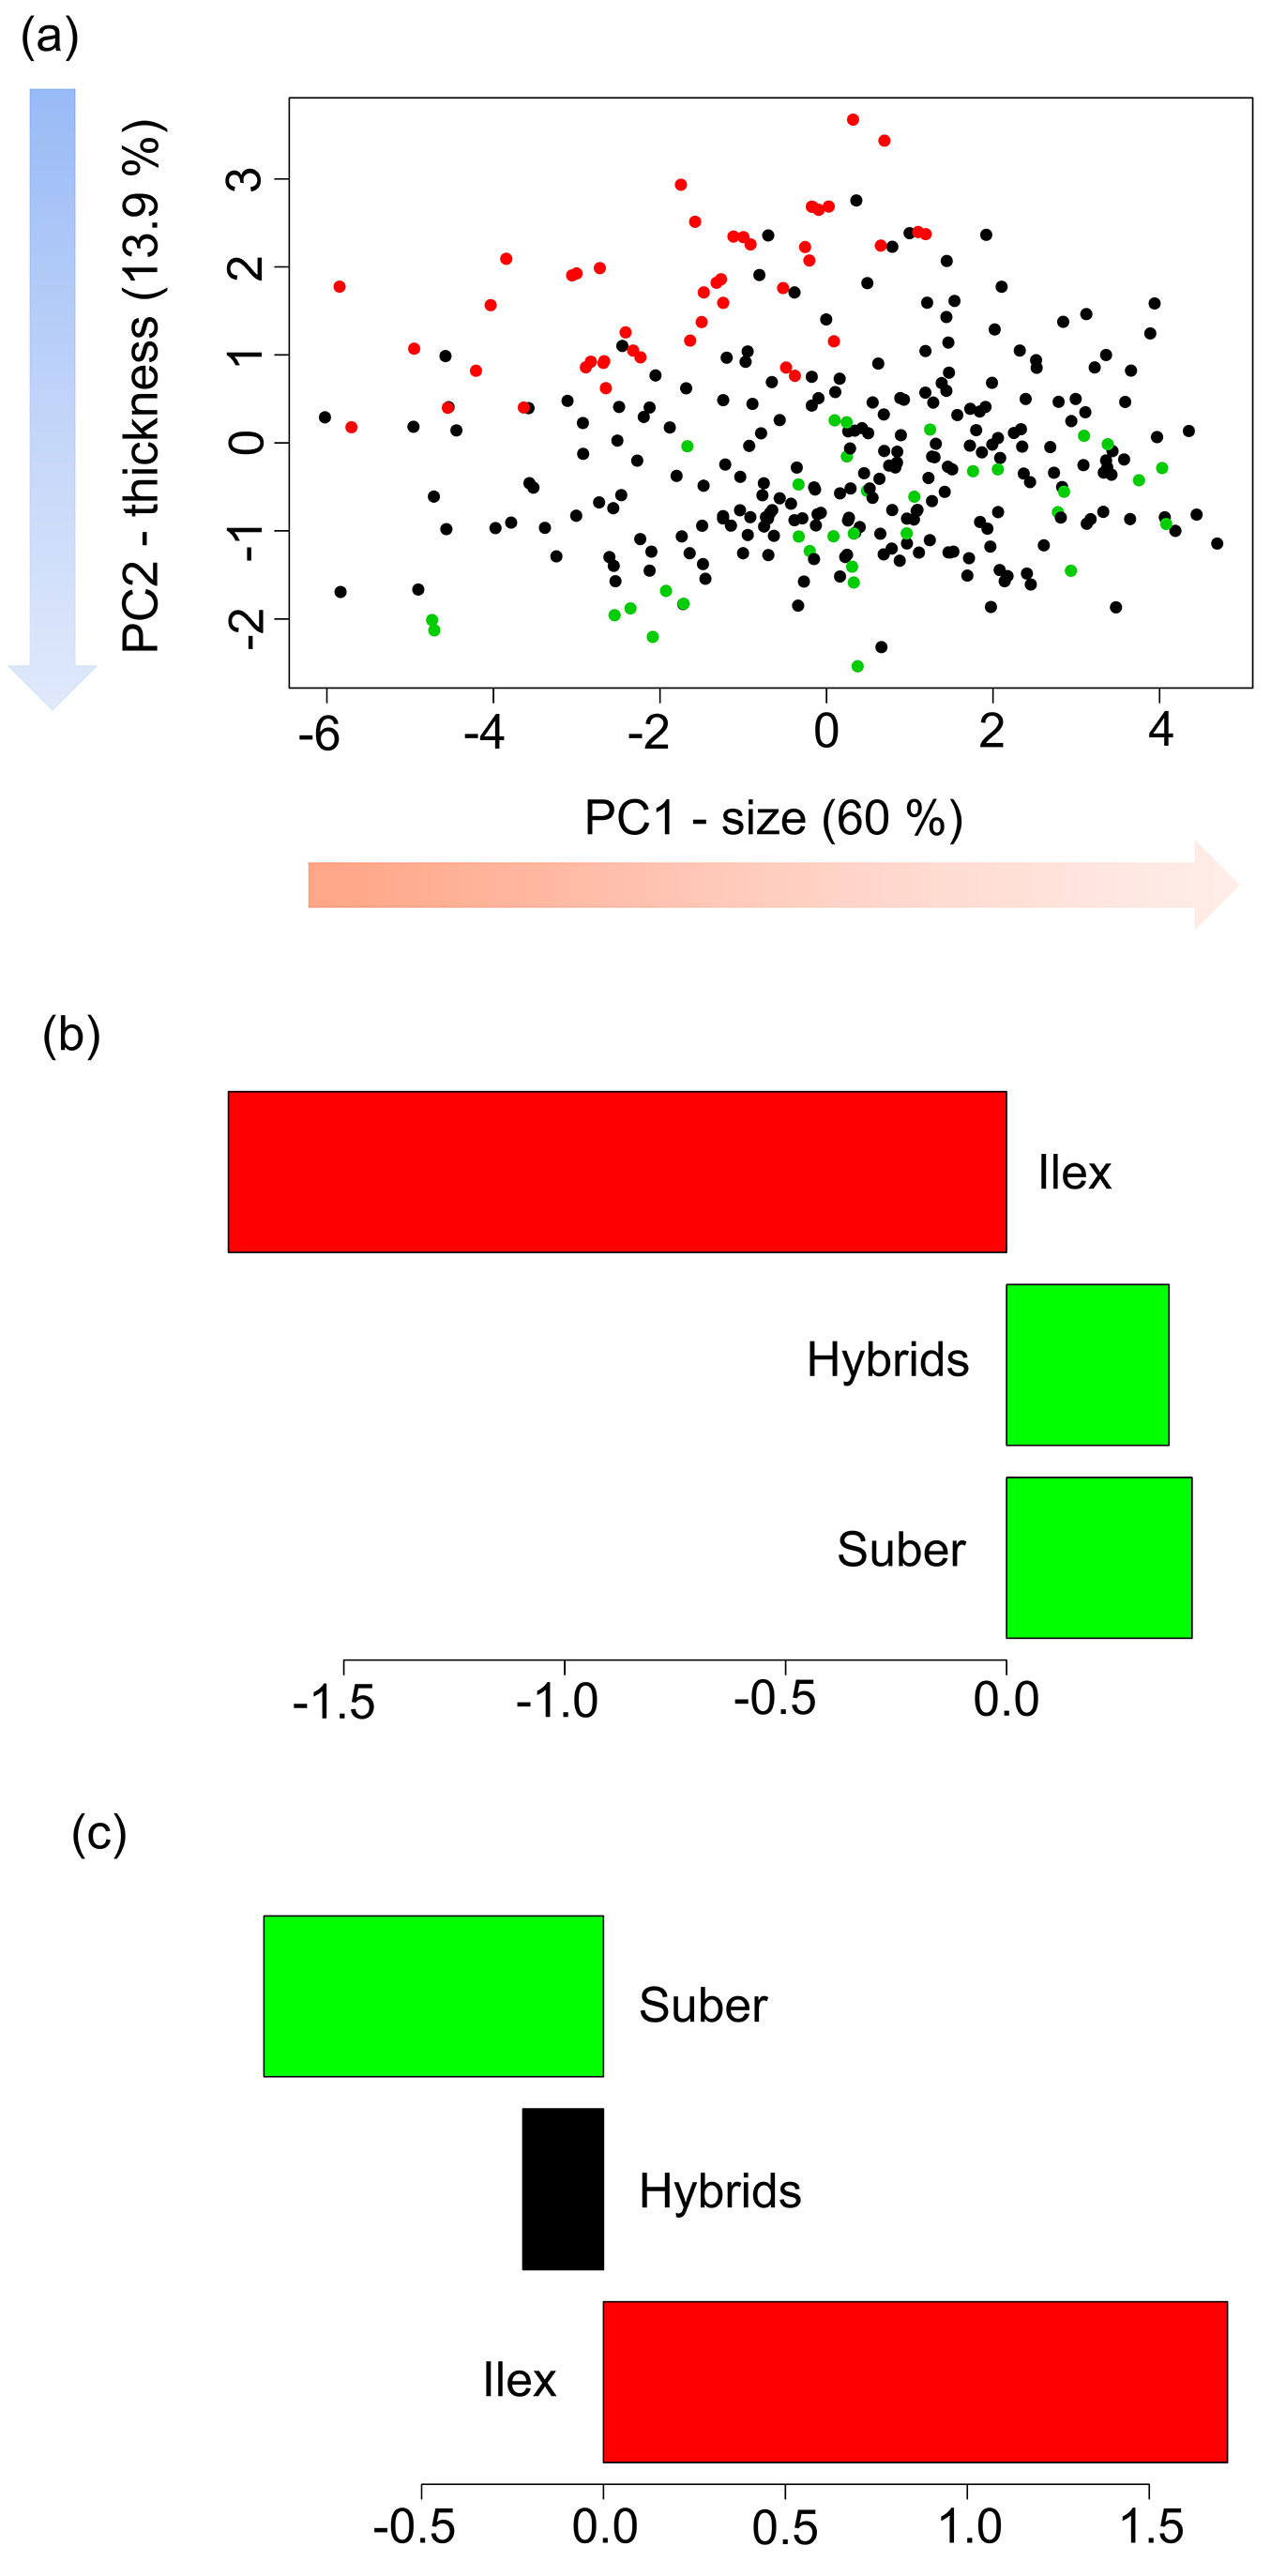
The biplot of the mean individual scores for PC1 and PC2 showed significant differences between Q. ilex and Q. suber progenies (Fig. 2a). For PC1, negative values indicate bigger leaves (Q. ilex), while positive values point to leaves of smaller size (Q. suber). While seedlings of hybrid families showed high variability in leaf size, there were non-significant differences among means with leaves of Q. suber seedlings, at the same time that both were significantly different than leaves of Q. ilex progenies, according to the HSD Tukey’s tests (Fig. 2b). For PC2, Q. ilex progenies showed positive values, and therefore thicker leaves, while Q. suber progenies presented negative values. Interestingly, for this character, hybrid progenies showed intermediate values that were significantly different from both Q. ilex and Q. suber progenies.
Fig. 2 - Biplot of the mean individual scores for the first two PCs for the morphological multivariate analysis, and Tukey’s HSD tests for (b) PC1 (size), and (c) PC2 (thickness). (Green): Q. suber; (red): Q. ilex; (black): hybrids. Groups with the same color in the bar diagrams do not show significant differences in their means.
Leaf morphometric geometric analysis
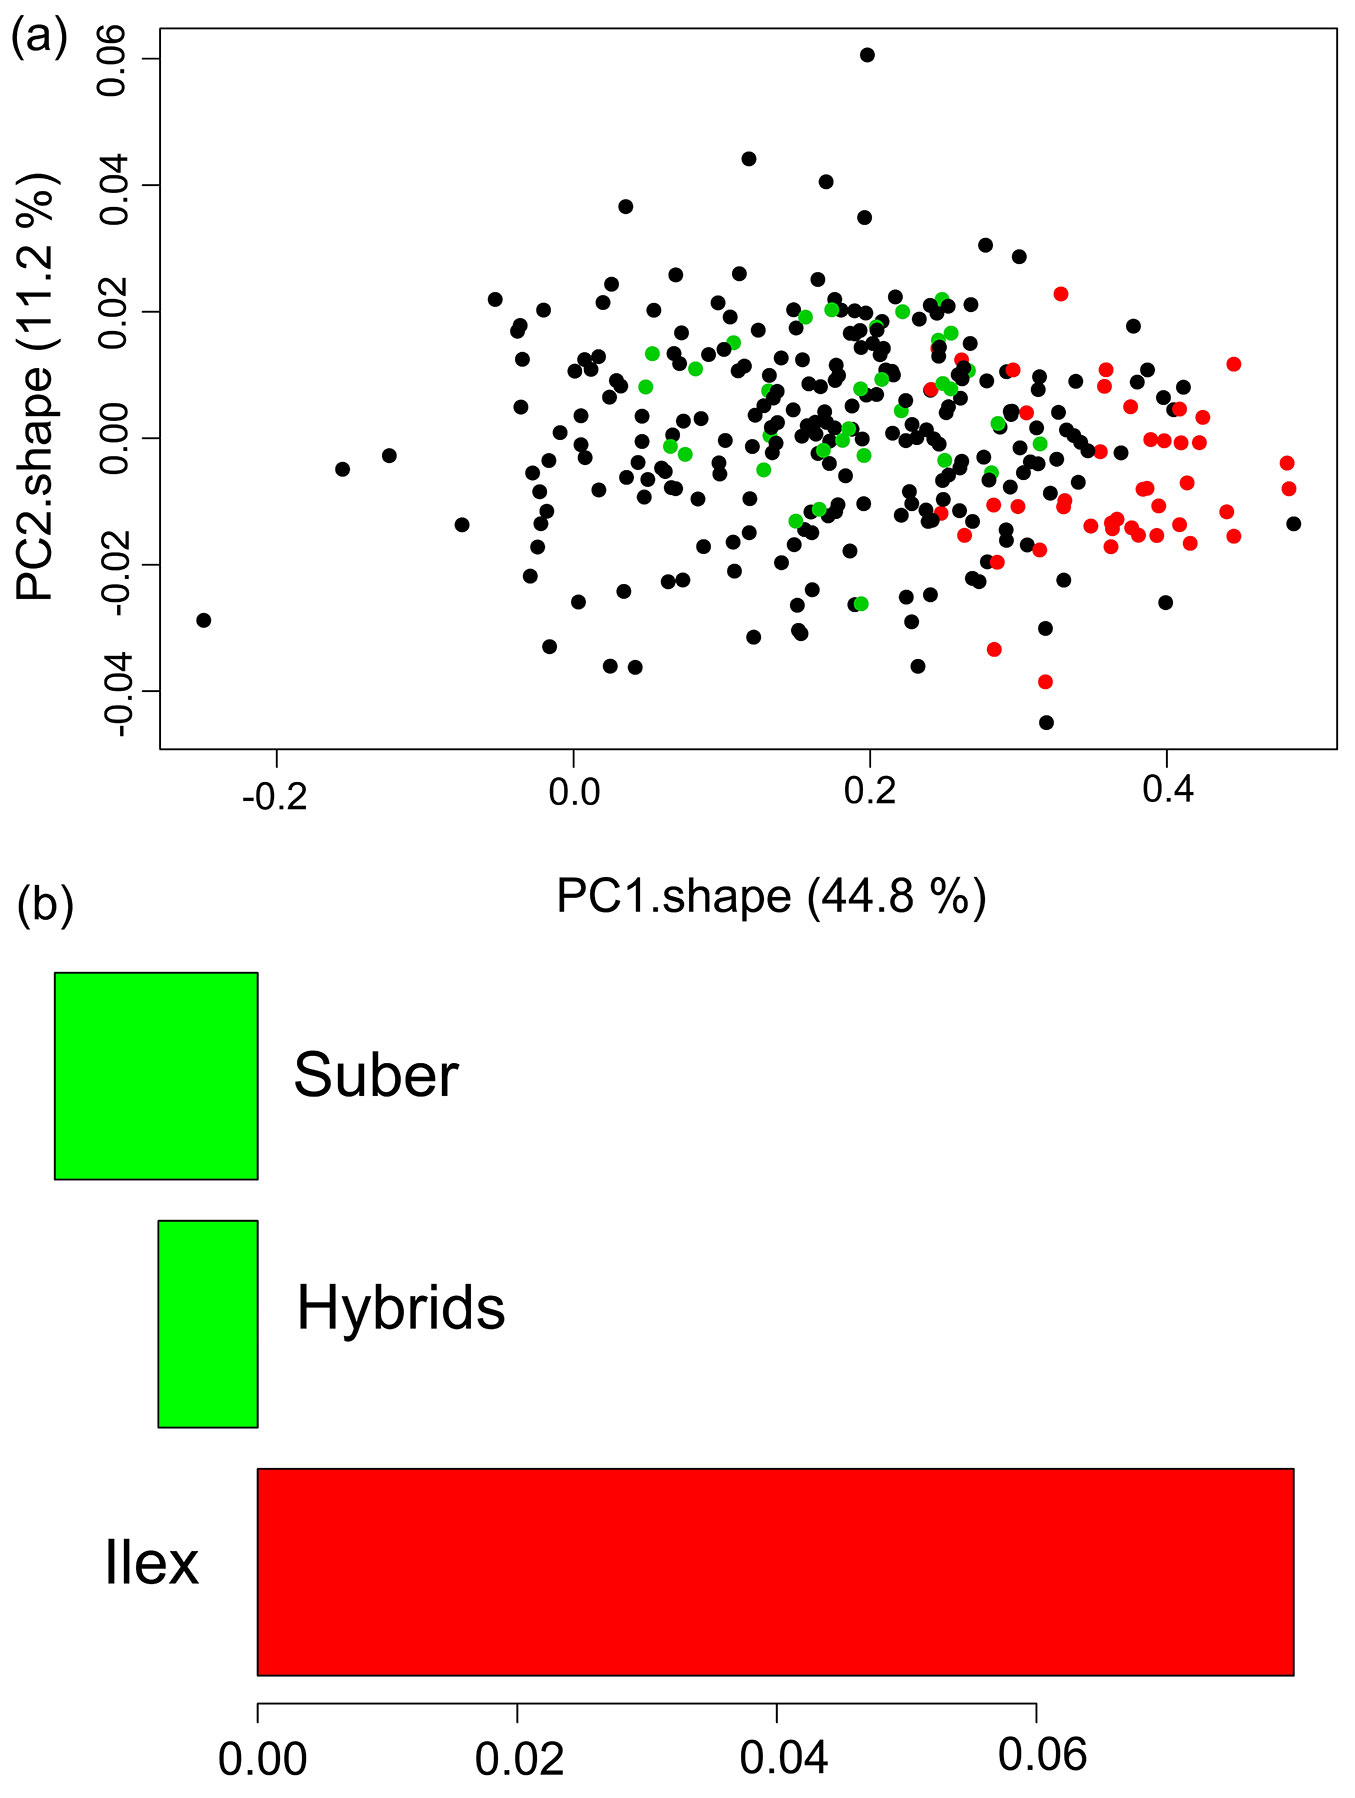
The principal component analysis of the landmark coordinates after Procrustes transformation showed that the two first components accounted for 56 % of overall variance. Actually, the first component (PC1.shape) explained 44.8 % of the overall variance. Although the mean scores for the three specific categories overlapped to some extent, the biplot of the mean individual scores for PC1.shape and PC2.shape, showed significant differences between the progenies of Q. ilex and Q. suber along the PC1.shape axis (Fig. 3). The hybrid families presented intermediate or similar values to Q. suber progenies for this component related to shape.
Fig. 3 - Biplot of the mean individual scores for the first two PCs for the morphometric geometric analysis, and Tukey’s HSD tests for PC1.shape. (Green): Q. suber; (red): Q. ilex; (black): hybrids. Groups with the same color in the bar diagrams do not show significant differences in their means.
Mixed effects linear models and variance components estimations
The fitted models showed significant differences between two and four year-old seedlings for the three principal components related to size, thickness, and shape of the leaves (Tab. 3). However, these differences were more evident for size and thickness (Fig. S4a in Supplementary material) than for shape (Fig. S4b). The random terms of the models, however, showed different impact of each factor depending on the morphological trait, as estimated from the variance components (Fig. S5). The term species (βj) explained high variance percentages for leaf thickness (51.1 %), and leaf shape (33.2 %), consistent with the results of the principal component analysis. For leaf size, however, less percentage of variance was found for species, while high variance percentages were scored due to variation within plants (εijklm, 37.8 %), and between plants within families within species (δl(k(j)), 38.2 %). Interestingly, the percentage of variance explained by the term family within species (γk(j)) was small for the three principal components.
Tab. 3 - ANOVA results for the fixed effects (cohort) of the linear mixed effects models (eqn. 4) fitted for the principal component scores related to leaf size (PC1), leaf thickness (PC2), and leaf shape (PC1.shape). (df): degrees of freedom; (SS): sum of squares; (MS): mean squares; (***): p< 0.001.
| Scores | Effect | df | SS | MS | F-value |
|---|---|---|---|---|---|
| PC1 (size) | αi (cohort) |
1 | 2210 | 2209.7 | 342.2*** |
| Residuals | 2819 | 18203 | 6.5 | - | |
| PC2 (thickness) | αi (cohort) |
1 | 1060 | 1059.6 | 817.3*** |
| Residuals | 2819 | 3655 | 1.3 | - | |
| PC1.shape | αi (cohort) |
1 | 0.43 | 0.4301 | 78.98*** |
| Residuals | 2755 | 15.00 | 0.0054 | - |
Correlation of leaf morphology with genetic specific category parameters
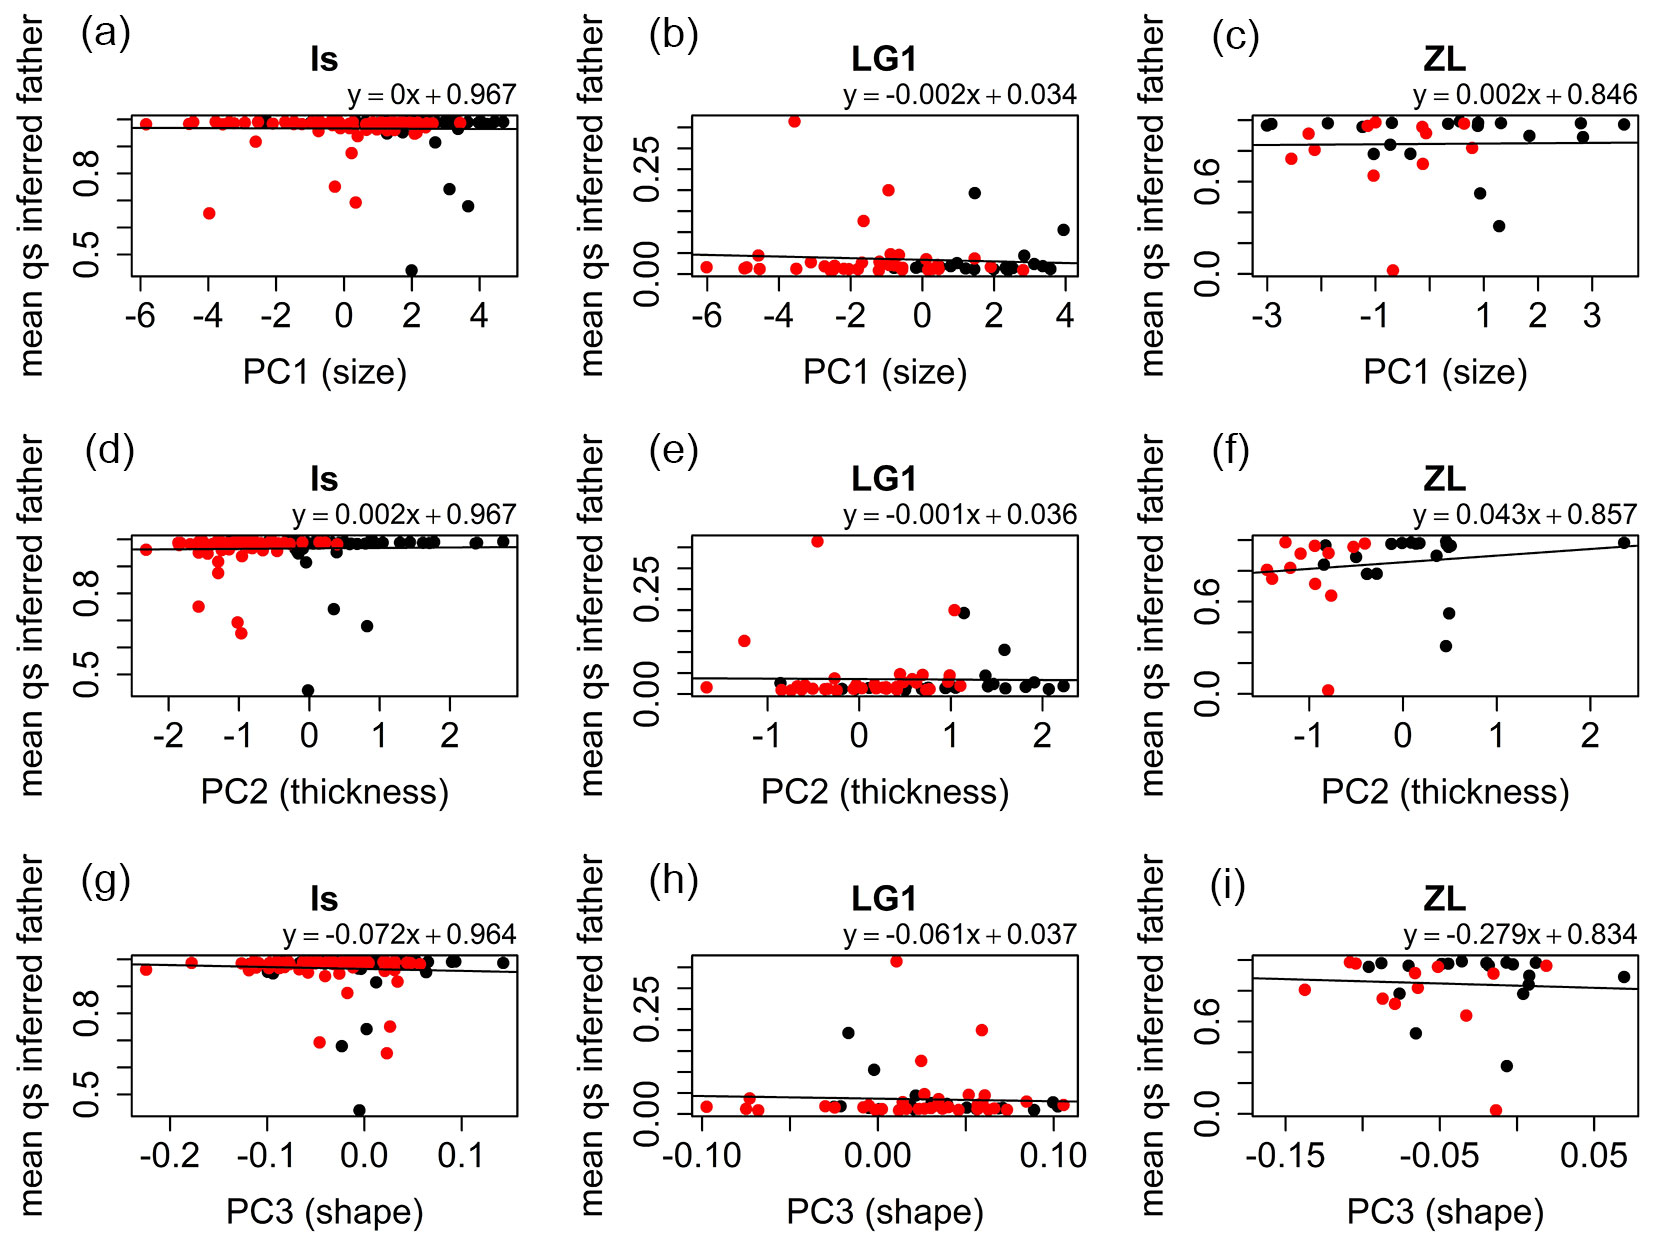
For the Is and LG1 families strong significant negative correlations were found between leaf thickness (PC2) and qs values of the seedlings estimated with Structure (Is: r = -0.67, p-value < 0.001; LG1: r = -0.71, p-value < 0.001 - Fig. 4d, Fig. 4e), and between leaf shape (PC1.shape) and qs values (Is: r = -0.51, p-value < 0.001; LG1: r = -0.36, p-value = 0.006 - Fig. 4g, Fig. 4h), respectively ([25]). For leaf size (PC1), correlations were non-significant for the Is (r = -0.03, p-value = 0.705 - Fig. 4a) and LG1 (r = -0.18, p-value = 0.163 - Fig. 4b) families. For the ZL family, significant positive correlation was found between these two variables (r = 0.42, p-value = 0.015 - Fig. 4c). However, only a small part of the ZL samples qs values below 0.5, and therefore, this correlation needs to be interpreted with caution. This circumstance produced also non-significant correlations for the ZL family between leaf thickness (r = -0.16, p-value = 0.371) and shape (r = -0.17, p-value = 0.334), and the specific category (Fig. 4f, Fig. 4i). Correlation of the morphological characters with the inferred qs values of the potential pollen donors was very low for all the half-sib families and cohorts (Fig. 5).
Fig. 4 - Linear models fitted for the qs parameter obtained for the seedlings vs. the mean individual values of PC1 (size), PC2 (thickness) and PC1.shape (shape) for Is, LG1, and ZL families. (Black dots): 2012 seedlings; (red dots): 2014 seedlings.
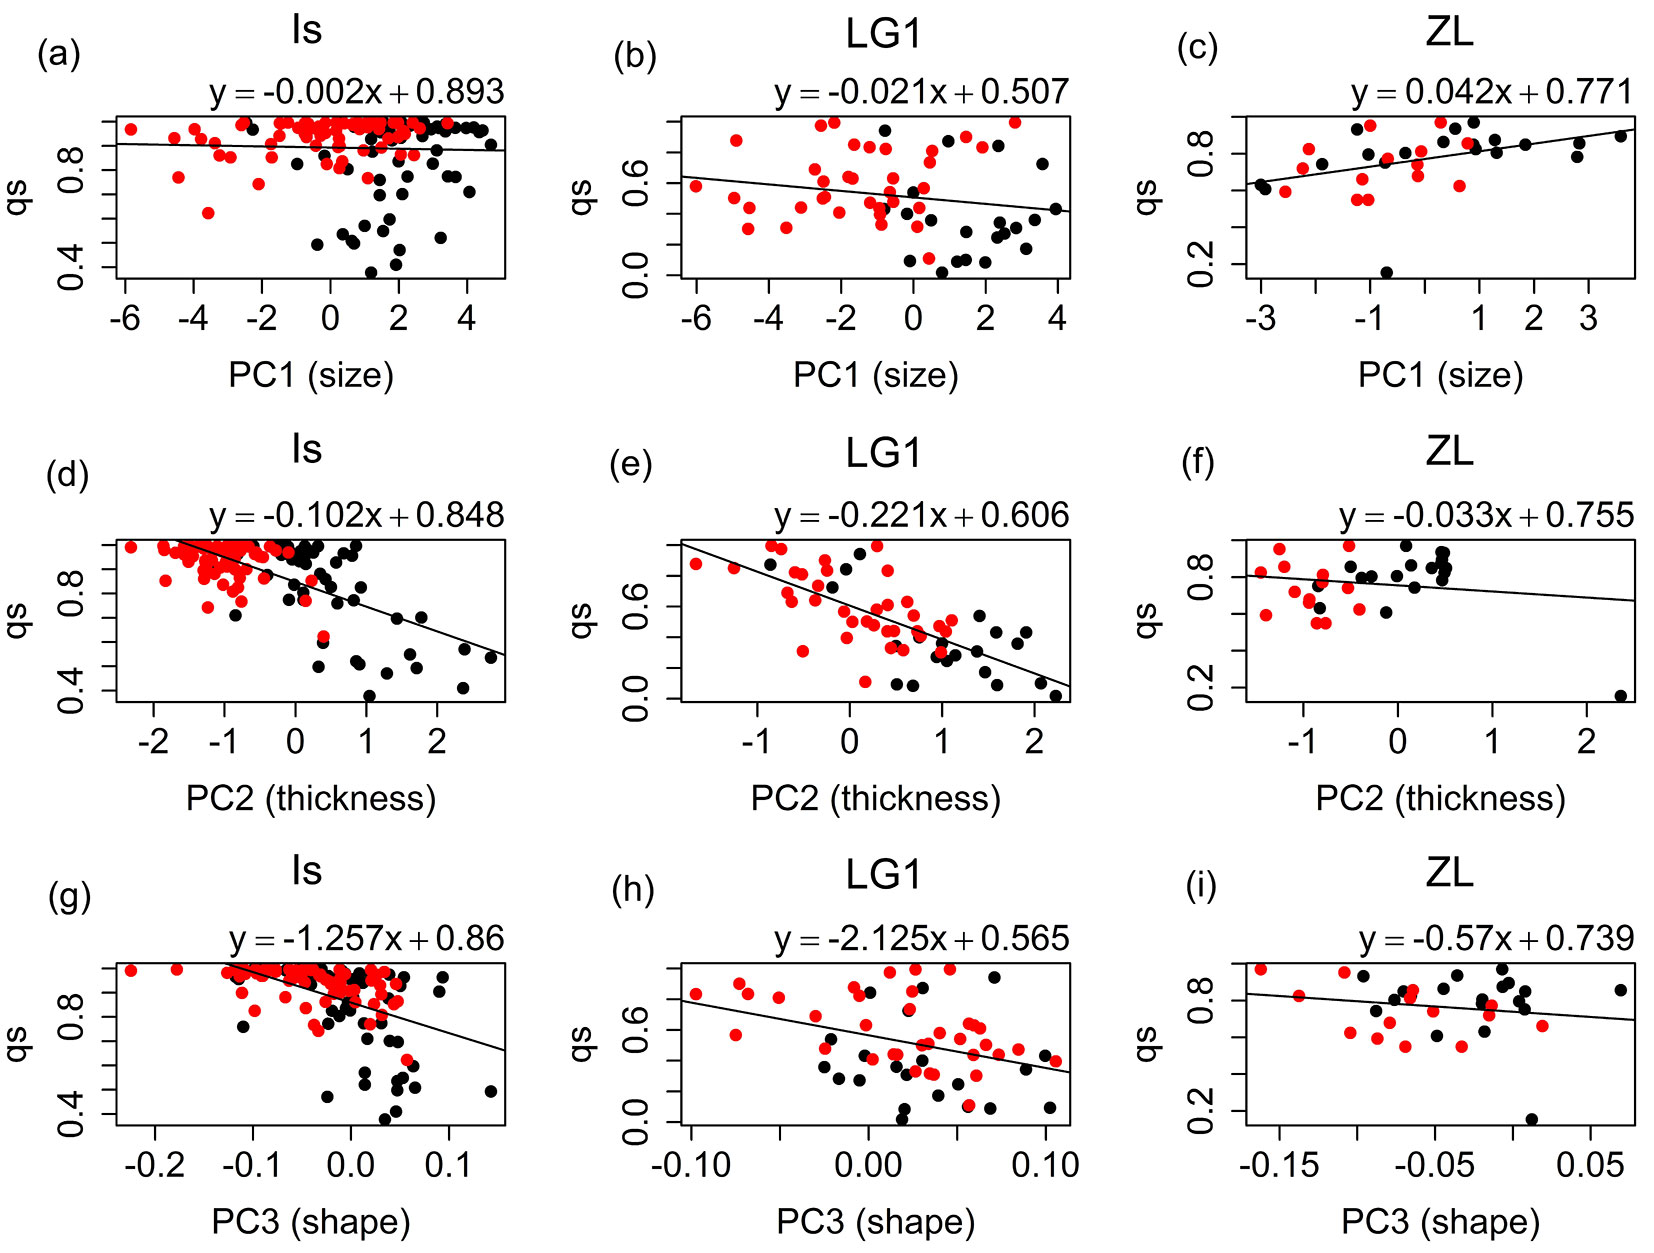
Fig. 5 - Linear models fitted for the qs parameter obtained for the inferred pollen donors of the seedlings vs. the mean individual values of PC1 (size), PC2 (thickness) and PC1.shape (shape) for Is, LG1, and ZL families. (Black dots): 2012 seedlings; (red dots): 2014 seedlings.
Discussion
Leaf fluctuating and developmental asymmetry
A high proportion of leaves with fluctuating and developmental asymmetries in seedlings was found in this study. However, the frequency of fluctuating and developmental asymmetry was variable between cohorts, species and families, supporting the hypothesis of factors of different nature operating on each type of asymmetry ([32]).
The proportion of seedlings with leaves showing fluctuating asymmetry was high for the hybrid progenies, but also for the pure species’ families. Determining the causes of fluctuating asymmetry for the seedlings of this study is not straightforward. Fluctuating asymmetry induction by changes in biotic and abiotic factors has been documented for oak species ([41], [50]). Therefore an effect of small-scale heterogeneity in nursery conditions, both in water stress or in light-shade conditions, cannot be completely discarded. Large morphological and physiological variation has been acknowledged for Q. ilex leaves in relation to ecotypic variation at broad scales associated with water availability ([34], [36]), and, specifically, fluctuating asymmetry in response to hydric stress was reported for Q. ilex ([19]). In addition, leaf structural plasticity in Q. ilex and Q. suber is a stronger determinant for leaf acclimation to incident photosynthetic photon flux density than biochemical and physiological plasticity ([54]); thus fluctuating asymmetry could be also generated by the structural adjustment of leaf structures during acclimation to changes in light intensity.
From studies in natural populations, it has been argued that the genotypic composition of the populations ([52]), and hybridization ([3]) may produce fluctuating asymmetry. However, no significant differences in the frequency of fluctuating asymmetry between Q. ilex, Q. suber, and hybrid seedlings were scored with the FSAIi index in the present study. While fluctuating asymmetry is more likely due to environmental stress than to hybridization, the strong asymmetric patterns found only for hybrid progenies are associated to anomalies produced during leaf development.
Actually, leaf asymmetries are not the exclusive anomalies observed in hybrid progenies. Seedlings that lack leaves, seedlings with multiple stems or strong ramification patterns, and dwarf seedlings without apparent apical growth are also frequent. These types of malformations in hybrids have been described for other angiosperms ([48]), and are related to genetic incompatibilities that modify the epigenetic system controlling the differentiation of the apical shoot meristem and the leaf primordia ([24]). Networks of genes coding for small RNAs and transcription factor-like proteins determine the polarity specification of flat bifacial leaves ([33]). Possibly, disruptions of regulatory networks due to interspecific genomic incompatibilities are responsible for producing abnormal phenotypes in Q. ilex × Q. suber progenies. As reported for the model species Arabidopsis, the repression of key genes that regulate the adaxial-abaxial polarity, such as ETT/ARF3, ARF4, and others that regulate the proximal-distal leaf length (class 1 KNOX homeobox genes - BP, KNAT2), produces asymmetric leaves ([26]).
The frequency of leaf asymmetries associated to development was significantly higher for two year-old seedlings than for four year-old seedlings. One possible explanation is that the modification of the epigenetic systems involved in the development of the foliar primordia produced by hybridization induces a higher degree of malformation in younger than in older plants. The few studies that have investigated the relationship between age and leaf anomalies suggest that leaf asymmetry decreased with age in leaves ([32]). Alternatively, extremely asymmetric leaves may fall from the seedlings earlier, showing apparently shorter life-spans than normal leaves. However, for deciduous trees, leaf life span is independent of asymmetry ([21]). Although not verified in field experiments, early expressed abnormality probably results in lower fitness of the hybrid seedlings, and in higher mortality rates than pure species. This could account for the low frequency of adult hybrid trees in mixed populations, no matter they produce high amount of viable acorns ([25]).
Leaf morphological variation in Q. ilex and Q. suber seedlings
Both multivariate and morphometric geometric analyses allowed the leaf morphological characterization of the seedlings that did not present asymmetrical patterns. In our study, the best descriptors of leaf morphology for seedlings of Q. ilex and Q. suber are lamina size, thickness, and shape, being leaf thickness the most discriminant character between Q. ilex and Q. suber. This result is consistent with the higher tolerance of Q. ilex seedlings to high values of light irradiance as compared with Q. suber seedlings ([42]). Castro-Díez et al. ([11]) showed, for a wide range of species, that the thicker mesophyll of evergreen seedling leaves was not due to cell wall thickening and sclerification, but a consequence of a larger number of cell layers to increase the photosynthetic capacity per area unit.
The significantly thicker leaves found for four year-old seedlings of both species from our study, matches with the increasing in thickness and leaf mass dry per unit area between cohorts reported for seedlings of the same species ([29]). Furthermore, species with a long average leaf life span, Q. ilex in this case ([28]), tend to have high leaf thickness and mass per unit area, low nutrient concentrations and show maximum photosynthetic rates ([39]).
Quercus ilex presented also leaves of higher size than Q. suber seedlings. Leaf area is known to be a character of great plasticity in deciduous temperate trees ([46], and references therein). This great plasticity was also described for evergreen species, such as Q. ilex ([30]), and Q. suber ([10]). Interestingly, leaf size from adult trees is traditionally described as following the opposite pattern, i.e., adult Q. ilex has smaller leaves than adult Q. suber ([4]). Actually, two year-old seedlings presented bigger leaves than four year-old seedlings. This seems to be an exception for evergreen species, because although leaf size varies across ontogenetic stages ([38]), linear allometric relationships during ontogenetic development are expected ([12]). Other authors, however, have reported that the increments in leaf mass per unit area as the seedling increases, seem to be achieved only through increased thickness, with no associated changes in density ([30]), and therefore, no impact on leaf surface.
The morphometric analysis showed significant differences between the leaf shape of Q. ilex and Q. suber seedlings. Leaves of Q. ilex seedlings show suborbicular shape, while Q. suber seedlings present ovate leaves ([4]). Leaf shape is highly dependent on general regulators of shoot apical meristem and cell cycling in the initial stages of leaf development ([5]), and, during the last stages, is adjusted by the environmental conditions ([49]). In this case, leaf shape showed very slight differences between seedlings of both cohorts, suggesting that it is a more stable character than size or thickness. Indeed, leaf shape is less variable across environments than size ([27]).
Segregation of morphological traits of hybrid progenies
Hybrid seedlings presented very diverse phenotypes that may resemble the phenotypes of pure species, or present transgressive traits possibly due to epistasis, heterosis and/or developmental instability ([44]). Leaf traits related to size, thickness, and shape showed independent segregation patterns in hybrid progenies. The correlation between the mean scores of the principal components related to size, thickness and shape, and the genetic category (qs) of the hybrid offspring is rather high (Fig. 4), particularly for those hybrid families that presented a wide spectrum of qs values (Is, LG1). On the contrary, correlation with the qs of the potential fathers is rather poor (Fig. 5), suggesting a maternal effect in the leaf characters of the seedlings. However, the mixed model did not detect a significant effect of the maternal genotype for any trait.
Leaf growth traits often show intermediate values in hybrids, as reported by [13] for Sorbus. In Quercus, Himrane et al. ([18]) reported a wide spectrum of foliar phenotypes for Q. faginea ×Q. pubescens hybrids, including those very close to the parental ones and other intermediate, although these latter ones were very scarce. In our case, only thickness, which is a highly discriminant trait between the parental species, showed an intermediate class between leaves of Q. suber and Q. ilex progenies. Conversely, leaf size and shape of hybrid families in our study were more similar to Q. suber than to Q. ilex, and only the family LG1, mostly pollinated by Q. ilex, presented intermediate values for these traits. This result point to differential segregation of genes that regulate leaf size, thickness and shape, and is not surprising, considering that most leaf traits are under polygenic control in oaks ([47]), but also that some of these genes may be pleiotropic ([14]).
Conclusion
While fluctuating asymmetry can be detected equally for Q. suber, Q. ilex and hybrid seedlings, a significantly higher proportion of developmental leaf asymmetry is found in hybrid offspring, which would be likely related to higher mortality of the seedlings, accounting for the low frequency of adult hybrid trees in mixed populations. Among the normally developed leaves, thickness was the most discriminant character between species, followed by size and shape. Hybrid offspring leaves show intermediate values, related to the individual genetic composition (qs), although maternal effects cannot be discarded.
Acknowledgments
AS and ULH conceived the idea, designed the experiments, collected the plant material and drafted the manuscript; MJD and ULH measured the leaves and performed the statistical analysis. All the authors have contributed to the final manuscript. This work has been funded by the project AGL2015-67495-C2-2-R (Spanish Ministry of Economy and Competitiveness).
References
Gscholar
CrossRef | Gscholar
Gscholar
Gscholar
Gscholar
CrossRef | Gscholar
Gscholar
Gscholar
CrossRef | Gscholar
Authors’ Info
Authors’ Affiliation
María José Duro-García
Álvaro Soto
GI Genética, Fisiología e Historia Forestal, Dept. Sistemas y Recursos Naturales, ETSI Montes, Forestal y del Medio Natural, Universidad Politécnica de Madrid (Spain)
Corresponding author
Paper Info
Citation
López De Heredia U, Duro-García MJ, Soto Á (2018). Leaf morphology of progenies in Q. suber, Q. ilex, and their hybrids using multivariate and geometric morphometric analysis. iForest 11: 90-98. - doi: 10.3832/ifor2577-010
Academic Editor
Piermaria Corona
Paper history
Received: Jul 31, 2017
Accepted: Oct 28, 2017
First online: Jan 31, 2018
Publication Date: Feb 28, 2018
Publication Time: 3.17 months
Copyright Information
© SISEF - The Italian Society of Silviculture and Forest Ecology 2018
Open Access
This article is distributed under the terms of the Creative Commons Attribution-Non Commercial 4.0 International (https://creativecommons.org/licenses/by-nc/4.0/), which permits unrestricted use, distribution, and reproduction in any medium, provided you give appropriate credit to the original author(s) and the source, provide a link to the Creative Commons license, and indicate if changes were made.

Web Metrics
Breakdown by View Type
Article Usage
Total Article Views: 51868
(from publication date up to now)
Breakdown by View Type
HTML Page Views: 42038
Abstract Page Views: 4436
PDF Downloads: 4292
Citation/Reference Downloads: 14
XML Downloads: 1088
Web Metrics
Days since publication: 3013
Overall contacts: 51868
Avg. contacts per week: 120.50
Article Citations
Article citations are based on data periodically collected from the Clarivate Web of Science web site
(last update: Mar 2025)
Total number of cites (since 2018): 11
Average cites per year: 1.38
Publication Metrics
by Dimensions ©
Articles citing this article
List of the papers citing this article based on CrossRef Cited-by.
Related Contents
iForest Similar Articles
Research Articles
A comparative fluctuating asymmetry study between two walnut (Juglans regia L.) populations may contribute as an early signal for bio-monitoring
vol. 3, pp. 150-152 (online: 15 November 2010)
Research Articles
Fine-scale spatial genetic structure in a multi-oak-species (Quercus spp.) forest
vol. 8, pp. 324-332 (online: 05 September 2014)
Research Articles
A comparative study of growth and leaf trait variation in twenty Cornus wilsoniana W. families in southeastern China
vol. 10, pp. 759-765 (online: 02 September 2017)
Research Articles
Genetic variation and heritability estimates of Ulmus minor and Ulmus pumila hybrids for budburst, growth and tolerance to Ophiostoma novo-ulmi
vol. 8, pp. 422-430 (online: 15 December 2014)
Research Articles
Seedling emergence capacity and morphological traits are under strong genetic control in the resin tree Pinus oocarpa
vol. 17, pp. 245-251 (online: 16 August 2024)
Research Articles
SimHyb: a simulation software for the study of the evolution of hybridizing populations. Application to Quercus ilex and Q. suber suggests hybridization could be underestimated
vol. 11, pp. 99-103 (online: 31 January 2018)
Research Articles
Patterns of genetic variation in bud flushing of Abies alba populations
vol. 11, pp. 284-290 (online: 13 April 2018)
Research Articles
Genetic diversity of core vs. peripheral Norway spruce native populations at a local scale in Slovenia
vol. 11, pp. 104-110 (online: 31 January 2018)
Technical Advances
Gene flow in poplar - experiments, analysis and modeling to prevent transgene outcrossing
vol. 5, pp. 147-152 (online: 13 June 2012)
Review Papers
Genetic diversity and forest reproductive material - from seed source selection to planting
vol. 9, pp. 801-812 (online: 13 June 2016)
iForest Database Search
Search By Author
Search By Keyword
Google Scholar Search
Citing Articles
Search By Author
Search By Keywords
PubMed Search
Search By Author
Search By Keyword


