Fine-scale spatial genetic structure in a multi-oak-species (Quercus spp.) forest
iForest - Biogeosciences and Forestry, Volume 8, Issue 3, Pages 324-332 (2015)
doi: https://doi.org/10.3832/ifor1150-007
Published: Sep 05, 2014 - Copyright © 2015 SISEF
Research Articles
Abstract
Patterns of fine-scale spatial distribution of multilocus genotypes can provide valuable insights into the biology of forest tree species. Here we tested for the existence of spatial genetic structure (SGS) in a four-oak-species forest with contrasting species abundances and hybridization rates. A total of 483 adult trees were mapped over 8.6 ha and genotyped using 10 highly polymorphic genomic regions. A weak but significant SGS was observed in each of the four oak species, with Quercus frainetto, the species with the lowest density in the sampling plot, exhibiting the strongest SGS. The values of the Sp statistic were 0.0033, 0.0035, 0.0042, and 0.0098 for Q. petraea, Q. robur, Q. pubescens, and Q. frainetto, respectively. The spatial correlogram of the total population was significantly different when hybrids were removed from the analysis, which suggests that hybridization influenced the SGS. Interspecific SGSs were significantly correlated with the rates of hybridization. Implications of the obtained results for the conservation and management of forest genetic resources are discussed.
Keywords
Spatial Genetic Structure, Quercus, Oak Species, Population Density, Hybridization
Introduction
Understanding the patterns of spatial genetic structure (SGS), i.e., the distribution of genetic variants in space, can provide us with useful information for the conservation and management of genetic resources. Spatial clustering of closely related individuals within populations arises from the interaction of genetic and demographic factors, which are often difficult to disentangle ([15], [23], [51], [18]). The intensity of SGS is strongly influenced by species dispersal ability, i.e., SGS is expected to increase in species with lower pollen and seed dispersal distances ([6]). Demographic parameters, such as population density and the spatial arrangement of individuals, are also important determinants of SGS. The strength of SGS is expected to increase in low density, as opposed to high density populations, although larger gene dispersal distances in low density populations may compensate for the effect of genetic drift ([51], [3]). In mixed stands, high tree density can limit dispersal by serving as a physical barrier to the movements of propagules ([20]). A natural reduction in population size may lead to a decrease in SGS through successive life stages, from juvenile to adult generations ([7]). The degree of spatial clustering of related individuals may also reflect the impact of silvicultural practices ([8], [38], [32]), the extent of clonal reproduction ([21]), and the influence of life history traits ([23], [28]). The complex interaction of factors that influence spatial patterns can have unexpected results, such as an absence of SGS in a pristine beech forest and the detection of SGS in an even-aged beech plantation ([36]). The level of introgressive hybridization may also shape SGSs within populations due to an excess of mating events between nearby individuals of different species and the spatial aggregation of the resulting hybrids ([49]).
Oak species (genus Quercus, family Fagaceae) are common elements of temperate and Mediterranean forest ecosystems. They are long-lived tree species, monoecious, highly outcrossing, and have wind pollination and gravity dispersed seeds, although a small proportion of seeds can be dispersed by animals (e.g., birds). Most oak species do not produce seeds (acorns) every year; the periodicity of abundant acorn production can reach up to 10 years in some parts of their natural range ([45]). They are both ecologically and economically important species, and are well known for their propensity to hybridize ([4], [39]). Relatively few studies have addressed the issue of SGS within oak populations and its genetic and ecological determinants ([1], [2], [48], [49], [18]). The SGS intensity, as quantified by the Sp statistic, is lower in oak populations than in other plant species ([51], [49], [18]). Differences in SGS between the two main oak species of temperate European forests, Q. robur and Q. petraea, were observed in mixed stands. The former species exhibited weaker spatial patterns, which may be explained by its greater acorn dispersal ([48], [8], [22]). Thus, only a single study has investigated the effects of oak hybridization on SGS in mixed stands of two species, Q. petraea and Q. pyrenaica, in Spain ([49]). An interspecific component of SGS was found in one of the stands, which showed a high level of hybridization. However, no investigation of the possible effects of density and interspecific gene flow has been performed in more complex communities that consist of other oak species or more than two closely related species with varying pairwise hybridization rates.
In the present study, we combined information from a high number of multilocus genotypes and spatial data to study the fine-scale SGS in a four-oak-species plot, covering 8.6 ha, which was exhaustively sampled. More specifically, we addressed the following questions:
(i) Do genotypes have a non-random spatial distribution in a mixed forest of four closely related species? We tested the hypothesis of absence of SGS by conducting a spatial autocorrelation analysis for each species, as well as for the total population. We expected the SGS to increase with reducing conspecific density, although the physical barriers to gene dispersal represented by the other tree species present in the stand may also affect the SGS.
(ii) Does hybridization influence SGS patterns? Purebreds and putative hybrids were identified in the oak forest based on genetic assignment. By quantifying the SGS for each species sensu lato (all trees) and sensu stricto (purebreds only), we tested whether hybrid individuals aggregated with their parents. If hybrids were randomly distributed, there would be no influence on the SGS once they are removed. To determine whether hybridization takes place between neighboring individuals of different species, we calculated correlograms based on restricted comparisons of pairs between two species (pairs within species were excluded).
Material and methods
Study site and sampling
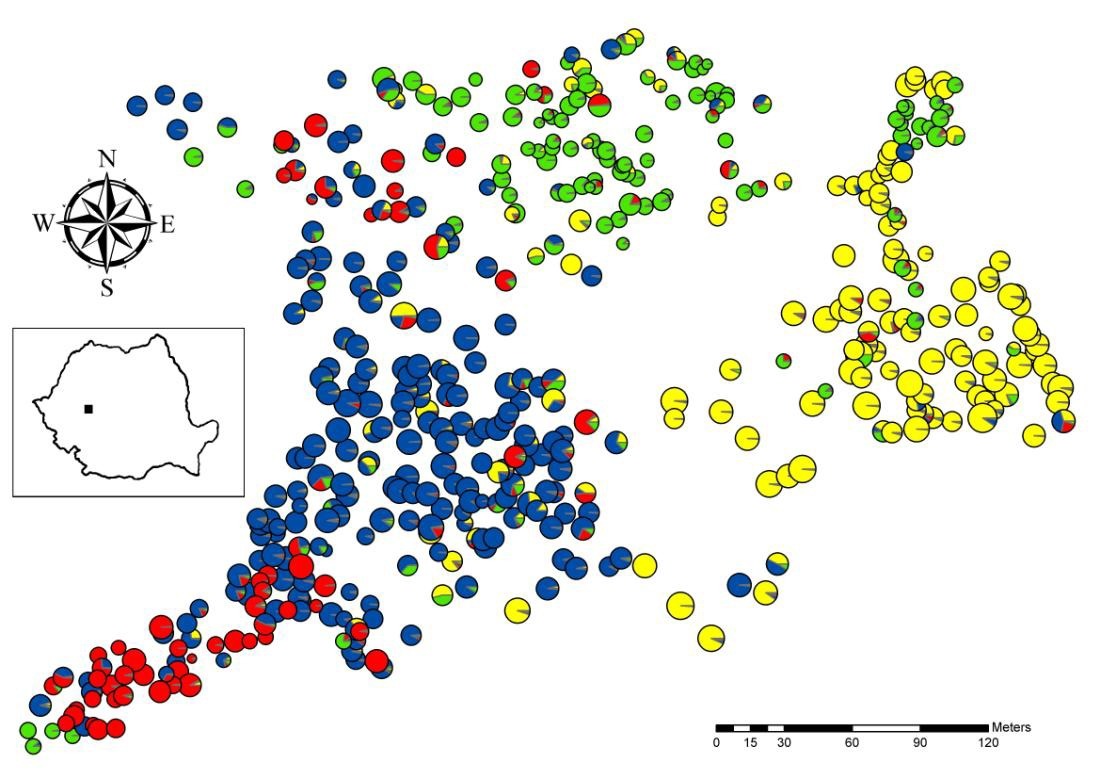
This study was performed in the Bejan Oaks Reserve, a mixed deciduous forest, which is located in central Romania (45° 51′ N, 22° 53′ E), near the city of Deva (Fig. 1). This forest consists mainly of four closely related oak species (Q. robur, Q. petraea, Q. pubescens and Q. frainetto), as well as the more distant species Q. cerris. In this location, there are other scattered tree species such as Tilia cordata, Acer campestre, A. platanoides, A. tataricum, Carpinus betulus, Fraxinus excelsior, Pyrus pyraster, Sorbus torminalis, S. domestica, and Malus sylvestris. The sampling was exhaustive over an area of about 8.6 ha. A total of 483 oak trees were tagged and mapped with a Field-Map system (Fig. 1). Q. cerris, the second most common species after Q. petraea, was not included in the present study, although it might have an effect on the pollen dispersal of the other oak species, thus influencing the SGS. Diameter at breast height (DBH) was also measured for all oak trees. Individuals were classified to the species level based on morphological traits ([45]). For a subset of 269 trees, a detailed leaf morphological examination was previously performed and only 16 (approximately 6%) individuals with intermediate morphologies were observed ([9]). Individuals with intermediate morphology were classified as the species they most closely resemble. Finally, we identified 190, 118, 113 and 62 individuals, which were Q. petraea, Q. robur, Q. pubescens and Q. frainetto-like, respectively (Tab. 1).
Fig. 1 - Spatial distribution of oak trees at Bejan Oaks Reserve. Each individual is represented by a circle. Each color within the circle represents the membership in one of the four genetic clusters identified in the Bayesian analysis. The membership in Q. robur, Q. pubescens, Q. petraea and Q. frainetto cluster is represented by yellow, green, blue and red color, respectively. Circle size is proportional to DBH.
Tab. 1 - Sample size per species (n), tree density and basic genetic statistics averaged across 10 microsatellite loci. (Na): mean number of alleles per locus; (He): gene diversity; (F): fixation index.
| Population (Long/Lat) |
Species | n | Tree density ha-1 |
Na | He | F |
|---|---|---|---|---|---|---|
| Bejan (45° 51′ N / 22° 53′ E) |
Q. robur | 118 | 13.72 | 19.5 | 0.787 | 0.047 |
| Q. pubescens | 113 | 13.14 | 18.2 | 0.854 | -0.005 | |
| Q. petraea | 190 | 22.09 | 19.8 | 0.786 | 0.037 | |
| Q. frainetto | 62 | 7.21 | 12.2 | 0.714 | -0.029 | |
| Total | 483 | - | - | - | - |
Genotyping
DNA was extracted from buds using the Qiagen DNeasy96 and Plant Mini Kit according to the manufacturer’s instructions, except for material disruption for which no liquid nitrogen was used. For a small subset of trees from the Bejan mixed forest, DNA was obtained using the cetyltrimethyl ammonium bromide (CTAB) method. Ten highly polymorphic microsatellite markers were used: QrZAG112, QrZAG96, QrZAG11, QrZAG20, QrZAG7, QrZAG87 ([24]), QpZAG110, QpZAG9 ([47]) PIE215 and PIE223 ([13]). These microsatellite markers are among those selected to genotype European oak species in recent studies ([26], [17], [31]). Several other markers were tested (e.g., QrZAG39 and QrZAG5b), but they were removed from the population screening due to the presence of null alleles or because the genotypes could not be reliably scored. Polymerase chain reactions (PCRs) were conducted in a Corbett thermal cycler. The forward primer was fluorescently labelled with Beckman dyes: D2, D3 or D4. The primer pairs were combined into three multiplex reactions. The first set comprised four markers, and dye type and primer concentrations (μM) are given in brackets: QrZAG112 (D4, 0.10), QrZAG96 (D3, 0.30), QrZAG11 (D3, 0.20) and QpZAG110 (D4, 0.40). The second set contained three markers, QrZAG20 (D3, 0.28), QrZAG7 (D4, 0.35) and QrZAG87 (D2, 0.40), and the last set comprised PIE215 (D4, 0.50), PIE223 (D3, 0.30) and QpZAG9 (D2, 0.35). The reactions were performed in a 10 μl volume containing approximately 10 ng of template DNA, 1x Promega colorless PCR buffer, 2 mM of MgCl2, 0.45 mM of each dNTP (Fermentas), and 0.2 U Taq DNA polymerase (Promega); for each primer concentration see the kit composition. The PCR profile was as follows: 3 min of denaturation at 94 °C followed by 31 cycles of 50 s denaturation at 94 °C, a 40 s annealing step at 52 °C, a 1 min 20 s elongation step at 70 °C and a final extension step at 70 °C for 12 min. Amplification products were run on a GenomeLab GeXP Genetic Analyser using the Frag-3 method and size standard 400. The products were then analyzed using Fragment Analysis Software using default parameters and PA ver1 dye correction.
First, we used the 10 microsatellite markers on a group of eight oak populations distributed across Romania (Tab. S1 in Appendix 1). Microsatellite markers were tested for genotyping errors due to large allele drop-outs, scoring of stutter peaks and non-amplified alleles using MICRO-CHECKER 2.2.0.3 ([50]). No evidence of large allele drop-outs or scoring of stutter peaks was found in the data set. The software indicated the presence of null alleles at low frequencies (less than 8%) for three markers (QrZAG11, PIE223 and QrZAG96) in one or two external populations only. However, simulations showed that at such low frequencies, these null alleles do not affect the overall outcome of the genetic assignment ([5]) or the robustness of SGS results ([36]). Finally, we used the same set of genetic markers to genotype the oak individuals sampled at the Bejan oak mixed forest. Basic genetic statistics were calculated using GENALEX software v. 6.4 ([33]).
Genetic assignment and hybrid identification
The Bayesian clustering method implemented in the STRUCTURE software v. 2.3.3 ([37]) was used to genetically assign individuals to clusters. Simulations were run for 100 000 steps following a burn-in period of 50 000 steps, considering values of K (number of clusters) from one to 10, with 10 replications for each value of K. The analysis was performed using admixture, correlated allele frequencies and no prior information regarding sampling location or morphological species. For each individual the program identifies the fraction of the genome that belongs to each one of the clusters.
First, we ran STRUCTURE for the set of eight external pure populations (346 individuals), which consisted of two morphologically pure populations for each of the four species found in the mixed forest of Bejan. The rate of change in the log likelihood between successive K values ([16]) was also estimated. The calculations were performed with STRUCTURE HARVESTER ([14]). We then ran STRUCTURE for all samples (829 individuals) with the same parameters as before. For the most likely number of clusters (K = 4), we averaged the values of the admixture coefficient (q) over 10 runs. For the classification of individuals into purebred and hybrid classes, we followed the procedure described in a previous study on four French oak species with 10 microsatellite markers ([26]). Each individual was considered to be a purebred when its q value (admixture coefficient) was larger than 0.90, and a hybrid when its q value was below this threshold. When an individual had a q value lower than 0.90 for one genetic cluster, and q value lower than 0.10 for each of the three remaining clusters, it was considered as purebred. Individuals with q values between 0.10 and 0.90 for three or four clusters were considered as hybrids between the two clusters (species) with the highest q value, no matter the q values for the third and fourth clusters.
Spatial genetic structure analysis
To study the spatial distribution of multilocus genotypes within both species and the total population, we computed the correlation coefficient r ([41]) using the program GENALEX 6.5 ([33]). The maximum pairwise distance between individuals sampled within the mixed forest varied between 315.8 m and 500.2 m for Q. robur and Q. pubescens, respectively. Because the sample size for each species varied considerably and the number of pairs within each distance class should be at least 100 ([19]), we set the distance intervals to 25 m. To compare the results between species, we also chose to conduct the analyses for 10 distance intervals between 0 and 250 m. Lower and upper 95% confidence intervals were computed by random shuffling (1000 times) of individual geographic locations; 95% confidence intervals around the mean value of the correlation coefficient r were estimated by bootstrapping pairwise comparisons within each distance interval (1000 repeats). The nonparametric heterogeneity test of Smouse et al. ([42]) was used to compare correlograms between species, with and without hybrids. The number of bootstrap resamplings was set to 999.
Additionally, we computed correlograms for interspecific pairs using Nason’s kinship coefficient, Fij ([27]), a widely used estimator of kinship for codominant markers ([19]). We also used the statistic Sp = -bF/(1-F1), where F1 is the mean kinship coefficient between all pairs of individuals in the first distance class, and bF (b-log) is the slope of the regression of kinship vs. the log of distance ([51]). The significance of the slope of the regression analysis was computed after 10 000 permutations. Sp confidence intervals were obtained as described in [49]. All calculations were performed using the SPAGeDi 1.2 software ([19]). Correlations were calculated using STATISTICA v.8 software ([46]).
Results
Classification of purebred and hybrid individuals in the mixed oak forest
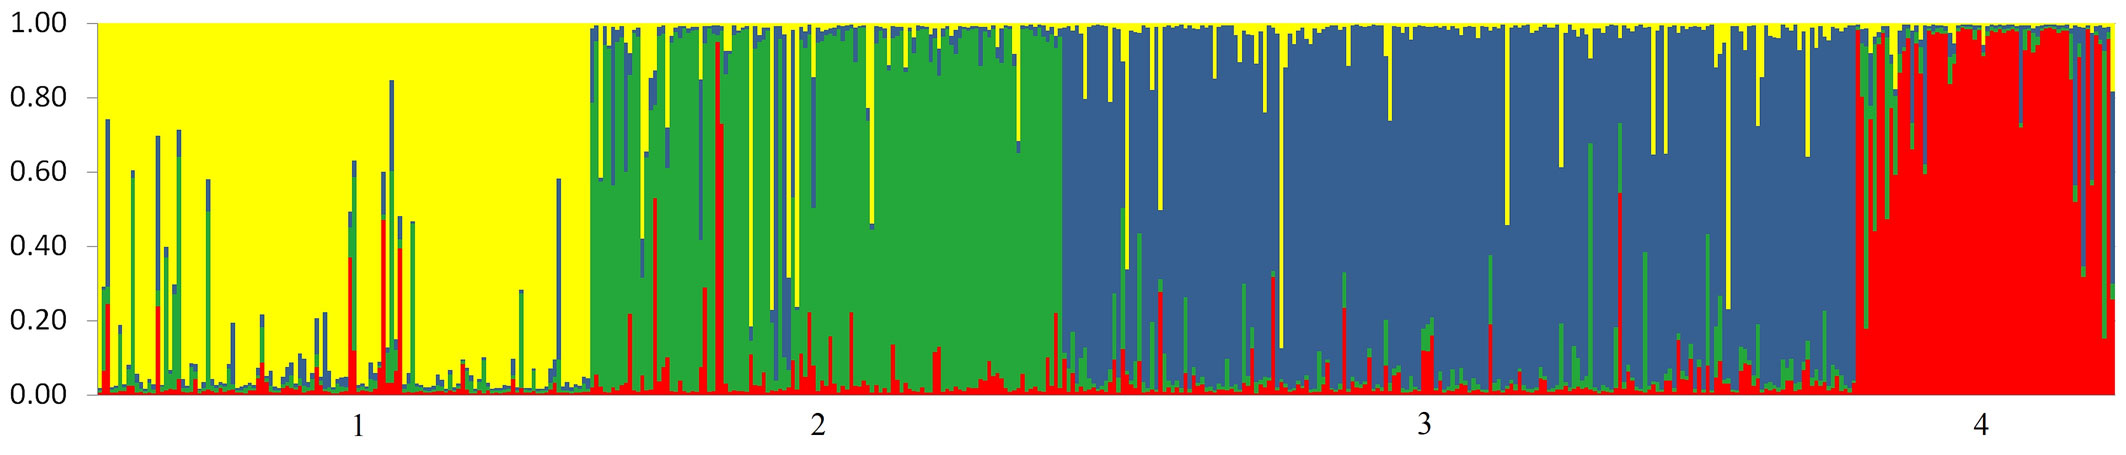
By running the STRUCTURE software for the set of eight external oak populations, we found that the optimal number of genetic clusters, which corresponds to the highest posterior probability, was K = 4 (additional data are given in Fig. S1 - Appendix 1). The highest value of ΔK statistics was obtained for K = 2, although the statistics also gave support for K = 4. We then ran the software for the whole sample set, including the 483 trees sampled in the mixed forest. For the most likely number of clusters (K = 4), a clear correspondence was observed between the genetic clusters identified in STRUCTURE and the morphological classification into four species (Fig. 2). The overall percentage of putative hybrids in the mixed forest was high (23.6%) and varied among the four species. The highest proportions of hybrids, 30.1% and 25.6%, were observed among individuals phenotypically classified as Q. pubescens and Q. frainetto, respectively. The most genetically pure species was Q. robur, with only 16.1% of the sampled individuals showing a hybrid origin. The highest hybridization rate was observed between Q. pubescens and Q. frainetto (12.0%), whereas the lowest was between Q. robur and Q. frainetto (1.7%).
Fig. 2 - Genetic structure revealed by 10 microsatellite markers. Each individual tree is represented by a thin vertical line which is divided into four color segments that are proportional to its membership in the four genetic clusters (K=4) inferred in the Bayesian analysis. Populations are separated by a thin black line. Populations 1-4 consist of oaks sampled in Bejan mixed forest, which are grouped to the species they most closely resemble: Q. robur (1), Q. pubescens (2), Q. petraea (3) and Q. frainetto (4).
Intraspecific spatial genetic structure
We found values of the correlation coefficient r outside the 95% confidence intervals in each of the four species (Fig. 3a). Regardless of the species, oak individuals in the shortest distance interval appeared to be more genetically related than expected based on a random distribution. The correlation coefficient was significantly positive for the first two distance classes (up to 50 m) only for Q. frainetto, the least abundant species in the mixed forest. The SGS patterns were characterized by a peak r value at the first distance class, followed by a more or less steady decrease for the remaining distance intervals (Fig. 3a). Overall, the heterogeneity test of SGS between each pair of species was not significantly different, nor for each distance class (data not shown).
Fig. 3 - Autocorrelograms for each oak species and the total population, considering (a) all trees (b) only trees genetically assigned as pure types (without hybrids). On x-axis are 25 m distance intervals. On y-axis is the correlation coefficient r of Smouse & Peakall ([41]). Confidence intervals of 95% obtained through random shuffling (red line) are given. Black lines around the r value represent 95% confidence intervals generated by bootstrapping.
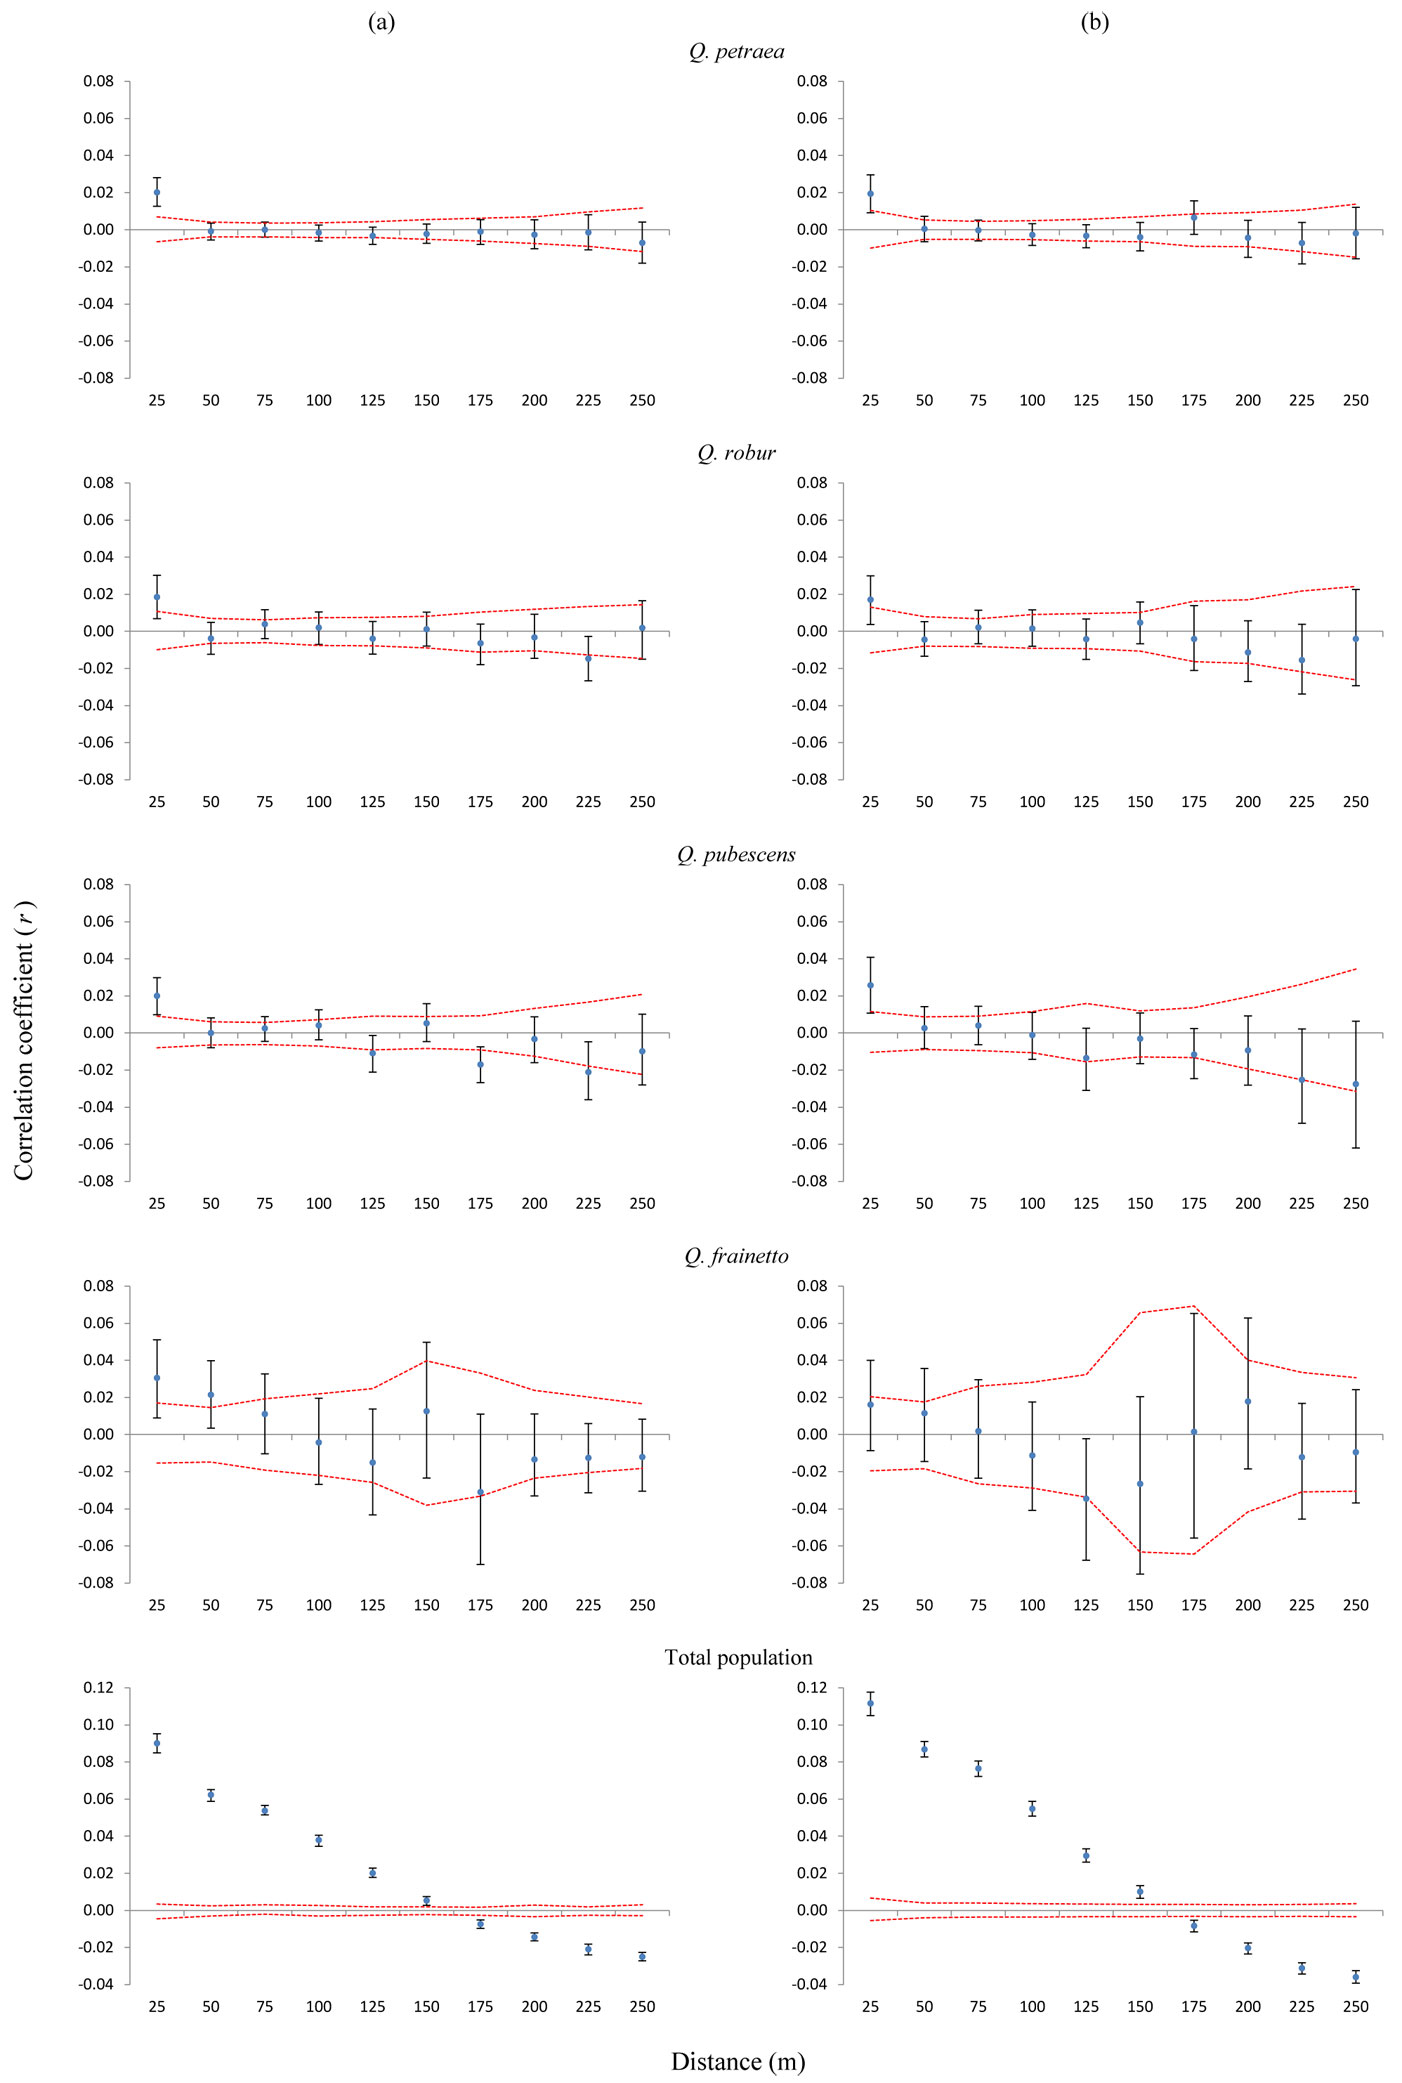
When only purebred individuals were considered, the correlograms revealed a similar pattern (Fig. 3b). However, the SGS was no longer significant for Q. frainetto, which is very likely due to the small sample size of this species once putative hybrids were removed. The statistical tests for heterogeneity between pairs of species were also not significant (data not shown).
The value of the Sp statistic was highest for Q. frainetto, and this value was significantly different from those of Q. robur and Q. petraea, which had the lowest values (Tab. 2). The value of bF was significantly different from zero in all four species (Tab. 2). After hybrids removal, Sp statistic values were no longer significantly different between species. Interestingly, Q. petraea and Q. robur had nearly the same values for the Sp statistic, with and without the inclusion of putative hybrids. After the removal of hybrids, Sp statistic value only increased for Q. pubescens. This species showed the highest proportion of hybrids (30.01%) among the four species in Bejan. Species density was inversely proportional to the Sp parameter, although the correlations were not significant, either with (r = -0.79, p = 0.20) or without hybrids (r = -0.87, p = 0.13).
Tab. 2 - Parameters describing spatial genetic structure for each species, the total population (overall) and hybrids. (n): number of individuals considered in the analysis; (F1): average kinship coefficient between individuals of the first distance class (0-25 m); [bF (b-log)]: slope of the regression of kinship coefficient Fij computed among all pairs of individuals against geographical distance; (Sp): intensity of spatial genetic structure; (SE): standard error; (95% CI): 95% confidence intervals; (*): P<0.05; (**): P<0.01; (***): P<0.001.
| SGS Analysis | Species | F 1 | bF (b-log) (±SE) |
Sp (95% CI) |
|---|---|---|---|---|
| Sensu lato (with the inclusion of putative hybrids) |
Q. petraea | 0.0114*** | -0.0032 ± 0.0006*** | 0.0033 (0.0019-0.0045) |
| Q. robur | 0.0103** | -0.0035 ± 0.0014*** | 0.0035 (0.0007-0.0063) |
|
| Q. pubescens | 0.0099*** | -0.0041 ± 0.0014*** | 0.0042 (0.0014-0.0069) |
|
| Q. frainetto | 0.0146** | -0.0096 ± 0.0017*** | 0.0098 (0.0064-0.0131) |
|
| Overall (n = 483) |
0.0511*** | -0.0286 ± 0.0083*** | 0.0301 (0.0129-0.0471) |
|
| Sensu stricto (pure-bred only) |
Q. petraea | 0.0110*** | -0.0032 ± 0.0009*** | 0.0033 (0.0015-0.0052) |
| Q. robur | 0.0097** | -0.0034 ± 0.0014** | 0.0034 (0.0006-0.0063) |
|
| Q. pubescens | 0.0123*** | -0.0051 ± 0.0015*** | 0.0051 (0.0020-0.0083) |
|
| Q. frainetto | 0.0074 | -0.0053 ± 0.0017* | 0.0053 (0.0020-0.0087) |
|
| Overall (n = 369) |
0.0637*** | -0.0375 ± 0.0102*** | 0.0400 (0.0182-0.0613) |
|
| All hybrids | Hybrids (n = 114) |
0.0172*** | -0.0069 ± 0.0029*** | 0.0069 (0.0011-0.0127) |
Spatial genetic structure in the total population
The intensity of the SGS was much higher in the total population compared with each species (Fig. 3a), and it became more intense after the exclusion of hybrids from the analysis (Fig. 3b). The heterogeneity test of SGS between the total population, with and without hybrids, was significant (p<0.01).
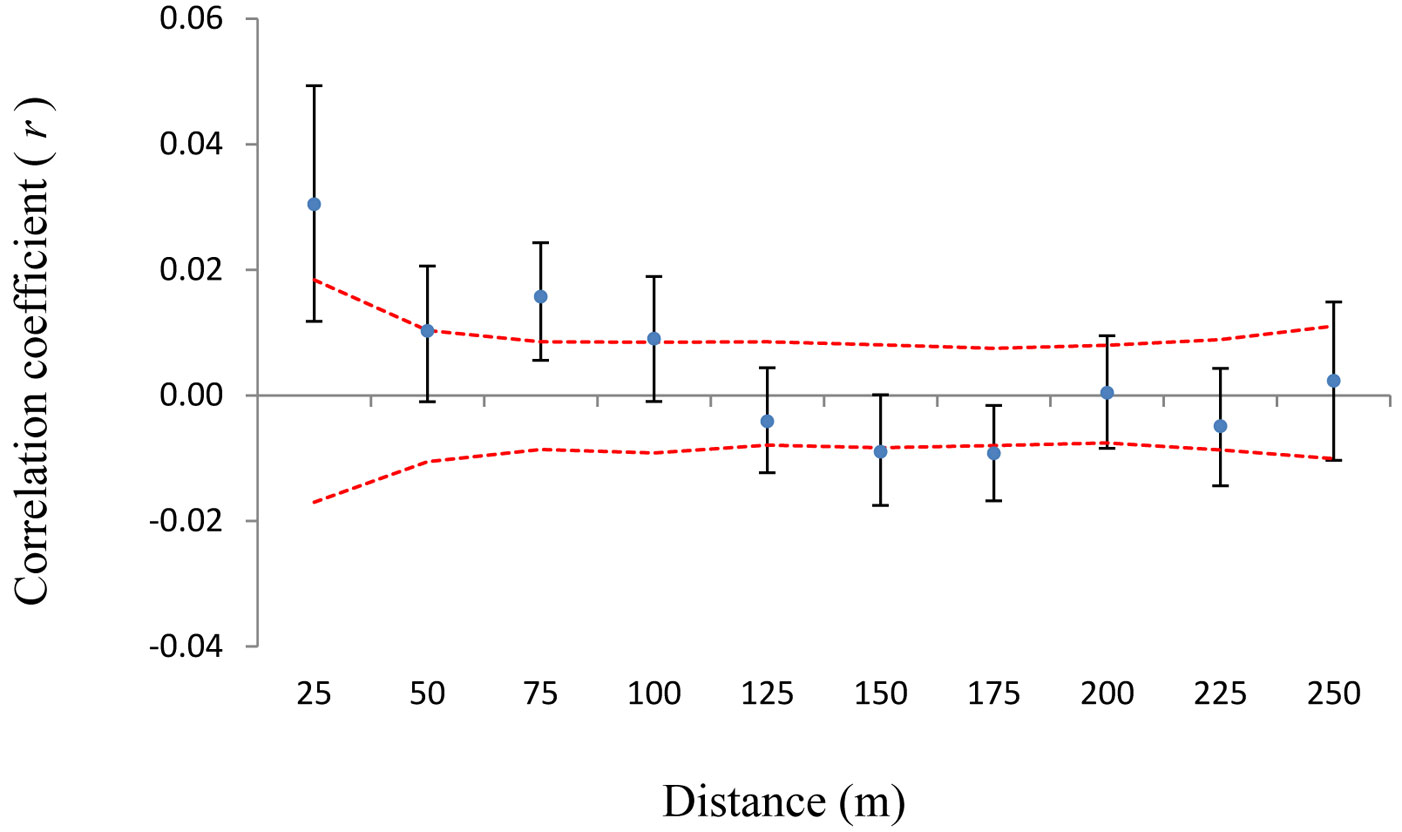
The same pattern was observed for the Sp parameter (Sp = 0.0301 for 483 trees, including both pure types and hybrids, compared with Sp = 0.0400 without hybrids - Tab. 2). A spatial structure was also observed when all 114 hybrids alone were analyzed (Fig. 4).
Fig. 4 - Spatial autocorrelogram for hybrids. On x-axis are 25 m distance intervals. On y-axis is the correlation coefficient r of Smouse & Peakall ([41]). Confidence intervals of 95% obtained through random shuffling (red line) are given. Black error bars represent 95% confidence intervals generated by bootstrapping.
Interspecific spatial genetic structure
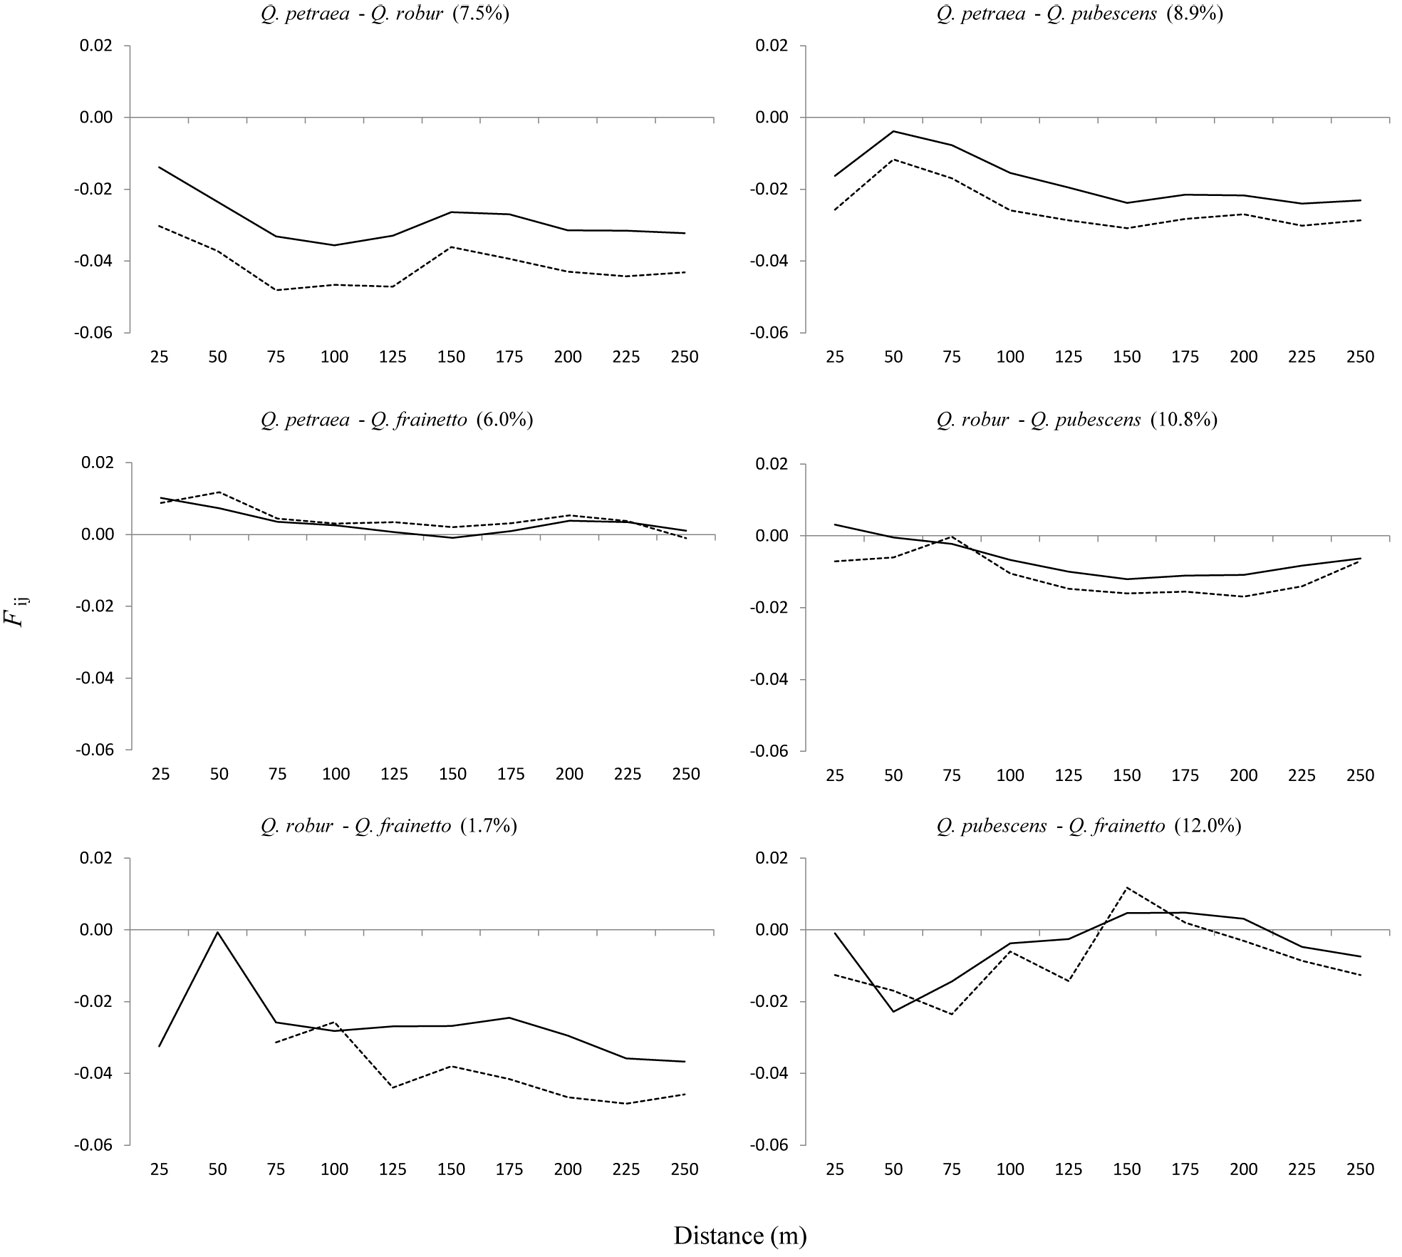
When the analysis of SGS was rectricted to mixed pairs between species, values of the kinship coefficients (Fij) were negative in most comparisons (Fig. 5). However, positive values of the kinship coefficient (Fij) for shorter distance classes were observed for two pairs, Q. petraea - Q. frainetto and Q. robur - Q. pubescens (Fig. 5), while the value of bF, which is independent of distance intervals, was not significantly different from zero (-0.0022NS vs. -0.0029NS, respectively). A very low value of bF was obtained for the Q. pubescens-Q. frainetto pair (-0.0003NS), where distance pairs ranging from 150 to 200 m appeared to be more genetically related than those of the shorter distances (Fig. 5). The hybridization rate between pair of species (Fig. 5) was inversely correlated with the Sp value (r = -0.85, p < 0.05). Lower values of the kinship coefficient were obtained for the smallest distance intervals in three out of the five cases once putative hybrids were removed from the dataset (Fig. 5). The comparison between Q. frainetto and Q. robur was not taken into account due to the low number of pairs. Consequently, values of bF were lower without hybrids (data not shown).
Fig. 5 - Interspecific autocorrelograms, considering all trees (continuous line) and only trees genetically assigned as pure types (dotted line). On x-axis are 25 m distance intervals. On y-axis is the Nason kinship coefficient (Fij) of Loiselle et al. ([27]). Estimation of the hybridization rate is given in brackets.
Discussion
Intraspecific spatial genetic structure
A weak though significant SGS up to 25-50 m was detected in each of the four oak species present in the mixed forest. The existence of a fine-scale SGS at the level of each oak species can primarily be explained by the limited dispersal of propagules (seeds and pollen) from adult trees ([48], [43], [51]). Mating usually takes place between nearby trees, and a reduced number of parental genotypes is overrepresented in the offspring generation ([18]). The weak kinship structure fits well with our expectations because this mixed forest is at an old ontogenetic stage, in which family structures are weak due to mortality through life cycle stages, as was suggested for an unmanaged stand of Q. petraea ([22]) and Fagus sylvatica ([12]). Similar values for the Sp statistics were obtained in adult oak stands composed of one or two species: 0.005 in a Q. robur stand ([18]), 0.0029 and 0.0082 for Q. robur and Q. petraea, respectively ([48], calculated in [51]), and 0.0033 and 0.0132 for Q. petraea, depending on the stand ([49]).
At Bejan, the highest value of the Sp statistics was obtained for the least abundant species, Q. frainetto. This value was significantly different from those obtained for the most common species, Q. petraea and Q. robur, being the former characterized by a restricted seed dispersal as compared with the two latter species. Moreover, results of a previous paternity analysis carried out in the same multi-oak stand suggest a restricted pollen flow in Q. frainetto: only 18-24% of the pollen grains originated from outside of the study plot ([11]). In contrast, four Q. petraea mother trees received on average at least 59% of their pollen from outside the sampling plot. The intensity of SGS was similar in Q. robur and Q. petraea, although Q. robur acorns are heavier than those of Q. petraea, and it is widely accepted that the former can be transported larger distances, as they are preferred by birds ([35]). Indeed, the fine-scale SGS was stronger for Q. petraea than for Q. robur in a mixed forest with similar densities of both species ([48]). Hence, other factors should explain the nearly identical Sp values obtained for Q. robur and Q. petraea in Bejan, although the kinship coefficient at the first distance interval (F1) was slightly higher for Q. petraea than for Q. robur (Tab. 2). The strength of the SGS, as indicated by the Sp parameter, is significantly related to population density, that is, the Sp value is higher in low density, as compared with high density populations ([51]). However, no correlation between the SGS intensity and the conspecific density was found at Bejan. Although the density of Q. robur trees in Bejan was lower than that of Q. petraea, the higher seed and pollen dispersal ability of Q. robur ([35], [25]) may have contributed to the decrease relative to Q. petraea, in SGS, thereby leading to similar SGS intensities in the sampling plot.
Within-population spatial genetic structure
A very strong and statistically significant SGS was detected over the 8.6 ha of the total population, which consisted of all 483 sampled oak individuals. The values of the Sp statistic were 3-9 times higher in the total population than in each of the four species. The spatial distribution of species in the study plot had a considerable influence on the SGS (Fig. 1). Each of the four oak species is predominant in one part of forest, where habitat conditions better correspond to its ecological requirements. Thus, Q. robur trees are mostly found in deep soil along a small valley in the eastern part of the study site (Fig. 1). Q. pubescens grows in shallow soil, on a gradual south-facing slope in the upper part of the sampling plot. Q. petraea is found in better aerated and drained soil, whereas Q. frainetto grows in clay-rich soils ([44]).
Influence of hybridization on spatial genetic structure
Hybridization appears to be another factor influencing fine-scale SGS in plant populations ([49]). At an intraspecific level, almost no changes were detected for Q. robur and Q. petraea when the putative hybrids were removed, likely because these two species exhibited the lowest number of hybrids. Nearly identical values of the Sp parameter, with and without the inclusion of hybrids, suggest that hybrids contributed little to the formation of the SGS in these two species, and that their hybrids were not spatially aggregated with their pure species in the sampling plot. In contrast, the SGS for Q. pubescens was stronger in the absence of hybrids, which suggests that hybridization has weakened the SGS. It is worth mentioning that the proportion of hybrids was the highest amongst trees phenotypically classified to Q. pubescens. At an interspecific level, our results suggest that the hybridization rate between two species is related to the intensity of the SGS, as quantified by the Sp parameter. That is, the higher the gene flow between two species, the weaker the interspecific SGS. However, the rate of hybridization is dependent on species characteristics and the environmental context ([40], [25]). Positive values of the kinship coefficient in the first distance class were observed in those pairs of species showing a high degree of intermixing at Bejan: Q. petraea - Q. frainetto and Q. robur - Q. pubescens. A study performed in Spain revealed the presence of both SGS components, intra- and inter-specific, in one stand of Q. petraea and Q. pyrenaica that had a high hybridization rate, although the interspecific component was missing in a second stand where hybridization was rare ([49]). At Bejan, the exclusion of hybrid individuals led to a decrease in the pairwise kinship coefficient in the first distance class (0-25 m) in three out of five species comparisons, therefore suggesting that hybridization could predominantly take place between nearby trees belonging to different species. This result is consistent with that reported for a Spanish mixed oak stand ([49]).
Implications for conservation and management
The existence of SGS in each of the four oak species supports the hypothesis of the natural origin of this multi-oak-species stand, and confirms the small amount of information available on stand history from forest records ([44]). The presence of any SGS was hypothesized to be a hint that the study plot is part of an ancient forest ([22]). Moreover, the strongest SGS occurred in the least disturbed, old-growth Eastern white pine forest ([30]). However, Piotti et al. ([36]) reported no significant SGS in a 250 to 300-years-old beech stand located in a pristine Austrian forest. In the same study, a weak, but significant, SGS was also detected in a single beech plantation, suggesting that the presence of SGS alone does not necessarily imply that the stand is of natural origin. The autochthony of the Bejan forest is also supported by the identification of region-specific chloroplast DNA haplotypes that belong to lineage B ([10]). These chloroplast haplotypes were observed in the same geographic region during a large-scale survey ([34]).
Certainly, there has been great anthropogenic pressure on the Bejan forest until its establishment as an Oaks Reserve in 1936. Since then, only sanitation cuttings of low-intensity have been performed in different parts of the reserve, including the study plot ([44]). This low-intensity forest management might have contributed to the preservation of the SGS found by spatial autocorrelation analysis in Bejan. More intensive silvicultural interventions, e.g., the shelterwood system, had also a weak to negligible effect on the SGS when comparing managed and unmanaged beech stands having the same biogeographic history ([36]). However, second growth stands did not exhibit a SGS, although a SGS was found in primary growth stands of Eastern white pine in North America ([29]). Hence, the decrease of pairwise relatedness with spatial distance within forest stands provide useful information on the stand history, which is essential for conservation strategies and sustainable forest management practices.
Acknowledgements
This work was financially supported by UEFISCDI-CNCS, project number PNII-RU-TE-73/2010. Iacob Craciunesc was supported by the Sectoral Operational Programme Human Resources Development (SOP HRD), financed from the European Social Fund and by the Romanian Government under the project number POSDRU/159/1.5/S/ 134378. We thank Andras Tothpal for his assistance during the field work. We are grateful to three anonymous reviewers for their constructive comments on the manuscript.
References
CrossRef | Gscholar
CrossRef | Gscholar
CrossRef | Gscholar
CrossRef | Gscholar
Gscholar
Gscholar
Gscholar
Gscholar
Authors’ Info
Authors’ Affiliation
Iacob Craciunesc
Cristian Mihai Enescu
Nicolae Sofletea
Department of Forest Sciences, Transilvania University of Brasov, Sirul Beethoven-1, 500123 Brasov (Romania)
Department of Soil Sciences, University of Agronomic Sciences and Veterinary Medicine of Bucharest (Romania)
Umeå Plant Science Centre, Department of Ecology and Environmental Science, SE-901 87 Umeå (Sweden)
Corresponding author
Paper Info
Citation
Curtu AL, Craciunesc I, Enescu CM, Vidalis A, Sofletea N (2015). Fine-scale spatial genetic structure in a multi-oak-species (Quercus spp.) forest. iForest 8: 324-332. - doi: 10.3832/ifor1150-007
Academic Editor
Andrea Piotti
Paper history
Received: Oct 14, 2013
Accepted: Aug 23, 2014
First online: Sep 05, 2014
Publication Date: Jun 01, 2015
Publication Time: 0.43 months
Copyright Information
© SISEF - The Italian Society of Silviculture and Forest Ecology 2015
Open Access
This article is distributed under the terms of the Creative Commons Attribution-Non Commercial 4.0 International (https://creativecommons.org/licenses/by-nc/4.0/), which permits unrestricted use, distribution, and reproduction in any medium, provided you give appropriate credit to the original author(s) and the source, provide a link to the Creative Commons license, and indicate if changes were made.

Web Metrics
Breakdown by View Type
Article Usage
Total Article Views: 62796
(from publication date up to now)
Breakdown by View Type
HTML Page Views: 50783
Abstract Page Views: 4856
PDF Downloads: 5406
Citation/Reference Downloads: 37
XML Downloads: 1714
Web Metrics
Days since publication: 4271
Overall contacts: 62796
Avg. contacts per week: 102.92
Article Citations
Article citations are based on data periodically collected from the Clarivate Web of Science web site
(last update: Mar 2025)
Total number of cites (since 2015): 30
Average cites per year: 2.73
Publication Metrics
by Dimensions ©
Articles citing this article
List of the papers citing this article based on CrossRef Cited-by.
Related Contents
iForest Similar Articles
Research Articles
Seedling emergence capacity and morphological traits are under strong genetic control in the resin tree Pinus oocarpa
vol. 17, pp. 245-251 (online: 16 August 2024)
Research Articles
SimHyb: a simulation software for the study of the evolution of hybridizing populations. Application to Quercus ilex and Q. suber suggests hybridization could be underestimated
vol. 11, pp. 99-103 (online: 31 January 2018)
Research Articles
Genetic diversity of core vs. peripheral Norway spruce native populations at a local scale in Slovenia
vol. 11, pp. 104-110 (online: 31 January 2018)
Research Articles
Genetic variation and heritability estimates of Ulmus minor and Ulmus pumila hybrids for budburst, growth and tolerance to Ophiostoma novo-ulmi
vol. 8, pp. 422-430 (online: 15 December 2014)
Research Articles
Patterns of genetic variation in bud flushing of Abies alba populations
vol. 11, pp. 284-290 (online: 13 April 2018)
Research Articles
Age trends in genetic parameters for growth and quality traits in Abies alba
vol. 9, pp. 954-959 (online: 07 July 2016)
Research Articles
Clonal structure and high genetic diversity at peripheral populations of Sorbus torminalis (L.) Crantz.
vol. 9, pp. 892-900 (online: 29 May 2016)
Review Papers
Genetic diversity and forest reproductive material - from seed source selection to planting
vol. 9, pp. 801-812 (online: 13 June 2016)
Research Articles
Delineation of seed collection zones based on environmental and genetic characteristics for Quercus suber L. in Sardinia, Italy
vol. 11, pp. 651-659 (online: 04 October 2018)
Research Articles
Comparison of genetic parameters between optimal and marginal populations of oriental sweet gum on adaptive traits
vol. 11, pp. 510-516 (online: 18 July 2018)
iForest Database Search
Search By Author
Search By Keyword
Google Scholar Search
Citing Articles
Search By Author
Search By Keywords
PubMed Search
Search By Author
Search By Keyword


