Estimation of stand crown cover using a generalized crown diameter model: application for the analysis of Portuguese cork oak stands stocking evolution
iForest - Biogeosciences and Forestry, Volume 9, Issue 3, Pages 437-444 (2015)
doi: https://doi.org/10.3832/ifor1624-008
Published: Dec 02, 2015 - Copyright © 2015 SISEF
Research Articles
Abstract
A generalized non-linear tree crown diameter model was developed with the aim of allowing the computation of tree crown diameter over a large range of tree dimensions, and allowing its inclusion in forest growth and yield models. The model was formulated to provide biological meaning to the predicted values. Due to the nested structure of the data analyzed (trees within stands), both mixed- and fixed-effect models were developed. Since tree crown diameter is not frequently measured in forest inventories, the validation of the mixed model was carried out by considering the population specific response. The results demonstrate that when the measurements required for the mixed model calibration are not available, the use of the fixed effect model results in less biased and more accurate estimates. The fixed model was applied to the data from the two last Portuguese National Forest Inventories (NFI) to analyze the change in stand crown cover and assess the stocking evolution of cork oak stands in Portugal between 1996 and 2006. Results showed an increase in the frequency of stands with crown cover lower than 20%, as well as a decrease in the frequency of stands with crown cover between 20 and 40%. Average crown cover values were significantly different in the two NFI, with a decrease from 28.0 to 26.5% over the considered period.
Keywords
Quercus suber, Stand Crown Cover, Tree Crown Diameter, Nonlinear Mixed Effects Model, Nonlinear Fixed Effects Model, Portuguese National Forest Inventory
Introduction
Stand crown cover is an important variable for the assessment of forest productivity and sustainability. Its computation requires the measurement or estimation of the tree crown diameter, which is time-consuming and cost expensive, and therefore is not frequently measured in forest inventories. This has led to the development of generalized crown diameter models to this purpose ([12], [8], [37]).
In the last decade, crown diameter models have been developed for cork oak (Quercus suber L.) by Paulo et al. ([22]), Sánchez-González et al. ([32]) and Paulo & Tomé ([23]). In particular, Paulo et al. ([22]) developed a linear relation between diameter at breast height (dbh) and tree crown diameter (cw) with a limited data set collected on two typical low densities stands (varying from 67 to 97 tree ha.1). From a biological standpoint, linear relationships can only be applied to young stands, when both variables are in the linear phase of the growth curve. In older stands, the relationship between diameter and crown width growth is no longer linear. Therefore, the usage of linear models as done by Paulo et al. ([22]) is considered not suitable for the application to a large geographical scale. A crown diameter model was developed by Sánchez-González et al. ([32]) using a large data set from the second Spanish National Forest Inventory (NFI), where all trees with diameter at breast height above 7.5 cm were measured. Despite considering five alternative model functions (linear, parable, power, monomolecular and Hossfeld II), none of these was formulated in order to reflect biological characteristics, such as the existence of an upper asymptote in the relationship between diameter and crown width. The final selected model was a concave parabolic function which included the quadratic mean diameter under cork as independent variable and a value of zero for model interception. Due to its formulation, this model predicts, for some combinations of diameter at breast height and quadratic mean diameter, a decrease of tree crown diameter for larger diameters. Thus, this model also can not be considered suitable from a biological standpoint.
Despite several supporting measures for combating forest dieback across European Union countries ([31]), cork oak tree mortality is currently increasing and is one of the main concerns for the future sustainability and productivity in Mediterranean oak woodlands. Its cause is likely due to the interaction of several biotic and/or abiotic factors ([36]). According to the Portuguese NFI, a decrease in the stocking of stands has been recorded - from an average stand density of 85 to 65 trees ha-1 -, as well as in stand basal area under cork - from 5.72 to 4.82 m2 ha-1 ([10], [2]), with consequent losses in cork production and carbon sequestration ([25], [6]) that impact the Portuguese forests and economy. However, information is lacking on another variable that is important for the analysis of stand stocking, i.e., stand crown cover.
Cork oak stands are generally managed as agroforestry or silvopastoral areas, with crown cover traditionally used for defining stand stocking limits according to the management objectives, i.e., cork, pasture and/or animal production ([21], [20]).
The main objective of this research is the development of a generalized non-linear model for the tree crown diameter prediction that can be used for a large range of tree diameter values and that is biologically representative, in order to allow its inclusion in growth and yield models such as the SUBER model ([24], [25], [26], [27], [28]) NFI data sets and other plot types where the lower threshold of diameter at breast height (dbh) over cork is 2.5 cm. All candidate models were formulated to ensure biologically meaningful predictions, as suggested by Burkhart & Tomé ([3]). The developed model will be applied to the data from the last two Portuguese NFI ([10], [2]), allowing the assessment of the evolution of stands crown cover in Portuguese cork oak stands between 1996 and 2006.
Material
Data
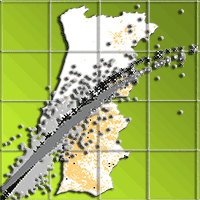
Tree crown diameter (cw) was computed at tree level as the average of crown radius measurements taken on the four main cardinal points. The data set used to fit the tree crown diameter model consisted of 12 768 observations, measured on 320 permanent plots spread over the distribution range of cork oak in Portugal. Permanent plots had a circular shape with an area of 2827 m2. A set of independent observations was also used to validate the selected model. This additional data set consists of 1373 observations taken at 29 forest inventory plots (circular plots of 2827 m2). All plots were located in cork oak pure stands. Fig. 1 shows the distribution of the plots used in this analysis.
Fig. 1 - Location of the sampling plots used in this study.
For both the above data sets the following stand parameters were calculated: number of trees per hectare (N), basal area (Gu), dominant diameter (dudom), dominant height (hdom) and quadratic mean diameter (dug). All stand variables related to tree diameter refer to diameter under cork (du in cm). This variable was computed by subtracting cork thickness (ct in mm) measured with a caliper on trees with mature cork (du = d - 2ct/10), or using the model presented by Paulo & Tomé ([28]) for the estimation of dbh under cork in trees presenting virgin cork at breast height (undebarked trees). Only trees with dbh over cork > 7.5 cm were considered in the computation of the above stand variables. This definition allows the application of the proposed model in future national forest inventory data analysis. Nonetheless, the developed model can be applied to all trees over 2.5 cm of dbh over cork, as this threshold was used for tree measurements in the plots for both the fitting and the validation data sets. Due to the low average density of cork oak stands, dominant trees were defined as the 25 thickest trees per hectare ([29]). The range of values characterizing the fitting and validation data sets is presented in Tab. 1.
Tab. 1 - Summary statistics of the data sets used for fitting and validate the models developed in this study. (du): diameter at breast height under cork; (cw): crown diameter; (hdom): dominant height; (dudom): dominant diameter; (dug): quadratic mean diameter; (N): number of trees per hectare; (Gu): basal area under cork.
| Data set | Value | cw (m) |
du (cm) |
dug (cm) |
hdom (m) |
N (ha) |
Gu (m2) |
|---|---|---|---|---|---|---|---|
| Fitting (n=12768) |
Minimum | 0.4 | 0.6 | 3.9 | 2.1 | 4 | 0.02 |
| Mean | 4.7 | 20.7 | 18.5 | 9.1 | 291 | 8.03 | |
| Maximum | 19.8 | 128.9 | 57.3 | 18.2 | 929 | 30.12 | |
| Validation (n=1373) |
Minimum | 0.2 | 0.6 | 10.8 | 7.2 | 35 | 3.34 |
| Mean | 4.9 | 21.9 | 18.8 | 8.5 | 375 | 10.91 | |
| Maximum | 21.5 | 112.7 | 48.5 | 11.9 | 792 | 39.11 |
A total of five distance-independent competition indexes were computed ([3]), namely: the ratio between the tree diameter under cork (du) and the dominant diameter (du_dudom), between du and the quadratic mean diameter (du_dug), and between du and the maximum diameter (du_dumax). Additionally, two competition indexes (indicated as G>du1 and G≥du2) were computed as the sum of the basal area of all trees with a diameter larger than the subject tree, and the sum of the basal area of all trees with a diameter greater than or equal to that of the subject tree, respectively.
National Forest Inventories data
The NFI carried out in 1995-1996, designated as IFN4 ([10]), includes 371 measured plots, while the 2005-2006 NFI, designated as IFN5 ([2]), includes 970 plots. Tree diameter at breast height was measured in both inventories, tree total height was measured for dominant trees in IFN5 and tree crown diameter was measured in sample trees in IFN4. Their values are published in official reports ([10], [2]).
Crown diameter model fitting
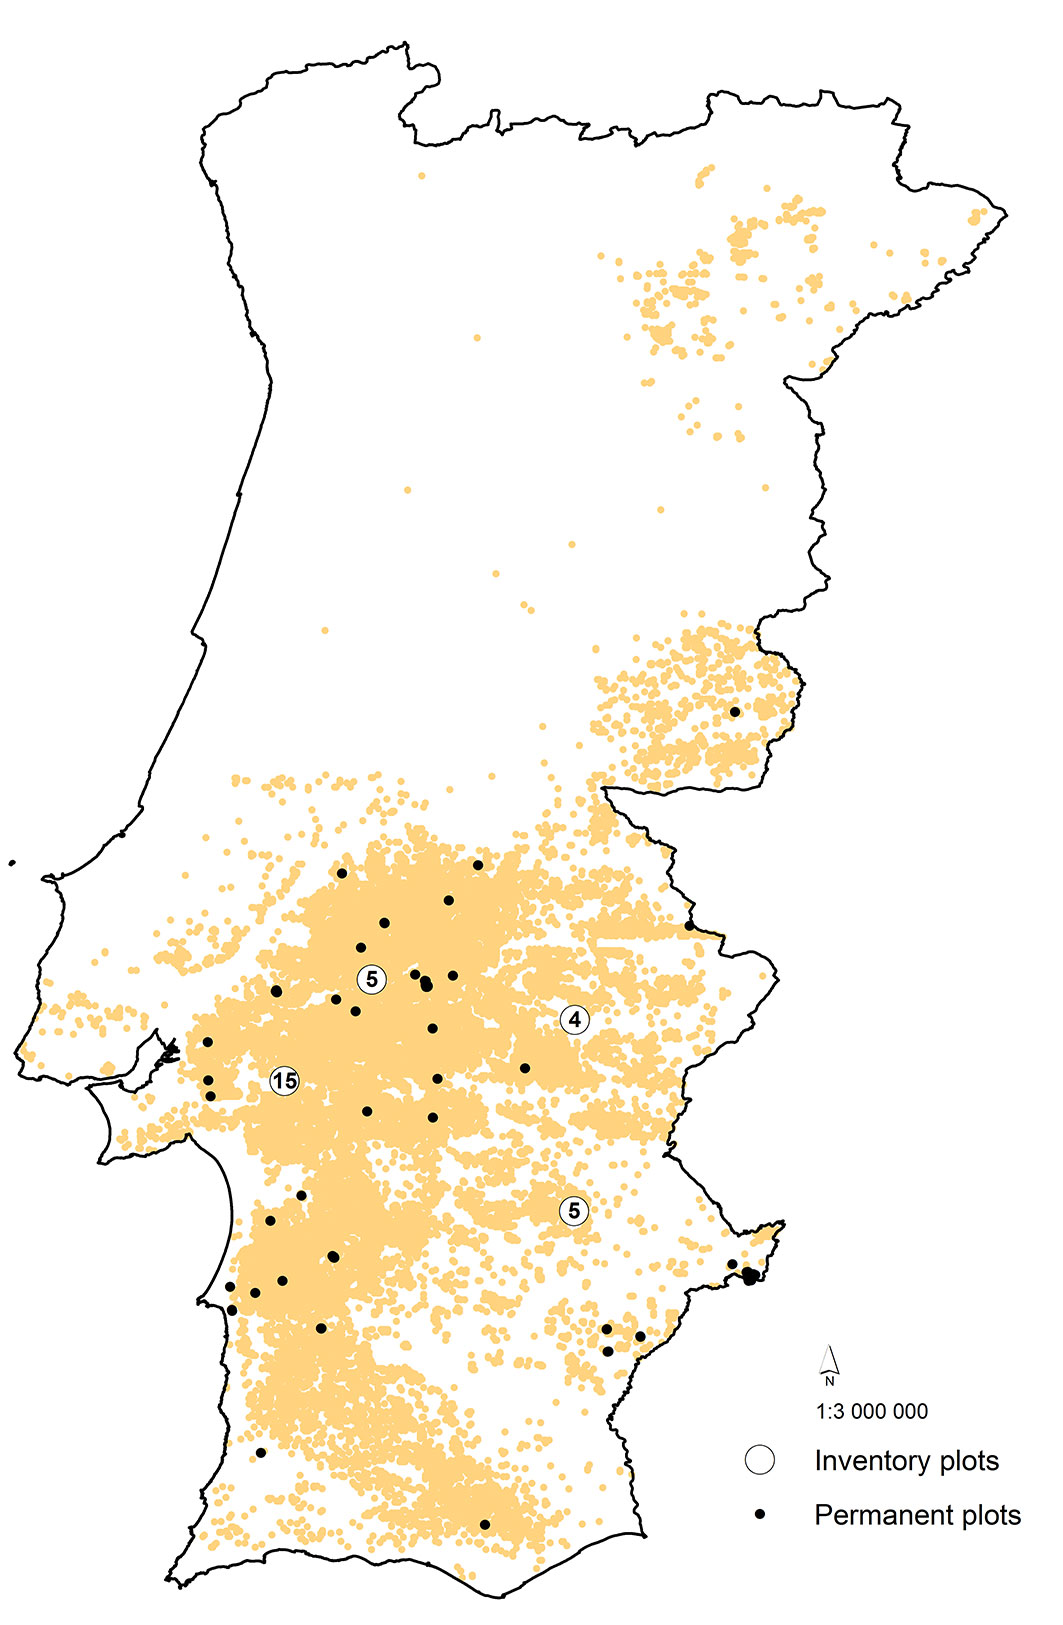
Candidate models for the relationship between tree height and diameter were obtained from the list proposed by Paulo et al. ([27]). Among the 33 models originally proposed by Huang et al. ([15]), Paulo et al. ([27]) selected those increasing monotonically and showing an upper asymptote. The existence of an inflection point ([17]) was not considered compulsory, since the relation between tree diameter and tree crown variables did not show any inflection point. This is supported by data measurements observed for both the fitting and the validation data sets (Fig. 2), as well as by previous reports for cork oak ([32]) and other species ([8]).
Fig. 2 - Relation between the tree crown diameter of cork oaks (cw in m) and the diameter at breast height under cork (du in cm) in the two data sets considered in this study.
Some of the candidate functions had to be modified from their original form in order to ensure consistent values at the point (du, cw) = (0, cw0), where cw0 is a positive value corresponding to the tree crown diameter when the individual tree reaches 1.30 m of total height. Since cw0 has to be estimated, such candidate models included an additional parameter as compared with their original formulation by Huang et al. ([15]). No limits were considered for the number of parameters to be included in the model.
Overall, ten candidate models were selected for further analyses (see Tab. S1 in Appendix 1). Fitting of the selected candidate functions was carried out using the data from each plot and the nonlinear least squares (NLS) method implemented in the SAS® MODEL procedure ([33]). To ensure meaningful estimates, only plots with more than 30 observations were considered. The mean square error of prediction (MSEi) for plot i was calculated for each candidate model as follows (eqn. 1):
where êij is the residual from the j-th tree in the i-th plot and ni is the number of trees in the i-th plot. The sum of MSE obtained for each plot (∑MSE) was computed for each function, and used as a criterion to select the best-fitting candidate model ([27]). Additional criteria were the adjusted R-square (adj-R2) and mean square error (MSE) obtained by fitting each equation to the complete fitting data set.
Values predicted by the selected model for each plot were plotted against the observed stand variables for all the parameters considered, as well as against the tree competition indexes values calculated for each corresponding plot and tree. In addition, regression analysis was carried out by ordinarily least squares, in order to identify which parameters of the model were mostly related to the stand variables and/or tree distance-independent competition indexes. In order to avoid multicollinearity problems due to overparametrization of the model, only variables largely correlated with the estimated coefficients were included ([27]). After the model parameters have been expressed as a function of these variables, the model was finally refitted using the complete fitting data set, and the significance of coefficients assessed by asymptotic t-tests.
Heteroscedasticity was frequently detected by plotting the studentized residuals versus the predicted values for each tree variable. To overcome this problem, two alternative weight functions were tested. The weight functions were defined as (eqn. 2, eqn. 3):
where wij is the weight given to the observation, cwij is the predicted value of crown diameter and i, j are the plot and tree indexes, respectively. The selection of the weight function was made based on the Akaike’s information criterion (AIC) and MSE values obtained. The model obtained at this stage was designated as the fixed effects model.
The fixed effects model was finally refitted using a mixed model approach ([30]). Due to the nested structure of the data (trees inside plots), random effects associated to the plot were tested on each of the fixed model parameters using the SAS® macro NLINMIX ([34]), and resulted in three alternative mixed effects models, whose formulation differed in the parameter including the plot random effect. The selection of the best-fitting mixed-effect model was carried out based on the Akaike’s information criterion (AIC) and MSE values.
Evaluation of performance
The evaluation of the predictive performance of the models (model validation) was carried out using the independent validation data set on the following models: (i) the fixed-effect and (ii) the mixed-effect models developed in this study; (iii) the fixed-effect model proposed by Paulo et al. ([22]); and (iv) the mixed-effect model developed by Sánchez-González et al. ([32]). The model proposed by Paulo & Tomé ([23]) was not considered since its application is restricted to young trees.
The mixed effect model validation may be carried out considering the model population or subject specific response. The latter requires the measurements of the response variable (crown diameter) in a subsample of trees in the plot, a process called calibration procedure ([11], [19]). Since the models developed in this study were applied at data collected on forest inventories (where no measurements of tree crown diameter were made), the validation was carried out considering the population specific response. In this case, the mean responses were obtained with the fitted nonlinear mixed effects models by setting to zero the random effects. This allowed to test the usefulness of the inclusion of random parameters in the model in the case the calibration procedure was not applicable.
Model efficiency was calculated as the proportion of variation explained by the model (Ef - eqn. 4):
where ri is the residual for observation i; yi is the tree crown diameter for observation i, yÌÂ
is the mean value of the tree crown diameter from all the observations and n is the number of observations in the validation data set.
To evaluate the model bias, the mean value of residuals (Mr) was calculated as follows (eqn. 5):
and the mean of absolute residuals (Mar) was computed to evaluate the model precision (eqn. 6):
The 5th and 95th percentiles (p5 and p95) of the distribution of residuals were also computed. Models obtained from the application to the validation data set were also compared by plotting their predicted values in the same diagram in order to help assessing their predictive performances.
Analysis of stand stocking values Portuguese cork oak stands
To analyze pure cork oak stands stocking from IFN4 to IFN5, tree crown diameter was estimated for each tree in the inventory plots using the model selected based on the criteria mentioned above. The predicted tree crown diameters allowed to assess the stand crown cover, expressed as a percentage. For each of the IFN4 and IFN5 data sets, these values were grouped into classes with a 10% range. Due to the low frequency of stands with more than 50% of stand crown cover, all stands above this threshold were included in a single class. Using the IFN4 values as a reference, percent variation of each crown cover class was determined for the period 1996-2006 (IFN4 and IFN5).
The average stand crown cover of pure cork oak stands in Portugal was computed for the years 1996 and 2006. Crown cover mean values of the IFN4 and IFN5 plots were compared using a two-samples t-test. Equal variances of the two samples compared was verified by an F-test.
Results
Crown diameter model fitting
The full list of candidate models tested in this study is reported in Tab. S1 (Appendix 1). Models 1, 4 and 8 had the best goodness-of-fit statistics and achieved convergence for all plots (Tab. 2). Models 4 and 8 performed slightly better than model 1, and were therefore considered for the further analyses.
Tab. 2 - Fitting statistics obtained for candidate models 1, 4 and 8. Only the models for which convergence was achieved in all plots are shown.
| Model | SMSE | Adj-R² | MSE |
|---|---|---|---|
| 1 | 57.99 | 0.800 | 1.81 |
| 4 | 57.82 | 0.806 | 1.76 |
| 8 | 58.27 | 0.806 | 1.76 |
The strongest relationships for model parameters were found between dominant height (hdom) in model 4 (parameters b and c) and du_dug competition index (i.e., the ratio between tree diameter and stand quadratic mean diameter under cork) in model 8 (parameter b). In both models the parameter a, associated to the asymptote value, had the weakest relationship to any of the considered variables. As dominant height was not available in forest inventory data, model 8 (including the parameter b expressed as function of du_dug) was selected for the next stage. The fixed effects model was therefore defined as (eqn. 7):
Since the selected model includes three parameters, a total of three alternative mixed effects models were tested, each model including the random effect (ui) in one of the parameters a, b or c. The inclusion of a random effect to parameter c caused the model not to converge, as well as the inclusion of more than one random effect in the model. After comparison of the AIC values for the three alternative mixed effect models, the mixed model including a random parameter in the parameter b (ub) was selected. Hence, the random effect model was formulated as follows (eqn. 8):
Tab. 3 reports the parameter estimates and variance components for both fixed- and mixed-effect crown-diameter models.
Tab. 3 - Parameter estimates and variance components for the selected models.
| Stats | Param | Fixed Effects Model | Mixed Effects Model | ||||||
|---|---|---|---|---|---|---|---|---|---|
| Estimate | Pr>|t| | Lower | Upper | Estimate | Pr>|t| | Lower | Upper | ||
| Fixed Parameter | a | 28.5024 | <0.0001 | 27.2894 | 29.7155 | 25.1226 | <0.0001 | 24.0906 | 26.1546 |
| b 0 | 66.4364 | <0.0001 | 63.0029 | 69.8699 | 58.3459 | <0.0001 | 54.9818 | 61.71 | |
| b 1 | 4.2013 | <0.0001 | 3.7377 | 4.6649 | 3.4903 | <0.0001 | 2.7093 | 4.2713 | |
| c | 19.8168 | <0.0001 | 18.9521 | 20.6816 | 17.9188 | <0.0001 | 16.8642 | 18.9733 | |
| Variance of random effects | - | - | - | - | - | 28.0575 | - | 23.428 | 34.2169 |
| Residual variance | - | 0.06374 | - | 0.06221 | 0.06534 | 0.04992 | - | 0.0487 | 0.05119 |
Assessing predictive performances
Validation statistics were used for the comparison of the predictive performances of the fixed and random models developed here, as well as of the models proposed by Paulo et al. ([22]) and Sánchez-González et al. ([32]). The results of the validation step are presented in Tab. 4. The fixed effects model developed in this study presented very similar results to those obtained using the model by Sánchez-González et al. ([32]). Contrastingly, the model by Paulo et al. ([22]) showed the worst performances due to its linear formulation. Therefore, the fixed-effect model was selected for the analysis of cork oak stands stocking evolution.
Tab. 4 - Validation statistics for the fixed and random models compared in this study.
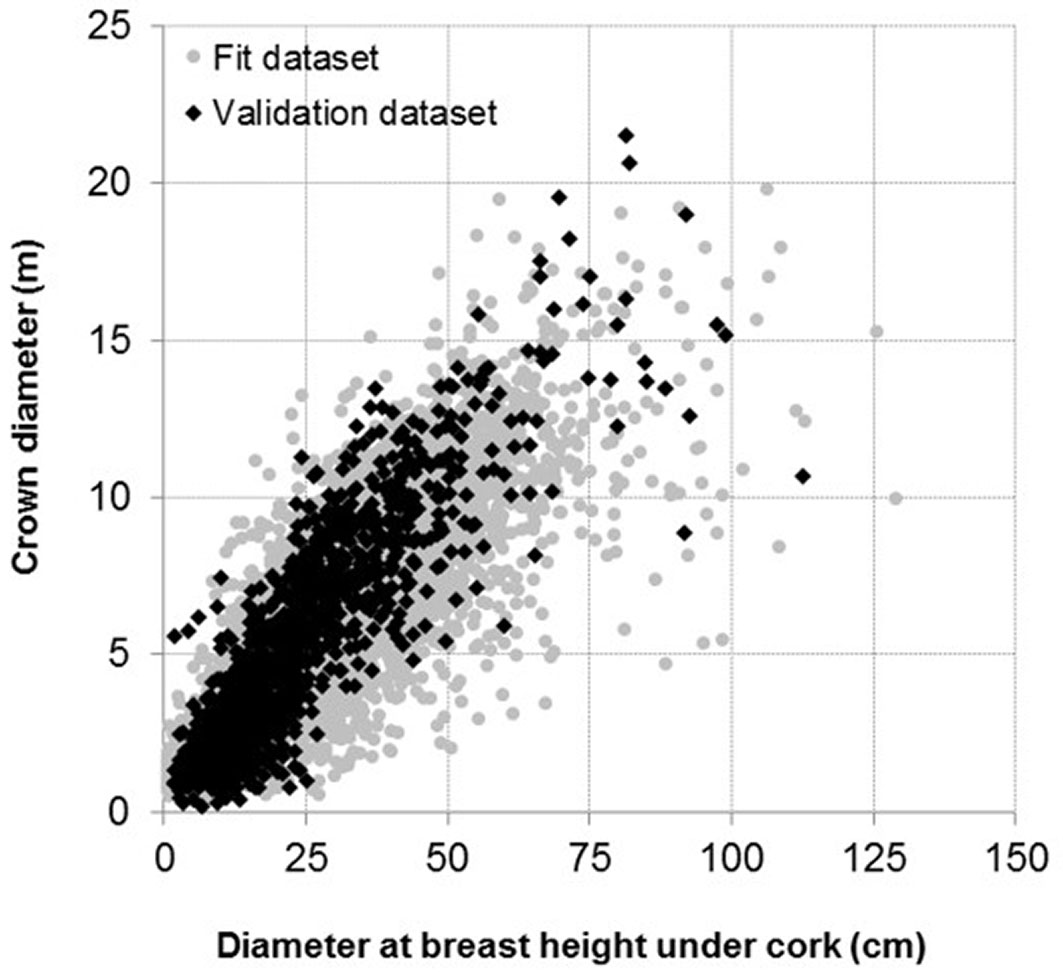
The results of the validation step carried out for the models considered in this analysis are displayed in Fig. 3, where pairwise comparisons of their predicted values are shown: (a) the Paulo et al. ([22]) model versus the Sánchez-González et al. ([32]) model (Fig. 3a); (b) the fixed- versus the random-effects model developed in this study (Fig. 3b); (c) the Sánchez-González et al. ([32]) versus the fixed effects model (Fig. 3c); and (d) the Sánchez-González et al. ([32]) versus the random effect model proposed in this analysis (Fig. 3d).
Fig. 3 - Crown diameter predictions using the validation data set. (a) The model by Paulo et al. ([22]) vs. the model by Sánchez-González et al. ([32]); (b) the fixed vs. the random effects models developed in this study; (c) the model by Sánchez-González et al. ([32]) vs. the fixed effects model developed in this study; (d) the model by Sánchez-González et al. ([32]) vs. the random effect model developed in this study.
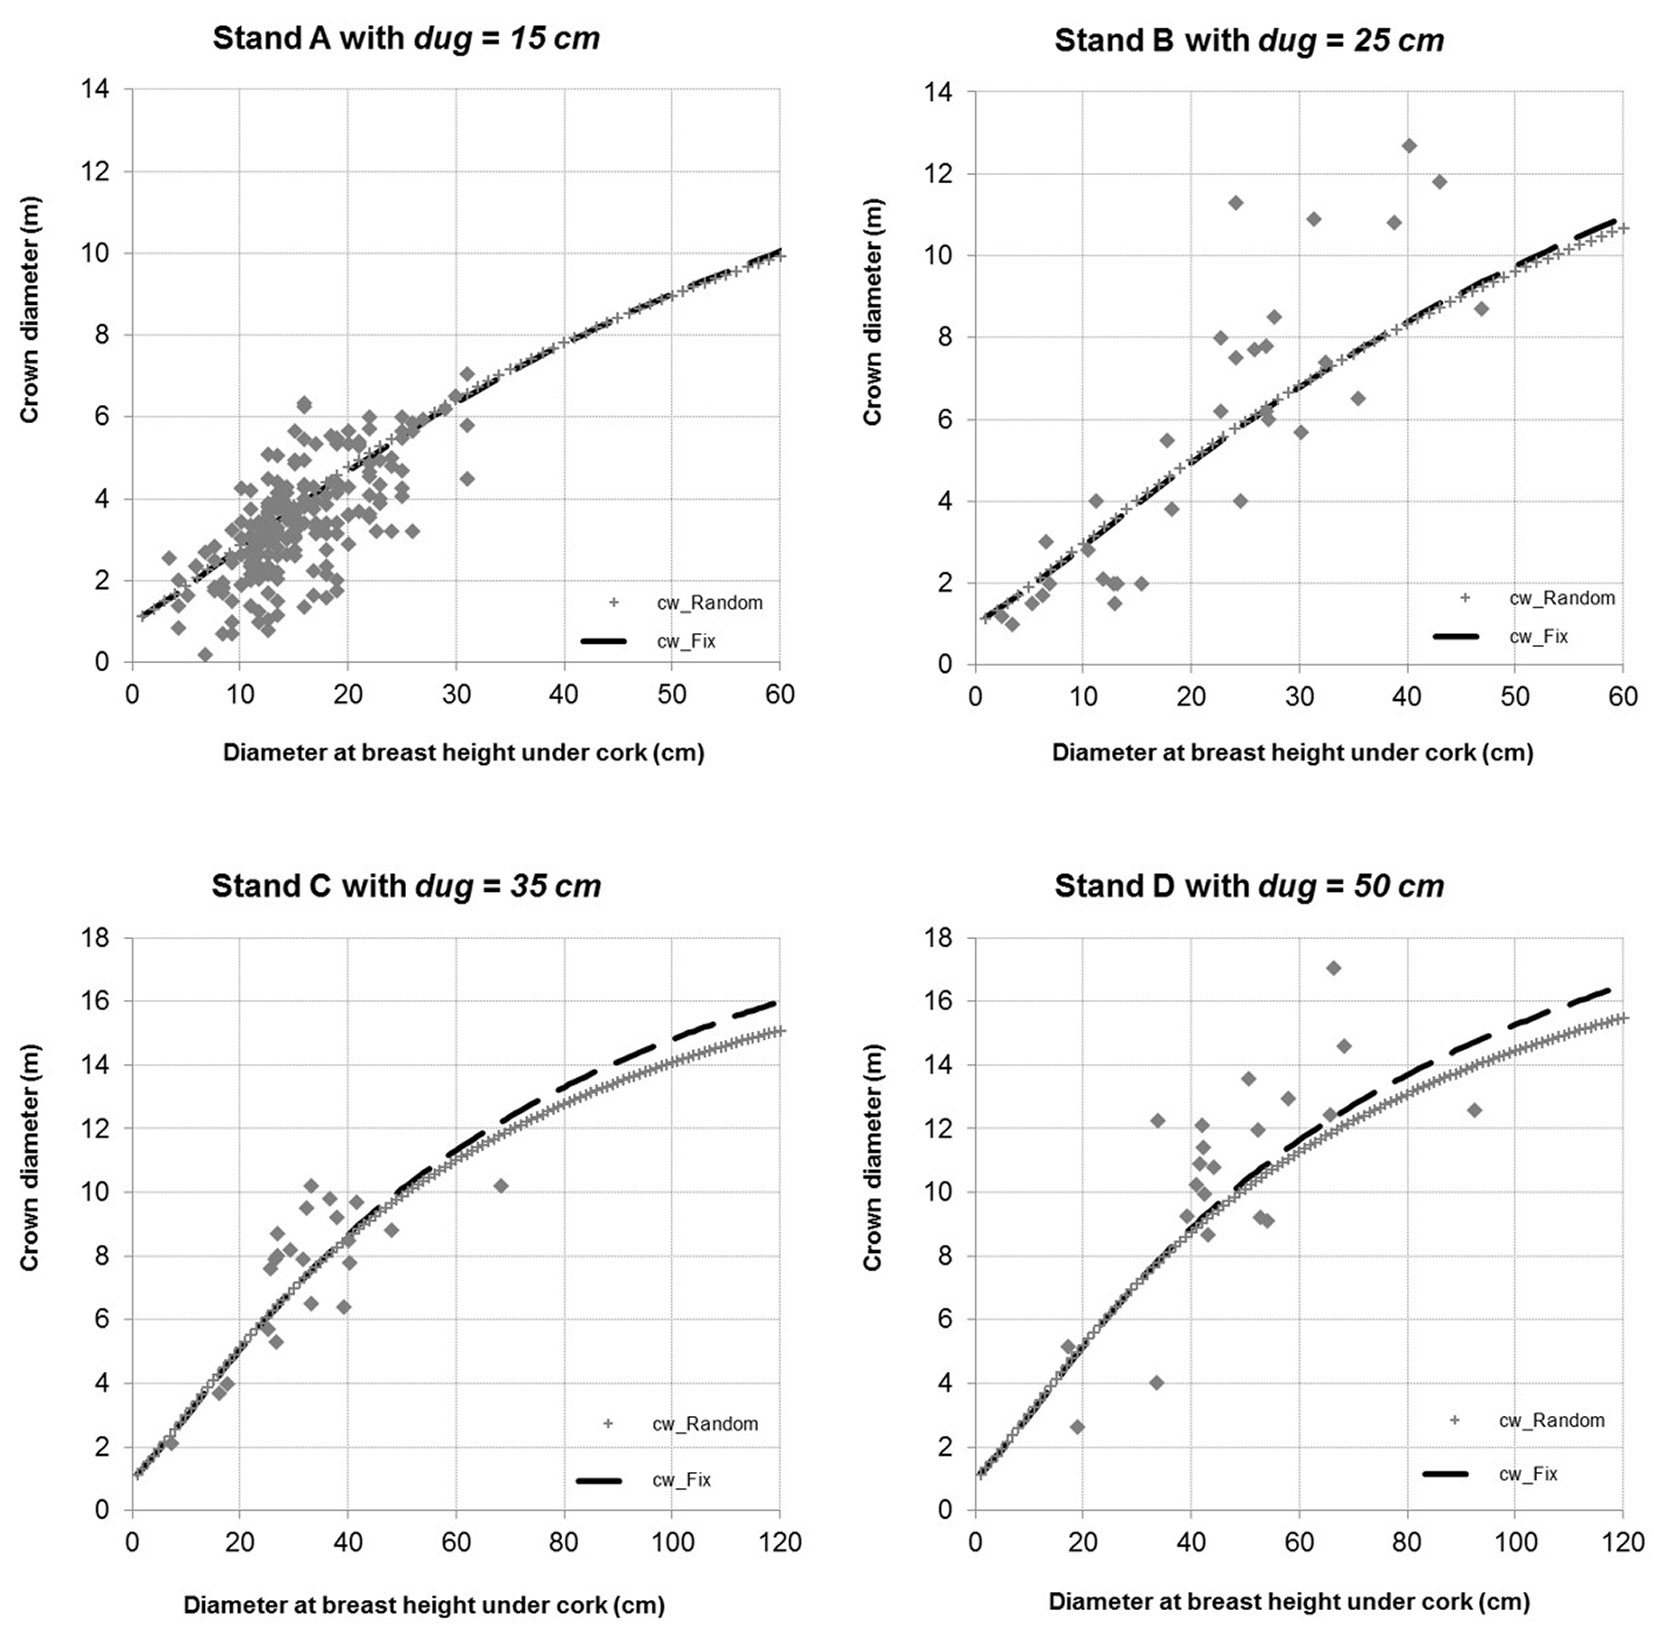
The results of the application of the fixed- and random-effect models on four stands from the validation data set are shown in Fig. 4. These stands were selected in order to better analyze the model performances over a wide range of quadratic mean diameters (15, 25, 35 and 50 cm, respectively).
Fig. 4 - Crown diameter predictions obtained by the fixed- and the mixed-effect models in four stands from the validation data set characterized by a wide range of quadratic mean diameters (15, 25, 35 and 50 cm, respectively).
volution of stand stocking values Portuguese cork oak
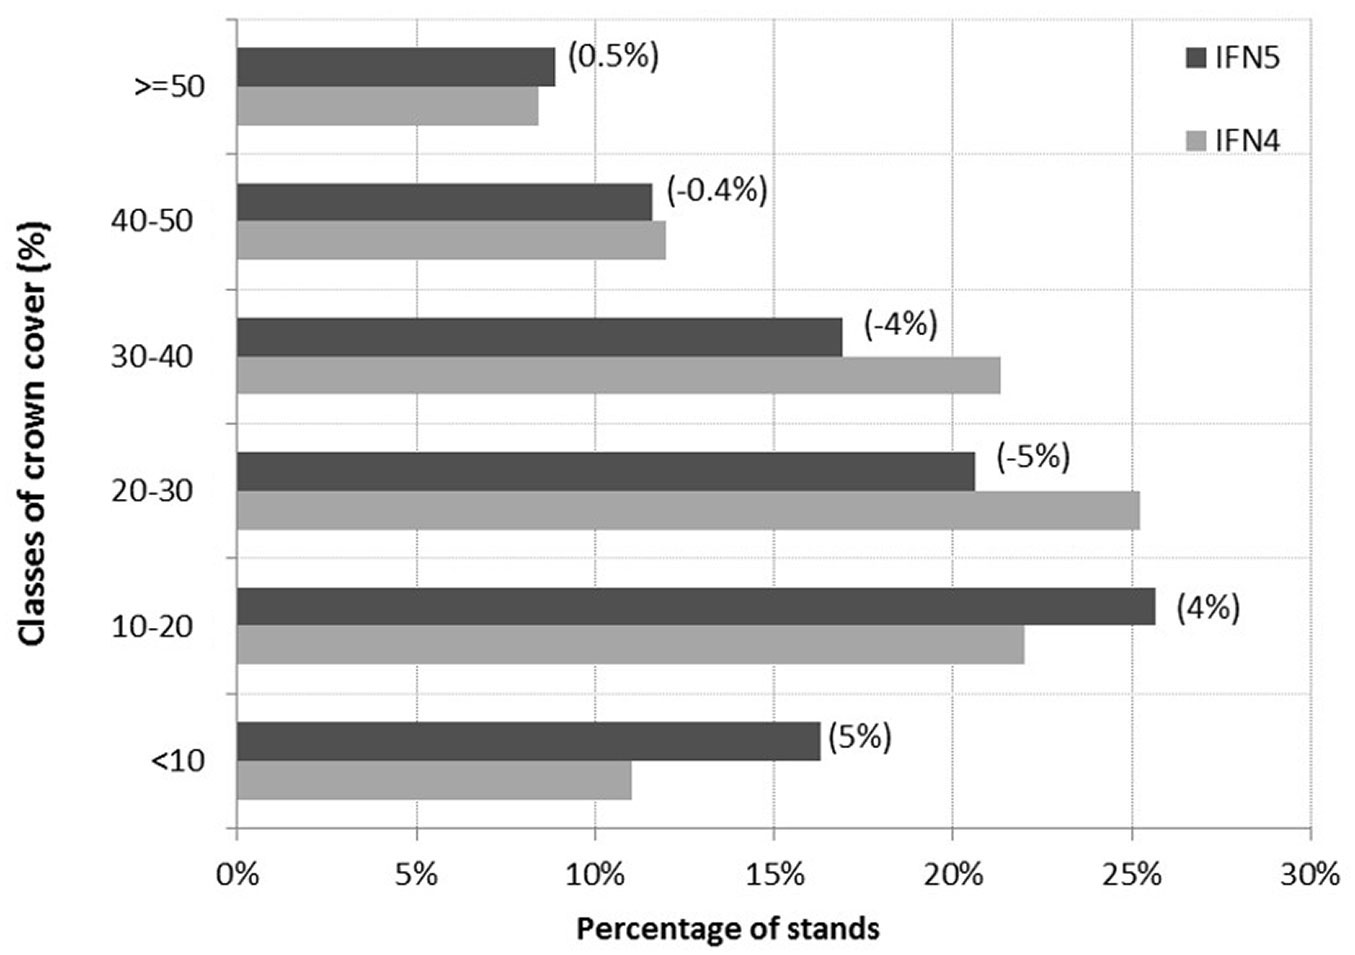
Average crown cover values of pure cork oak stands in Portugal were estimated to be 28.0% and 26.5% based on IFN4 and IFN5 data sets, respectively, resulting in a decrease of the average value by 1.5% in the period 1996-2006. Such difference was statistically significant after the application of the t-test (p<0.05). In addition, stands were grouped in 10% range classes of crown cover percentage, and for each class the difference in frequency between the IFN4 and the IFN5 was calculated (Fig. 5). The differences between IFN4 and IFN5 ranged from 0.4-0.5% for high crown cover classes (> 40%) up to 4-5% for lower crown cover classes (10-40%).
Discussion
Crown diameter
Although an asymptotic trend is expected in the relationship between diameter at breast height and tree crown diameter, several authors observed a linear relation between the two mentioned variables ([14], [8], [32], [23]). This was also the case in this study, where a large range of values of tree diameter at breast height and crown diameter were analyzed (dbh up to 128.9 cm and cw up to 21.5 m). The underlying reason seems related to the size of trees included in the available data sets, that were far from their potential maximum growth. For example, Goes ([13]) found monumental cork oak trees with dbh of 200 cm and more than 30 m crown radius, while Sánchez-González et al. ([32]) reported a largest tree with dbh of 124.80 cm and a crown diameter of 17.45 m. This support the hypothesis that the linear relationship between dbh and tree crown diameter observed in this study is due to the lack of old-growth, large trees in the available data sets.
Linear relationships are not considered suitable for the development of crown diameter models as they do not provide biological meaning for parameter values or predicted values ([3]). This is particularly important when models are applied to a large range of tree and stand values. In this study, model selection has been carried out by restricting the choice to models with formulations that can provide adequate behavior to this purpose.
Another important issue concerning tree variable modeling is related with the nested structure of the data (trees within plots). Taking this structure into account, a mixed model approach was used including random parameters at plot level. This approach is commonly used in different sectors of forest research, e.g., modeling tree variable relation ([1], [4], [27], [24]). Although the use of mixed models is suitable for the analysis of the data sets considered in this study, the computation of subject-specific responses is possible only when the predicted variable is measured in some individuals of the sample (trees inside plots). When these data are not available (as in our case), the calibration process is not carried out, the random effects are assumed to be zero, and a population average response can only be obtained. In nonlinear models, such as those applied for modeling tree crown diameter, population response estimates are not equal to estimates obtained with fixed effect models. This was demonstrated by Meng et al. ([18]), who showed that when the calibration process is not accomplished, the fixed effect models result in lower prediction errors than the population response estimates. Similar results were obtained by De-Miguel et al. ([9]). However, in order to enable the computation of the best predictions, results should include also the mixed-effect model parameters and the variance estimates when model calibration is possible ([9]).
In this study, a distance-dependent competition index (the ratio between the tree diameter and the quadratic mean diameter) was included in the formulation of the model. Such index is related to the hierarchical position of each tree within the stand ([3]). Similarly, Paulo & Tomé ([23]) and Sánchez-González et al. ([32]) also found the quadratic mean diameter to be the most significant stand variable in their models.
Model comparisons carried out in this study revealed that the predictive performances of the developed fixed-effect model were similar to those obtained using the model by Sánchez-González et al. ([32]). However, the absence of an asymptote value and the interception of the model made at when y=0, do not ensure a biological meaning to model predictions. The estimated value for the asymptote was 28.5 m for the fixed-effects model and 25.1 m for the random-effects model. The former value seems more suitable for the cork oak species, as compared with values obtained on monumental trees in Portugal ([13]), while the latter has to be considered too low. Furthermore, the model interception (corresponding to the tree crown value when total height reaches 1.3 m) was 1.00 m for the fixed effects model and 0.97 m for the random effects model. Both values are considered suitable for the species analyzed.
volution of stand stocking values for Portuguese cork oak stands
Crown cover percentage is traditionally one of the most important variables for the management of cork oak stands both in typical silvopastoral areas and in forest stands. Values recommended for management of these stands ([21], [20], [35]) are remarkably higher than the average value of 26.6% that currently characterizes Portuguese stands of cork oak, according to AFN ([2]). Based on the estimates obtained using the proposed model, an increase in frequency of lower crown cover classes (< 20%) and a decrease in frequency of higher crown cover classes (20% to 40%) was observed for cork oak stands in Portugal between 1996 and 2006. Since the area covered by cork oak stands in Portugal has not changed in the same period based on the available data ([10], [2], [16]), two main causes may be hypothesized to explain the aforementioned reduction in crown cover percentage, namely, an increase of the area of new cork oak plantations and a decrease of the stocking in adult stands.
The low stocking of adult stands may lead to a decrease in the potential value of cork production, an increase of landscape fragmentation ([7]), and a decrease in tree regeneration of stands ([5]). In the long term, if the current trend will last, a large area of cork oak stands might be compromised in terms of sustainability of cork production. These results call for the definition of supporting measures for the protection of stands and for the increase of stand density by natural or artificial tree regeneration, both in pure forest and silvopastoral areas.
Conclusion
Forest inventories provide important data sets for stands characterization. However, tree crown diameter is frequently not measured in forest inventories, since it is time-consuming and cost expensive. Generalized crown diameter models allow to predict and evaluate crown cover, a relevant stand variable for cork oak stands management.
In this study, two generalized crown diameter models were developed, including a competition index that takes into account the effect of the position of trees in the stand structure on their crown diameter. Model evaluation, model characteristics and parameter estimation values highlighted that the fixed-effect model should be used when measurements of crown diameter are not available for the calibration procedure, while the mixed-effect model should be chosen when model calibration is feasible.
The fixed effects model was applied to data from the two last Portuguese forest inventory data in order to assess changes of crown cover values in the period 1996-2006. Results showed a decrease in crown cover values of Portuguese cork oak stands, increasing the frequency of stands with less than 20% crown cover and decreasing the frequency of stands with 20% to 40% crown cover percentage. Average crown cover also decreased from 28.0% to 26.5% in the same period. These results highlight the constraints that may affect the sustainability of cork production in some stands in Portugal.
Acknowledgements
This research was supported by the projects “StarTree” (Grant agreement 311919) and “AgForward” (Grant agreement 6135 20) financed by the European Commission under the 7th Framework Program for Research and Technological Development, and by the Fundação para a Ciência e Tecnologia (Portugal) under project “Cork carbon footprint: from trees to products” (PTDC/AGR-FOR/4360/2012).
Joana A. Paulo carried out this work under the contract SFRH/BPD/96475/2013, and Sónia P Faias under the contract PD/ BD/52695/2014, both financed by the Fundação para a Ciência e Tecnologia (Portugal).
The authors acknowledge the Instituto para a Conservação da Natureza e das Florestas (ICNF, formerly AFN) for allowing the use of data from two National Forest Inventories. Authors also acknowledge Dr. Dean Meason for English and manuscript revision.
References
Gscholar
Gscholar
Gscholar
Gscholar
Gscholar
Online | Gscholar
Gscholar
Gscholar
Gscholar
Gscholar
Online | Gscholar
Gscholar
Gscholar
Gscholar
Gscholar
Online | Gscholar
Supplementary Material
Authors’ Info
Authors’ Affiliation
Sónia P Faias
Célia Ventura-Giroux
Margarida Tomé
Universidade de Lisboa, Instituto Superior de Agronomia, Centro de Estudos Florestais, Forest Ecosystem Management under Global Change research group (ForChange), Tapada da Ajuda, 1349-017 Lisbon (Portugal)
Corresponding author
Paper Info
Citation
Paulo JA, Faias SP, Ventura-Giroux C, Tomé M (2015). Estimation of stand crown cover using a generalized crown diameter model: application for the analysis of Portuguese cork oak stands stocking evolution. iForest 9: 437-444. - doi: 10.3832/ifor1624-008
Academic Editor
Rupert Seidl
Paper history
Received: Feb 27, 2015
Accepted: Jul 28, 2015
First online: Dec 02, 2015
Publication Date: Jun 01, 2016
Publication Time: 4.23 months
Copyright Information
© SISEF - The Italian Society of Silviculture and Forest Ecology 2015
Open Access
This article is distributed under the terms of the Creative Commons Attribution-Non Commercial 4.0 International (https://creativecommons.org/licenses/by-nc/4.0/), which permits unrestricted use, distribution, and reproduction in any medium, provided you give appropriate credit to the original author(s) and the source, provide a link to the Creative Commons license, and indicate if changes were made.

Web Metrics
Breakdown by View Type
Article Usage
Total Article Views: 56603
(from publication date up to now)
Breakdown by View Type
HTML Page Views: 46903
Abstract Page Views: 3721
PDF Downloads: 4470
Citation/Reference Downloads: 26
XML Downloads: 1483
Web Metrics
Days since publication: 3818
Overall contacts: 56603
Avg. contacts per week: 103.78
Article Citations
Article citations are based on data periodically collected from the Clarivate Web of Science web site
(last update: Mar 2025)
Total number of cites (since 2016): 11
Average cites per year: 1.10
Publication Metrics
by Dimensions ©
Articles citing this article
List of the papers citing this article based on CrossRef Cited-by.
Related Contents
iForest Similar Articles
Research Articles
Nonlinear mixed model approaches to estimating merchantable bole volume for Pinus occidentalis
vol. 5, pp. 247-254 (online: 24 October 2012)
Research Articles
The use of tree crown variables in over-bark diameter and volume prediction models
vol. 7, pp. 132-139 (online: 13 January 2014)
Research Articles
Modeling stand mortality using Poisson mixture models with mixed-effects
vol. 8, pp. 333-338 (online: 05 September 2014)
Research Articles
Height-diameter models for maritime pine in Portugal: a comparison of basic, generalized and mixed-effects models
vol. 9, pp. 72-78 (online: 11 June 2015)
Research Articles
Modeling compatible taper and stem volume of pure Scots pine stands in Northeastern Turkey
vol. 16, pp. 38-46 (online: 22 January 2023)
Research Articles
Total tree height predictions via parametric and artificial neural network modeling approaches
vol. 15, pp. 95-105 (online: 21 March 2022)
Research Articles
Compatible taper-volume models of Quercus variabilis Blume forests in north China
vol. 10, pp. 567-575 (online: 08 May 2017)
Research Articles
Relationship between tree growth and physical dimensions of Fagus sylvatica crowns assessed from terrestrial laser scanning
vol. 8, pp. 735-742 (online: 11 June 2015)
Review Papers
Integration of forest mapping and inventory to support forest management
vol. 3, pp. 59-64 (online: 17 May 2010)
Research Articles
Tree biomass models for the entire production cycle of Quercus suber
vol. 18, pp. 38-44 (online: 28 February 2025)
iForest Database Search
Google Scholar Search
Citing Articles
Search By Author
Search By Keywords


