Relationship between tree growth and physical dimensions of Fagus sylvatica crowns assessed from terrestrial laser scanning
iForest - Biogeosciences and Forestry, Volume 8, Issue 6, Pages 735-742 (2015)
doi: https://doi.org/10.3832/ifor1566-008
Published: Jun 11, 2015 - Copyright © 2015 SISEF
Research Articles
Abstract
Measurements of physical tree crown dimensions were of subjective character in the past, even though they can be considered important for the management of many silvicultural operations, such as timing of thinning operations. In our study we investigated if and how measures of physical crown dimensions of trees differed when quantified conventionally versus based on 3D-terrestrial laser scanning and how they are related to basal area increment. Some 24 randomly selected predominant or dominant beech trees between 90 and 110 yrs of age and of varying height were used as study trees. We hypothesized that tree crown dimensions obtained from scans are more closely related to tree radial growth than those obtained from conventional field measurements. It was found that from a variety of compared crown size characteristics the scan-based tree attributes mean crown radius, maximum area of the crown and crown projection area were most closely related to individual tree growth. We conclude that the horizontal extension of a tree crown in general is to be considered one of the most important drivers of tree growth. We also conclude that terrestrial laser scanning is a powerful tool to reliably measure physical crown dimensions and TLS-based measurements are more reliable than conventional ones.
Keywords
Tree Geometry, Crown Structure, Crown Surface Area, Basal Area Increment
Introduction
More than 200 years of silviculture provided knowledge on how a forest stand should be managed to produce wood sustainably. This knowledge is based on fundamental relationships, such as between tree crown size and diameter increment, indicating the importance of canopy structure for tree and stand productivity ([10]). However, not only biomass production but also other forest ecosystem services and functions, for instance habitat suitability, do very much depend on structural properties of trees and hence on management-related changes of tree and forest structure ([25], [16], [39]). Understanding the interplay between forest management and the resulting tree habitus or growth is crucial for an effective and goal-orientated forest management ([33], [2]). As tree crown size is closely related to light absorption and productivity ([4]) reliable estimations of tree crown dimensions are essential for any kind of tree growth modeling. Recent research has revealed that crown size, beside species, tree size and site fertility, is determined by neighborhood density and identity ([30], [10], [24]). For a quantification of the impact of these factors an estimation of the overall tree dimensions, especially of crown size, is required and should be as precise as possible.
Three main characteristics of trees have hindered a detailed acquisition of their geometry so far: (i) the sheer complexity and overall size ([35]); (ii) the dynamic as living organism ([1]); and (iii) the long lifespan ([31]). Therefore, easily accessible attributes of sheer tree size belonged to the most often used data source in forest research of the past. Probably the most important two measures are diameter at breast height (DBH) and total tree height. The combined use of two or more such attributes to predict tree characteristics that are more difficult (or even impossible) to measure is common practice in forest science. Examples are characteristics such as leaf area, crown surface area ([21], [24]) or tree biomass ([19]).
For a very long time instruments specifically developed to measure a tree’s structural attributes were used in forest inventories, such as the Blume-Leiss altimeter for measuring tree height or Wheeler’s pentaprism for the determination of upper diameters, to name only two. Several books reviewed the available instruments and the range of possible applications ([38]). Many of these instruments were constantly improved to be more precise, more objective or simply more efficient. The utilization of laser technology (light amplification through stimulated emission of radiation - abbr.: “laser”) is one of these current improvements. Today, laser technology is implemented in range finders that include functions to measure tree height as well as in laser scanners.
Three-dimensional (3D) terrestrial laser scanning is a technology with proven potential for deriving aboveground tree structural attributes. A comprehensive overview of its various applications is given in Maas ([23]) and Dassot et al. ([8]). Especially, terrestrial laser scanning (TLS) has been demonstrated as a very effective tool in measuring tree/stand properties not directly measurable which are of interest in forest research, such as crown displacement ([36]), competition among trees ([24]), leaf area distributions ([3]) or crown volume and surface ([24]). Furthermore, a detailed assessment of branch dimensions became possible by means of 3D-TLS ([5], [9]).
Here we hypothesize that high resolution spatial information on tree geometry obtained from 3D-TLS also increases the accuracy of measures of tree morphology, which in turn improve models that relate tree morphology to tree growth. While manifold applications of TLS in forest research have been successfully tested, the use of comprehensive 3D-data from TLS-based measurements of tree crowns is still in an early stage. Tree crowns have mostly been scanned to measure gap fraction or canopy cover (see the review by [8]). Comparisons with conventional forest inventory measurements focusing on crowns have been rare. Fleck et al. ([13], [14]) showed that conventional eight-point crown projections with fixed angles to capture a tree’s horizontal crown extension differed substantially from crown projection areas obtained from TLS measurements. However, no further analysis was made, for example by relating the crown projection areas to tree growth. We conclude that the potential to explore physical tree dimensions by means of TLS is not yet fully exploited and further research in this field could contribute to our understanding of geometry-related processes that take place at all three dimensions of a forest, with growth being an important example.
In this paper we investigated if and how measures of tree size differ when quantified conventionally vs. TLS-based. We hypothesized that tree attributes calculated using measurements of tree crown dimensions obtained from TLS are more closely related to tree growth than those obtained from conventional field measurements. Specifically, we compared TLS-derived values of the mean crown radius (CRmean) as a surrogate for the complex geometric measure of crown surface area (CSA). CSA has successfully been used as an estimator of tree growth performance in the past ([21]).
Methods
Study site and study objects
Our study trees were located in the municipality forest of Lübeck, northern Germany, and were distributed over two different unmanaged forested areas named Hevenbruch (53° 38′ 41″ N, 10° 32′ 53″ E) and Schattiner Zuschlag (53° 46′ 49″ N, 10° 47′ 57″ E). The forests are dominated by oak (Quercus robus L. and Quercus petraea [Muttuschka] Liebl.) and beech (Fagus sylvatica L.), which contribute to about 45% of the total number of stems, according to forest inventory data of 2004. We randomly selected 24 predominant or dominant beech trees between 90 and 110 yrs in age and of varying height (mean: 32.9 m, standard deviation - SD: 5.12 m; measured in 2013) and DBH (mean: 53.48 cm, SD: 13.23 cm; measured in 2013). The stands have not been subject to any tree removals by harvests for at least 20 years and are fully stocked (stocking level: Schattiner Zuschlag = 1.38; Hevenbruch = 1.19).
Conventional forest inventory
DBH of all trees was measured in 2007 and in 2013 using a diameter tape. Tree growth was determined as basal area increment (BAI) between 2007 and 2013. Additionally, in 2013 we determined total tree height (TTH) and crown base height (CBH - lower-most branch of the live crown) using a Vertex (Haglof Inc., Madison, USA) and crown radius using a crown mirror (densiometer). The edge of the crown at its largest and shortest extension and at four cardinal azimuthal directions (North, East, South and West) was determined and the distance to the stem base was obtained from a standard measuring tape. The quadratic mean (CRmean) was then calculated based on the six measurements and used to determine the crown projection area (CPA) based on the formula of the area of the circle (CPA = π · CR2mean). CSA was calculated as the sum of the area of the crown exposed to sunlight (CSAsun) and the shaded part of the crown (CSAshade). CSAsun was calculated based on a standard crown shape model using the formula of the surface of a paraboloid, in accordance to Dong & Kramer ([11] - eqn. 1):
where CLsun is the length of the crown exposed to sunlight. Based on the extensive dataset on beech trees presented by Pretzsch et al. ([28]) and Pretzsch ([26], [27]), these authors created a widely used beech crown shape model in which CLsun was set to 0.4 · CL (standard crown shape model). We used this model for our analysis. CL was given as difference between TTH and CBH. The area of the shaded surface of the crown (CSAshade) was determined as the lateral surface of a frustum (eqn. 2):
with m describing the slant height of the frustum and CRCBH being the diameter of the crown at CBH (0.33 · CRmean, according to [31] - beech standard crown shape model). Consequently, the height of the maximal horizontal crown extension (Hmaxarea) in this standard model is assumed to be located at the base of the sun crown ([24] - eqn. 3):
The standard crown shape model also assumes that the area of maximum horizontal crown extension is always equal to the crown projection area. This is due to the perfect circularity of the paraboloid (sun-exposed crown) and frustum (shaded crown) that are used in the crown shape model. The interested reader is referred to Metz et al. ([24]) for an optical comparison of the simple crown shape model and laser derived (more realistic) tree shapes of beech trees. In reality, it is certainly possible that a tree does have its maximum horizontal crown extension in a height which is different from the transition between sun-exposed and shaded crown. However, detecting Hmaxarea is impossible based on conventional field measurements because the vertical dimension is not considered during crown delineations with a crown mirror. Our data enables for a comparison of values obtained from the literature (Hmaxarea) with those obtained from TLS-data, in which the vertical dimension was taken into account (see below).
Terrestrial laser scanning
Terrestrial laser scans were made in March 2013 (leaf-off conditions) using the Z+F Imager 5006 (Zoller and Fröhlich GmbH, Wangen, Germany) in order to minimize obstruction effects in the crown caused by leaves. The Imager 5006 is a phase-based 3D-terrestrial laser scanner operating with laser light of a wavelength between 650-690 nm. We used a field of view of 310° in vertical and 360° in horizontal direction, scanned with an angular step width of 0.036° (10 000 point per 360°; point spacing of 6.3 mm at 10 m from the scanner). The maximum range of the instrument (ambiguity interval) was given as 79 m. The scanner was moved to the field sites and mounted on a tripod at breast height (~1.3 m). At each site a first scan (the so called master scan) was made in the vicinity of the tree of interest. Multiple scans were then consecutively made around the tree. Artificial reference targets (checkerboards) distributed in the scanned forest scenes enabled the co-registration of the scans. This kind of scan design with flexible scan position was successfully used in other studies and provided reliable measurements of tree attributes in the past ([36], [24]), even though obstruction effects may still exists in the data to a certain extent.
Data processing
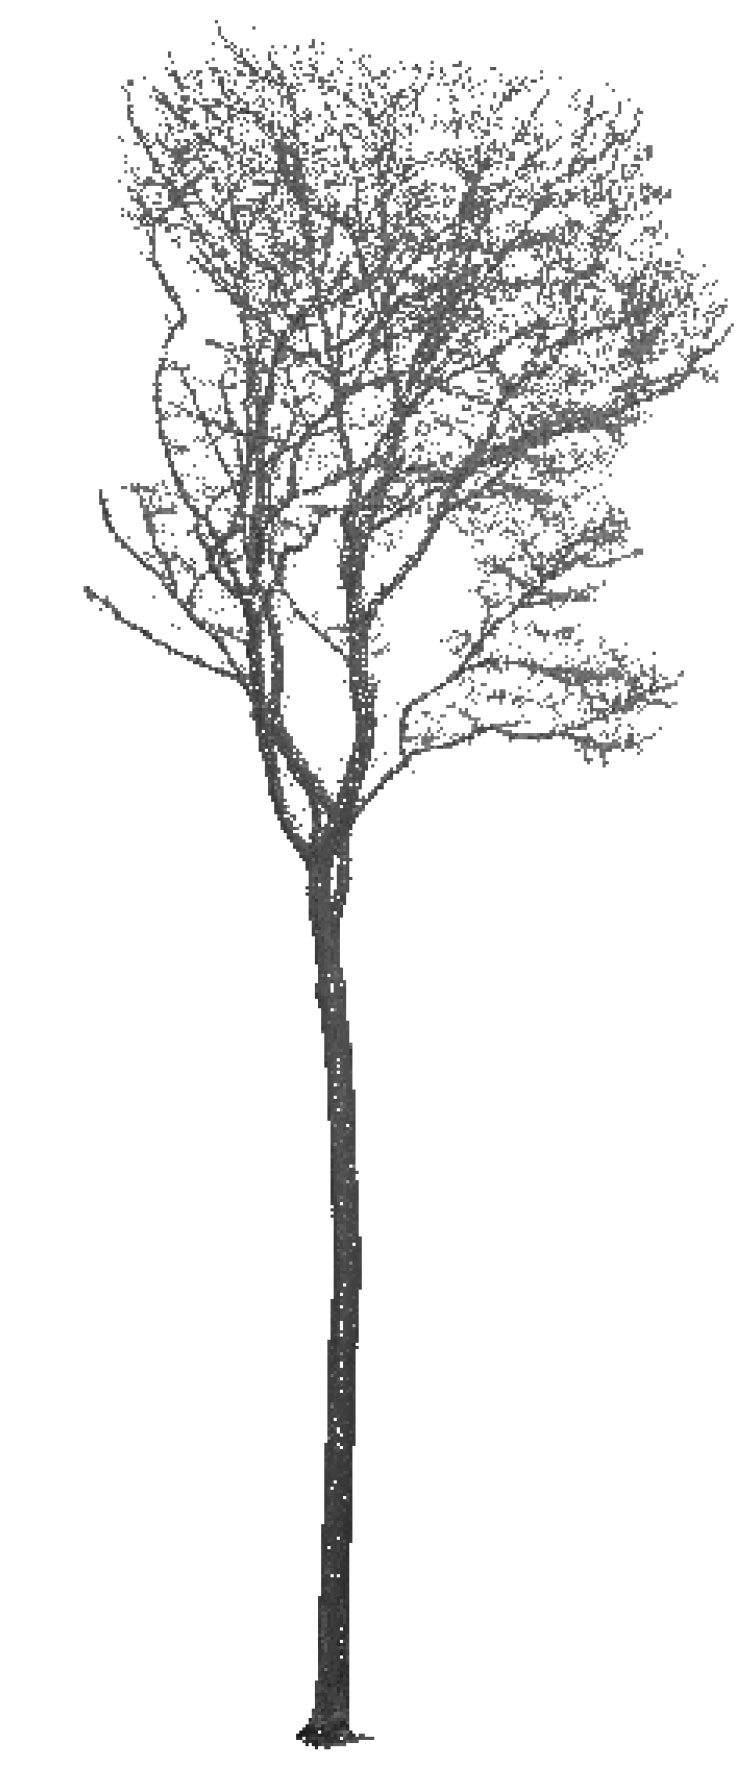
The scan data of each scan session made at a study tree was semi-automatically registered based on the artificial targets, filtered and exported as a single pts file (point cloud data) according to Seidel et al. ([37]) using the ZF Laser Control software (Zoller and Fröhlich GmbH, Wangen, Germany). Pts files were used in Cyclone 6 (Leica Geosystems, Heerbrugg, Switzerland) to manually select each tree from the point cloud data, as described by Seidel et al. ([36]). To our knowledge, there is no alternative automated procedure available that performs tree separation for adult trees in dense forest stands with greater accuracy than the manual procedure ([24]). At this stage of the post-processing, all study trees are available with individual three-dimensional descriptions of their habitus based on a point cloud with sub-centimeter resolution. The data was transformed to xyz files (Fig. 1 for visualization) which were then used as inputs for an algorithm implemented in the computational software program Mathematica® (Wolfram Research Inc., Champaign, USA).
Fig. 1 - Exemplary two-dimensional representation of the point cloud of a beech tree (32 m in height).
Calculation of tree structural properties
Using the above algorithm, several physical attributes were calculated using a fully automatic procedure from the xyz files of all study tree individuals. Diameter at breast height (DBHTLS), total tree height (TTHTLS) and maximum area of the crown as measured in a certain height stratum (MaxareaTLS) were calculated as described in Seidel et al. ([36]). In addition, we derived crown base height (CBHTLS), crown volume (CVTLS) and height of the maximum crown extension (HmaxareaTLS) as described in Metz et al. ([24]). Crown surface area (CSATLS) was calculated according to eqn. 1 and eqn. 2, but this time based on the TLS derived input variables. Crown length (CLTLS) was calculated in the same way as for the conventional field data (TTHTLS-CBHTLS). Crown projection area (CPATLS) was derived from the convex hull of the tree crown by projecting all crown height sections to the ground and calculating their combined area. Thereby, we used a 10-cm voxel model of the tree crown (only voxels above CBHTLS). Finally, two versions of the mean crown radius were derived from the TLS-data. First, we calculated CRmeanTLS based on the mean of 360 virtual measurements of crown radius, one in each azimuth direction in steps of one degree, using the stem base point as starting point and calculating the horizontal distance to the edge of the crown in the voxel model (outermost part of the crown). Secondly, we conducted a simulation of the field measurement scheme with four cardinal directions (North, West, South and East) plus the longest and shortest radius. This measurement scheme was then virtually rotated around the vertical axes in 89 steps of one degree, resulting in 90 readings of CRmean, hereafter referred to as CRmeanTLSrotated. All these measurements were based on the trees’ voxel models (10 × 10 × 10 cm) obtained from scanning. Tab. 1 summarizes the structural attributes used in our study.
Tab. 1 - Structural attributes used in the present study. [ ] = Parameters not specifically mentioned in the text but needed to calculate CSATLS.
| Conventional measurement | TLS-based measurement | ||
|---|---|---|---|
| Param. | Measurement description | Param. | Measurement description |
DBH
|
Tape; stem circumference at 1.3m above ground | DBH TLS |
QR-decomposition procedure to fit a circle to all points at 1.3 m above ground (see [36]) |
TTH
|
Vertex; highest point of the tree |
TTH TLS |
Vertical distance between highest and lowest point of the point cloud |
CBH
|
Vertex; height of the lowermost live-branch | CBH TLS |
See Metz et al. ([24]) |
CR mean |
Densiometer; mean of six distance measurements (N, W, S, E, longest, shortest) from stem base to crown edge | CR meanTLS |
Mean of the horizontal distances between stem base and crown edge in 360 directions |
CPA
|
π · CRmean² |
CPA TLS |
Projected area of the convex hull of the crown (on the ground) |
CL
|
TTH - CBH |
CL TLS |
TTHTLS - CBHTLS |
CR CBH |
0.33 · CRmean(according to [31]) |
[CRCBHTLS] |
0.33 · CRmeanTLS (according to [31]) |
CL sun |
0.4 · CL (according to [26]) |
[CLsun] |
0.4 · CLTLS (according to [26]) |
CSA sun |
See eqn. 1 | [CSAsunTLS] |
See eqn. 1 (but with TLS input parameters) |
CSA shade |
(CRmean+ CRCBH) · π · m; with m describing the slant height of the frustum |
[CSAshadeTLS] |
(CRmeanTLS+ CRCBH) · π · m; with m describing the slant height of the frustum |
CSA
|
Sum of CSAshade and CSAsun |
CSA TLS |
Sum of CSAshadeTLS and CSAsunTLS |
H maxarea |
TTH - (0.4 · CL) (according to [26], [31]) |
H maxareaTLS |
Height of the polygon used for MaxAreaTLS (see [36]) |
| - | - | CV TLS |
See [24] |
| - | - | Max AreaTLS |
Area of the largest crown layer polygon (10-cm layers - see [36]) |
| - | - | CR meanTLSrotated |
Mean of 89 rotations around the vertical axis for a virtual CRmean measurement (based on horizontal distance between stem base and crown edge) |
Acquiring all information on a target tree with the terrestrial laser scanning took about 45 minutes in the field plus additional 60 minutes for the post-processing, with the manual tree extraction from the point cloud taking most of the time (approx. 20-30 min per tree). The calculation of all tree structural attributes in Mathematica® took no more than 2-3 min per tree.
Statistics
In order to compare the results obtained from the conventional field measurements with TLS-based information, we performed correlation analyses based on linear regressions using the statistical software R (Vers. 3.0.0. - R Development Core Team). We waived using one of the two methods (scan or conventional measurement) as reference. Instead, we decided to focus on the strength of the relationship between measurements and preceding tree growth. The retrospective approach was used to ensure comparability among the approaches as TLS was unavailable in the 2007 inventory. We compared different competing linear models of tree growth, here expressed as 5-yrs increment in the trees’ basal area (BAI - 2007-2013), based on the Akaike Information Criterion (AICc) according to Burnham & Anderson ([7]). In the models tree growth was related to a single tree structural attribute or an interaction of two. In case of the traditional field inventory data, we only used data of 2013 in order to allow comparability with TLS data of the same year.
Results
Comparison of TTH and DBH values calculated from the TLS-approach with those obtained from traditional field instruments (vertex and tape) yielded high coefficients of determination (Fig. 2). In case of DBH, the results showed marginal differences and the linear regression of the measurements obtained from the two approaches was almost identical to the 1:1 line. A mean absolute difference (|DBH-DBHTLS|) of 0.5 cm was found for the TLS measurements.
Fig. 2 - (Left): Relationship between the DBH of a tree measured by a conventional tape method and DBH determined via TLS. (Right): Relationship between the TTH obtained from vertex measurements and TTH derived from TLS. The 1:1 ratio is represented by the dashed line.
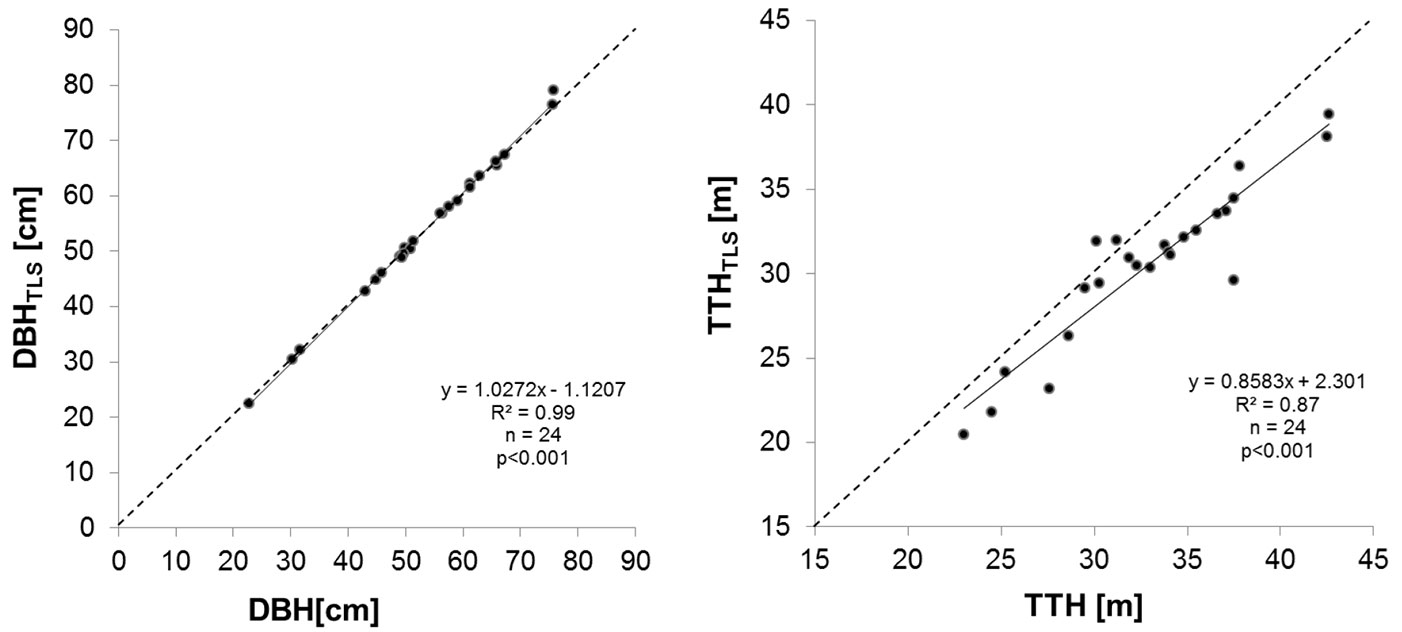
For the vertex measurements of TTH we obtained larger differences to the scanned data, with a mean difference of 2.4 m between the two approaches (TTH-TTHTLS). The mean absolute difference was 2.6 m.
The coefficient of determination for the relationship between vertex-based and TLS-based measurements of CBH was 0.7 and the linear regression was statistically significant with p<0.001 (Fig. 3, left panel). The mean absolute difference between measurements of the two approaches (|CBH-CBHTLS|) was 2.8 m. This is not surprising taking into account that different definitions of CBH were used, with one being strictly mathematical (CBHTLS as presented in [24]) and the other one (CBH) being a field operator’s estimate using the Vertex.
Fig. 3 - (Left): Relationship between the CBH of a tree measured with the vertex instrument and CBH determined mathematically from TLS-data. (Right): Relationship between the CL of a tree derived from the information on TTH and CBH measured with conventional vertex method and CL-values calculated via TLS.
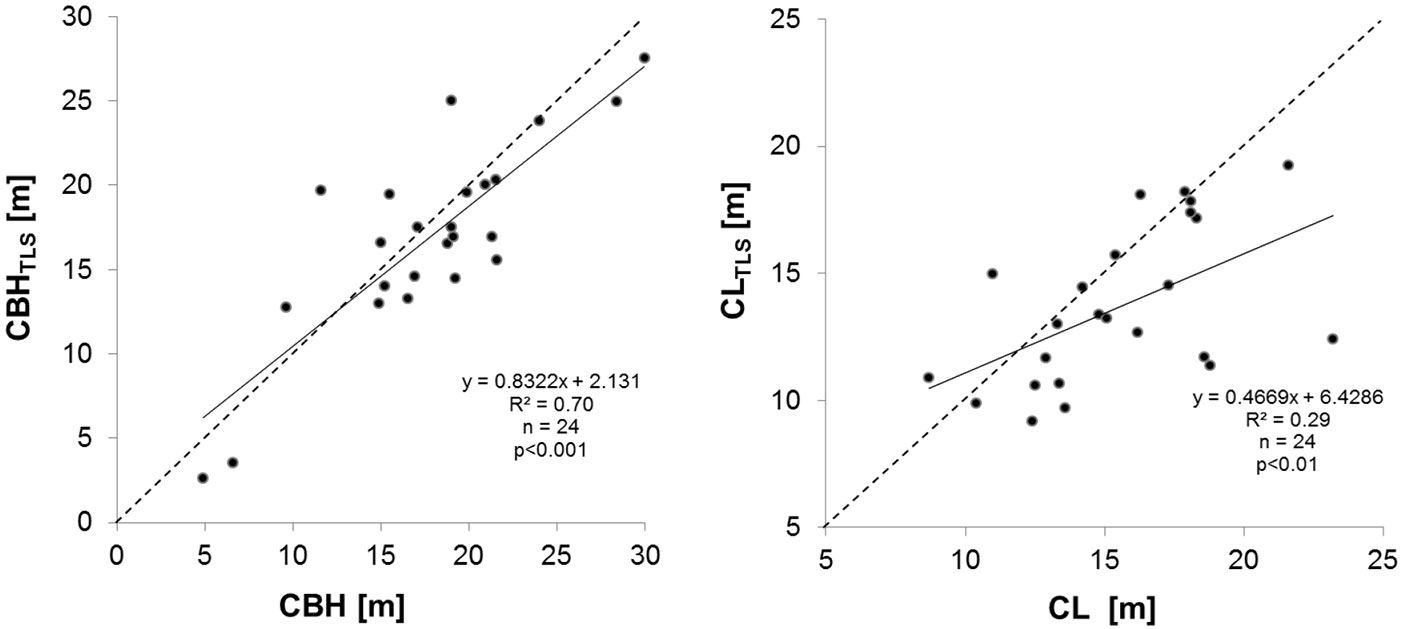
CL was derived from TTH and CBH and hence differences in CL were directly dependent on the accordance or discrepancy of these two attributes. A significant linear regression (p<0.01) with a very low coefficient of determination (R²=0.29) was found for the relationship between the values obtained from the two different methods. The TLS-based approach resulted in much lower estimates of CL when compared to the conventional data, especially for crowns with a large vertical extension (Fig. 3 right). Absolute differences between the two approaches reached up to 10 m.
Interestingly, we found a clear tendency towards lower height of maximum crown extension when based on scans (HmaxareaTLS) compared to the geometrical crown shape model (Hmaxarea) (Fig. 4, left panel). Mean absolute difference between the two approaches was 3.0 m and the relationship between both variables was statistically significant (p<0.001) using a linear regression (R²=0.78).
Fig. 4 - (Left): Relationship between Hmaxarea obtained with literature-based ratios of sun-exposed to shaded portions of the crown and TLS-based measurements. (Right): Relationship between CRmean and CRmeanTLS. The 1:1 ratio is represented by the dashed line.
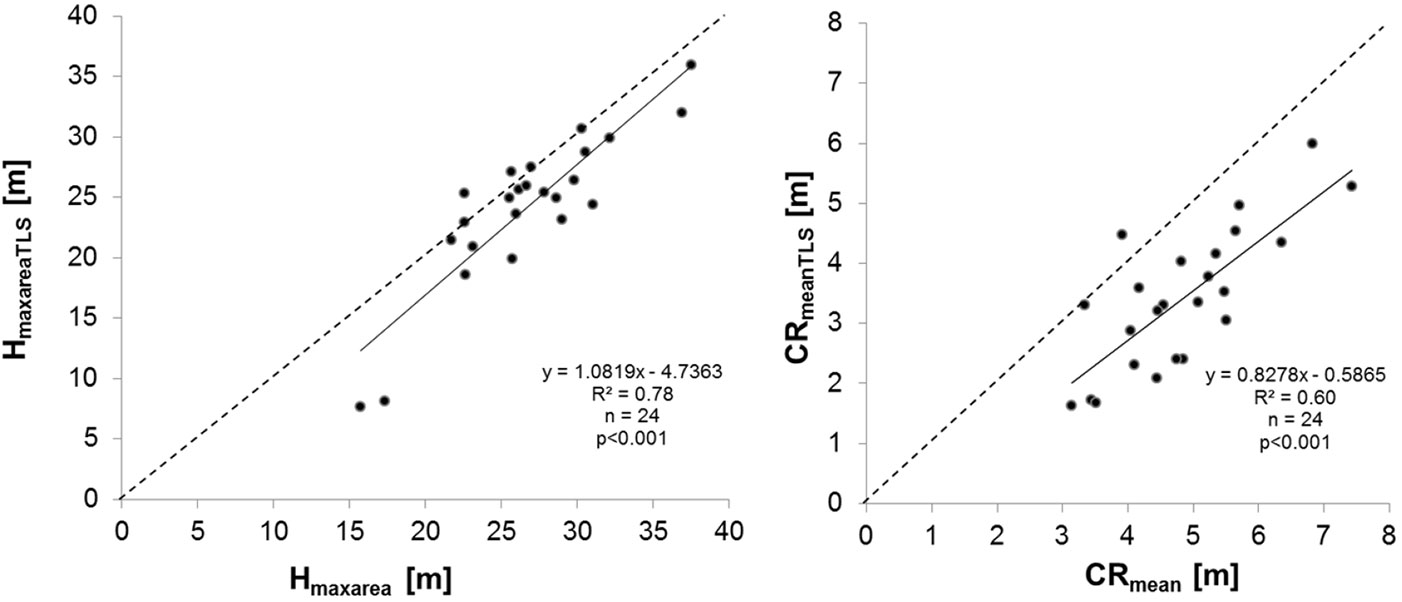
A coefficient of determination of 0.6 was found for the relationship between CRmean measured in the field (six azimuthal directions) and the TLS-based measurement (360 azimuthal directions). The scatter plot (Fig. 4, right panel) clearly shows that conventional crown radius measurements resulted in higher values than the TLS-based measures. This was confirmed by the mean difference (CRmean-CRmeanTLS) being 1.4 m.
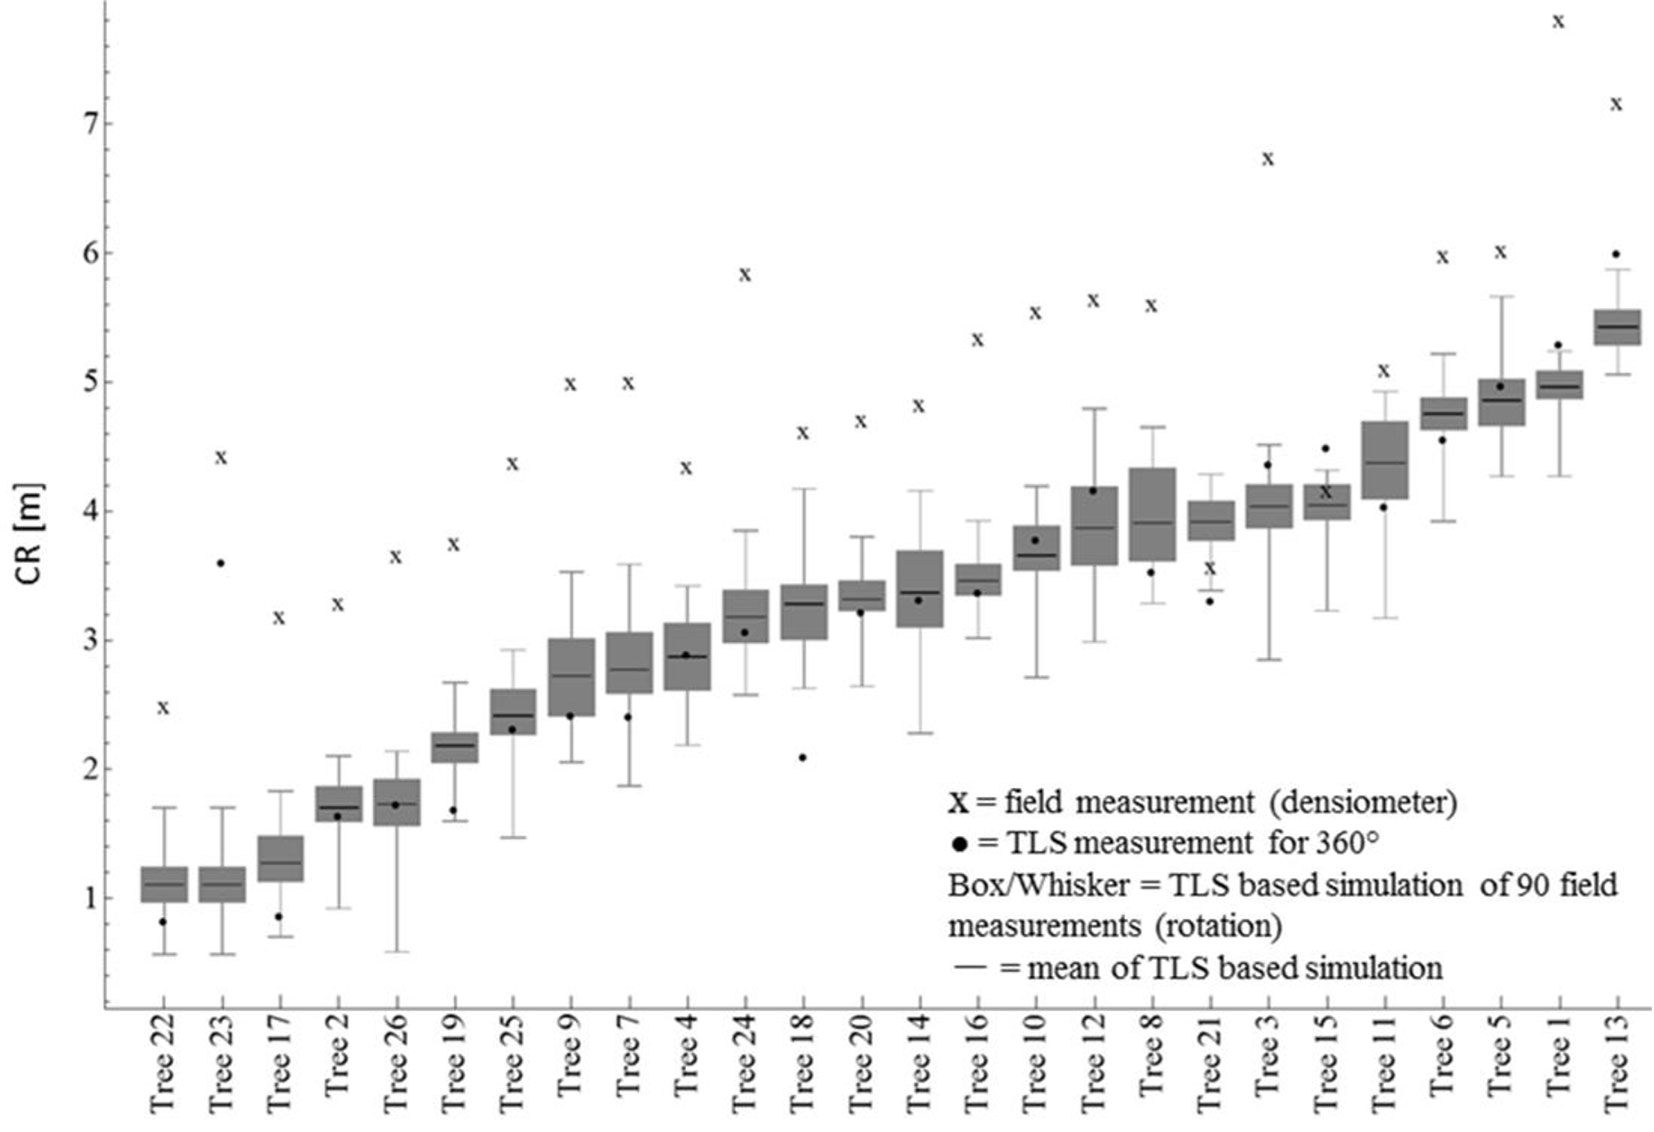
As displayed in Fig. 5, conventional field based measurements of the mean crown radius (CRmean, indicated by an “X” in the figure) using a densiometer yielded generally higher values than those obtained from scan based simulations of the conventional measurements scheme (Box-Whisker plot of CRmeanTLSrotated) or those obtained from 360 measurements in the virtual tree crown (CRmeanTLS, indicated by the black dots). Interestingly, CRmeanTLS was the more likely to be higher than CRmeanTLSrotated the larger the crown radius was, whereas the opposite was true for trees with small crown radii (Fig. 5).
Fig. 5 - Comparison of CRmeanTLS, CRmean and CRmeanTLSrotated (rotation around vertical) based on the TLS data.
Values of CPA and CPATLS were correlated (R²=0.67) and yielded a statistically significant linear regression (p<0.001 - Fig. 6, left panel). Crowns of large trees tended to have higher CPA values when calculated conventionally compared to TLS-based estimations that rely on the convex hull of the polygon enclosing the projected area of the crown voxels (precisely, their center coordinates). The mean difference between the two approaches was 9.4 m2 (CPA-CPATLS).
Fig. 6 - (Left): Relationship between the CPA and a CPATLS. (Right): Relationship between CSA calculated from conventional field data and determined based on TLS data. The 1:1 ratio is represented by the dashed line.
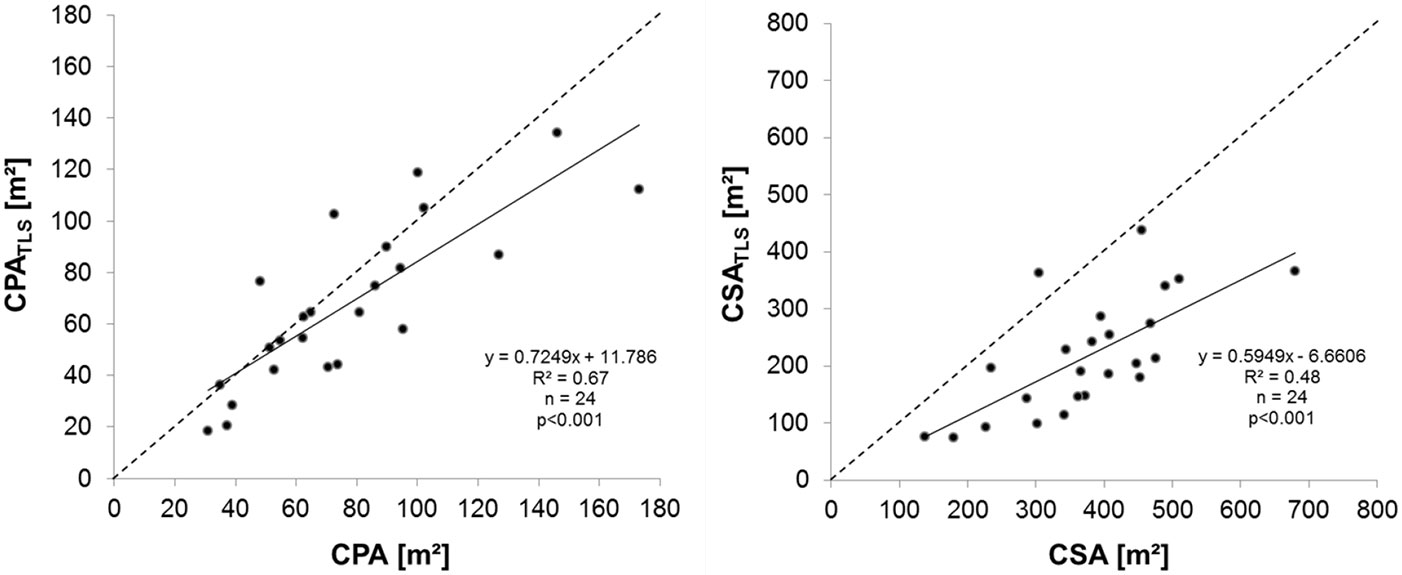
CSA values calculated based on TLS data and those calculated from traditional field data yielded a statistically significant linear regression (p<0.001) and an intermediate coefficient of determination (R2=0.48; Fig. 6 right). The mean absolute difference between crown surface areas calculated from the two approaches was 167.5 m2, with the TLS-based values being usually much smaller than the field-based values.
We found that various crown attributes were closely related to preceding tree diameter growth. Models with interactions and models with more than just one attribute did not result in a stronger relationship than models using only the attribute that showed the strongest relation to growth (results not shown). Closest relation to 5-year basal area increment was given by three simple tree structural attributes obtained from TLS, with the following order in model quality: CRmeanTLS, MaxareaTLS and CPATLS (Tab. 2). The conventionally calculated attributes CPA and CRmean were less closely related to tree growth than the respective laser-derived attributes, which is indicated by the differences in AIC (ΔAICc). The strength of the relationship with growth was found to be similar for CSA and CSATLS (Tab. 2).
Tab. 2 - Comparison of models relating the basal area increment (2007-2013) to different tree size attributes (nine measured in 2013 and one in 2007 [initial DBH]). (W_ic): AICs weights ([6]); (***): p<0.001; (**): p<0.01; (*): p<0.05.
| Tree structural attribute |
AICc | ΔAICc | R² | Level of significance |
W_ic |
|---|---|---|---|---|---|
CR meanTLS |
234.18 | 0.00 | 0.44 | *** | 0.32 |
Max areaTLS |
234.35 | 0.17 | 0.44 | *** | 0.29 |
CPA TLS |
234.96 | 0.78 | 0.42 | *** | 0.21 |
CSA
|
237.82 | 3.64 | 0.33 | ** | 0.05 |
CSA TLS |
238.94 | 4.76 | 0.29 | ** | 0.03 |
CV TLS |
238.98 | 4.80 | 0.29 | ** | 0.03 |
CR mean |
239.14 | 4.96 | 0.29 | ** | 0.03 |
CPA
|
239.75 | 5.57 | 0.27 | * | 0.02 |
DBH (2007) |
240.11 | 5.93 | 0.25 | * | 0.02 |
TTH TLS |
244.44 | 10.26 | 0.07 | n.s. | 0.00 |
Discussion
As tree crown size is closely related to light absorption and hence productivity ([4]), reliable estimations of tree crown dimensions are essential for any kind of tree growth modeling. Validation of the reliability of structural attributes describing crown dimensions derived from TLS data has been difficult ever since this technology was used in forest research. While attributes such as DBH can be validated based on reliable field data, tree attributes more difficult to measure such as TTH or CRmean may not necessarily be accepted as “more correct” or “closer to the real value” when measured in the field. We decided to avoid this problem using any of the two datasets as “true” reference. Instead, we used information from both approaches to compare how they are related to preceding tree growth.
Tree structural attributes obtained from TLS were more closely related to preceding tree growth than those measured in the field. If spatially detailed information on the crown dimensions is available from TLS, such as CRmeanTLS calculated from 360 measurements, estimations of CSATLS that rely on simple geometric models seem to offer no advantages. Analyzing the same sites considered in our study, Fichtner et al. ([12]) showed that tree growth is related to CSA (R²>0.37-0.63), though a tree crown model developed only for the sun-exposed crown was mistakenly applied to the whole crown, thereby ignoring the usually assumed differences in shape between the sun-exposed and the shaded part, as presented here and elsewhere ([28], [31]).
In our study we confirmed that CSA seems a suitable proxy for tree growing performances. However, we demonstrated that crown structural attributes obtained from sophisticated measurements are even more closely related to tree growth. Obtaining high resolution data on crown structural attributes would be very laborious if carried out without the use of TLS. Earlier studies showed that such data can also be obtained by means of TLS for other tree species, including coniferous species ([36], [2], [24]). Such data can be used to explain tree growth with higher-than-usual model quality. By conducting 360 measurements of crown radius in the virtual environment of a point cloud, a more precise mean value could be calculated when compared to six field measurements. Fig. 5 showed that field measurements based on six directions (N, E, S, W, shortest, longest) usually result in higher values of CRmean as compared with TLS estimates. We explain this by the strong influence of the longest crown radius, accounting for the sixth part of the mean value. While the length of the shortest radius can be zero the longest radius can be very large, e.g., due to a strong branch leaning out from the crown center. In the case of 360 measurements based on TLS data, the effect of such a branch on CRmean is much lower. In such a case, one measurement represents only a 360th of the mean, and only a branch with an azimuthal extent of 60° would have the same weight on the mean, which is quite unlikely. However, field-based estimations of the crown radius were generally larger than TLS-based estimations from simulations of the same measurement scheme (see the Box-Whisker plots in Fig. 5). Field measurements should be in the range of the Whiskers if the measurement of the distance between the stem and the edge of a branch in a given direction would yield similar results. This is the case only for two out of 24 trees. We argue that this might be due to difficulties to accurately delineate the end of a branch in the field, especially when trees are very tall. Furthermore, in the case of the TLS-based delineation, small branches and their tiny tips may remain undetected, thus tree crown radii might be underestimated to a certain degree. This effect would be larger in the case of very tall trees, due to the decreasing scan resolution with distance from the scanner. As some of our study trees reached heights greater than 40 m, we expect this error to be present in our dataset, even though we used a 10-cm voxel model.
CSA and CVTLS were the only structural characteristics based on all three dimensions of the tree crown. The first aims at describing the production potential of trees in terms of photosynthesis. Describing the surface area of the tree exposed to sunlight seems reasonable when growth is to be related to crown dimensions. Indeed, the area described by CSA does not represent the crown photosynthetic activity, as neighboring trees cast their shadow on this area and the ratio of leaves adapted to direct sunlight to those adapted to shade is unknown. We hypothesize that CSA values are closely related to growth as they are largely determined by CRmean. Our study showed that attributes describing the horizontal extension of tree crowns were closely related to growth.
In contrast, CVTLS describes the overall three-dimensional extent of the tree crown, with its value being determined by all spatial irregularities of the crown shape both in vertical and horizontal directions, but with no dominant control by the horizontal extent. The three models with the strongest relationship to tree growth were all based on attributes describing the crown width (CRmeanTLS, MaxareaTLS, CPATLS). This finding is in line with studies indicating that trees released from competition tend to increase their crown width and length but not their leaf area density ([15]).
The horizontal extent of tree crown is often described via the mean crown radius or the crown projection area, which is calculated from the mean radius. In most cases the mean crown radius itself is averaged from a small number of measurements. As mentioned by Fleck et al. ([14]) “the most often used resolution […] is an eight-point crown projection, since four-point projections (into North, East, South, and West direction) are insufficient for most purposes and 16-point approximations require too much time for large-scale investigations”. However, according to Röhle & Huber ([32]) eight radii seem to be a minimum for reliable measurements. In our study, the use of six azimuthal directions led to the overestimation of tree crown dimensions (CRmean, CPA) as compared with detailed measurements of crown radius from TLS (360 azimuthal directions), which holds especially for large trees (see Fig. 4, right panel and Fig. 6). Since crown dimensions of such trees are overestimated, their diameter growth may mistakenly be interpreted as lower than expected, which may lead to misinterpretations. In their study at the same sites, Fichtner et al. ([12]) concluded that the growth efficiency of beech trees in managed forests, which had been released from competition and which were characterized by large crowns, was lower than that of trees with shallow crowns in an unmanaged stand. Actually, no difference in mean growth efficiency (basal area increment per m2 crown projection area) between managed and unmanaged trees exists if the regression equation in Fig. 6 is used for calculating the “true” crown projection areas for the trees investigated in Fichtner et al. ([12]). This is in line with the comprehensive study of Pretzsch & Schütze ([30]) who found that dominant beech at a given age does hardly change its crown efficiency but immediately starts to occupy new space by enlarging its crown. The high plasticity of beech to effectively explore the canopy space was confirmed by Schröter et al. ([34]), who found that the “direction of crown displacement” of a given tree was strongly dependent on the distance from neighbors.
Conclusions
In the present study we compared conventional measures of crown structural attributes with more sophisticated, spatially-explicit measurements based on high resolution point clouds obtained from TLS. Although the accordance between attributes derived from the two approaches was high in general if addressed via correlation analysis, we found large differences for several parameters, especially CRmean and CRmeanTLS. A comparison of linear models of tree growth revealed that crown radius is the attribute with the strongest relationship to tree growth, followed by the two closely related attributes MaxareaTLS and CPATLS. We conclude that the horizontal extension of tree crown has to be considered as one of the most important drivers of tree growth.
From a silvicultural point of view, an early release from competition leads to crown enlargment, resulting not only in high growth responses ([29]) but also in more regular crowns (i.e., circular and centered on the stem - [22]), which in turn reduce the whole stress field in a trunk resulting from tree growth ([20]).
We demonstrated that terrestrial laser scanning is a powerful tool to measure physical crown dimensions. In this study TLS-based measurements were found more reliable than conventional field methods. Therefore, TLS data should be considered a suitable tool to validate crown radius measurement from airborne laser scanning ([18], [17]) and it may also be useful for comparisons with high spatial resolution above-canopy imagery. On the long term, airborne approaches for crown radius measurements are likely to be more widely applied to forest areas and they will benefit from detailed ground truth data by means of TLS.
Acknowledgements
We thank the administration of the municipality forest of Lübeck for the permission to scan the trees and for providing us with data on the 2007 forest inventory. We are also grateful to the helpful comments of three anonymous reviewers.
References
Gscholar
Gscholar
Gscholar
Gscholar
Gscholar
Gscholar
Gscholar
Gscholar
Gscholar
Gscholar
Gscholar
Authors’ Info
Authors’ Affiliation
Department of Forest Ecosystems and Society, College of Forestry, Oregon State University, 321 Richardson Hall, Corvallis, 97331 OR (USA)
Peter Schall
Malte Gille
Christian Ammer
Department of Silviculture and Forest Ecology of the Temperate Zones, Faculty of Forest Science and Forest Ecology, University of Göttingen, Büsgenweg 1, 37077 Göttingen (Germany)
Corresponding author
Paper Info
Citation
Seidel D, Schall P, Gille M, Ammer C (2015). Relationship between tree growth and physical dimensions of Fagus sylvatica crowns assessed from terrestrial laser scanning. iForest 8: 735-742. - doi: 10.3832/ifor1566-008
Academic Editor
Chris Eastaugh
Paper history
Received: Jan 17, 2015
Accepted: May 04, 2015
First online: Jun 11, 2015
Publication Date: Dec 01, 2015
Publication Time: 1.27 months
Copyright Information
© SISEF - The Italian Society of Silviculture and Forest Ecology 2015
Open Access
This article is distributed under the terms of the Creative Commons Attribution-Non Commercial 4.0 International (https://creativecommons.org/licenses/by-nc/4.0/), which permits unrestricted use, distribution, and reproduction in any medium, provided you give appropriate credit to the original author(s) and the source, provide a link to the Creative Commons license, and indicate if changes were made.

Web Metrics
Breakdown by View Type
Article Usage
Total Article Views: 53949
(from publication date up to now)
Breakdown by View Type
HTML Page Views: 44319
Abstract Page Views: 3693
PDF Downloads: 4503
Citation/Reference Downloads: 35
XML Downloads: 1399
Web Metrics
Days since publication: 3812
Overall contacts: 53949
Avg. contacts per week: 99.07
Article Citations
Article citations are based on data periodically collected from the Clarivate Web of Science web site
(last update: Mar 2025)
Total number of cites (since 2015): 34
Average cites per year: 3.09
Publication Metrics
by Dimensions ©
Articles citing this article
List of the papers citing this article based on CrossRef Cited-by.
Related Contents
iForest Similar Articles
Technical Advances
Improved estimates of per-plot basal area from angle count inventories
vol. 7, pp. 178-185 (online: 17 February 2014)
Research Articles
Estimation of stand crown cover using a generalized crown diameter model: application for the analysis of Portuguese cork oak stands stocking evolution
vol. 9, pp. 437-444 (online: 02 December 2015)
Research Articles
Allometric models for the estimation of foliage area and biomass from stem metrics in black locust
vol. 15, pp. 281-288 (online: 27 July 2022)
Research Articles
Fuel characterization and crown fuel load prediction in non-treated Calabrian pine (Pinus brutia Ten.) plantation areas
vol. 15, pp. 458-464 (online: 03 November 2022)
Research Articles
Local neighborhood competition following an extraordinary snow break event: implications for tree-individual growth
vol. 7, pp. 19-24 (online: 14 October 2013)
Research Articles
Predicting tree crown defoliation using color-infrared orthophoto maps
vol. 6, pp. 23-29 (online: 14 January 2013)
Research Articles
Scots pine’s capacity to adapt to climate change in hemi-boreal forests in relation to dominating tree increment and site condition
vol. 14, pp. 473-482 (online: 18 October 2021)
Research Articles
The use of tree crown variables in over-bark diameter and volume prediction models
vol. 7, pp. 132-139 (online: 13 January 2014)
Research Articles
Integrating area-based and individual tree detection approaches for estimating tree volume in plantation inventory using aerial image and airborne laser scanning data
vol. 10, pp. 296-302 (online: 15 December 2016)
Research Articles
Tree aging does not affect the ranking for water use efficiency recorded from δ13C in three Populus deltoides × P. nigra genotypes
vol. 12, pp. 272-278 (online: 21 May 2019)
iForest Database Search
Search By Author
Search By Keyword
Google Scholar Search
Citing Articles
Search By Author
Search By Keywords
PubMed Search
Search By Author
Search By Keyword


