Is it needed to integrate mixture degree in Stand Density Management Diagram (SDMD)?
iForest - Biogeosciences and Forestry, Volume 16, Issue 5, Pages 274-281 (2023)
doi: https://doi.org/10.3832/ifor4005-016
Published: Oct 28, 2023 - Copyright © 2023 SISEF
Research Articles
Abstract
Stand density management diagrams (SDMDs) are robust decision-support tools available to forest managers under limited information. SDMDs which are based on empirical models at stand level, graphically represent the temporal relationships among stand density, and different stand variables such as quadratic mean diameter, dominant height, and mean tree volume. They are used to define initial planting spacing or thinning interventions, to meet various management objectives. Nowadays, there is a growing interest in mixed-species forests as an option for adaptive forest management, where they are considered a guarantor to safeguarding a wide variety of ecosystem services within the framework of sustainability. But there is still a lack of knowledge and efficient tools and models for mixed stands such as SDMDs. This study aims to develop an SDMD for Pinus sylvestris L. and Pinus pinaster Ait. mixed stands in the Sierra de la Demanda (Spain) using data from the third Spanish National Forest Inventory. Both species are two of the most important conifers in Europe and the western Mediterranean basin. Different variables can be used to develop an SDMD. In this case, quadratic mean diameter, dominant height, total stand volume, number of trees per hectare, and stand density index were used. These equations were fit by simultaneous fitting including a new variable representing the proportion of both species in the mixed stand. The results of the simultaneous fitting showed the new variable representing the proportion of both species was not significant. Based on that, the SDMD was constructed without including mixture degree. This SDMD can be used by forest managers as an efficient tool to plan thinning operations.
Keywords
Reineke Index, Dominant Height, Silviculture, Thinning, Pinus sylvestris L, Pinus pinaster Ait.
Introduction
Maintaining and promoting functionally vigorous forests entails the sound regulation of tree numbers per unit area versus average tree size, such a process impacts how a stand develops over a rotation period. Density management is one of the most robust and effective tools available to foresters, in order to achieve desired conditions of the managed stands; consequently, a wide range of stand management objectives can be acquired. Hence, it may help in overcoming some harmful effects of climate change and site degradation. In this regard, stand density management diagrams (SDMDs) have emerged as a time-saving and cost-effective approach. On the contrary to thinning trials which have some critical restrictions ([16], [52], [45]), SDMDs are simple decision-support tools found to help forest managers in the decision-making process under limited information, they are flexible and adaptable to different site conditions and management goals ([45]). They are efficient in quantitative silviculture as they help forest managers to design, display and evaluate various density management regimes ([21], [33]) to predict what stand post-thinning density would be. In terms of operating costs, SDMDs are an inexpensive tool, making them a favorable option in a region such as the Mediterranean, where the silvicultural practice must be enacted under critical budget constraints ([52]) due to low productivity and management based on public fundings.
The main principle of any SDMD is based on the stand self-thinning rule. SDMDs are defined as empirical models at stand level. This graphically represents the temporal relationships among stand density, and different stand variables such as quadratic mean diameter, dominant height, and mean tree volume ([19], [32]). This size-density relationship is a cornerstone for the establishment of those diagrams by characterizing the growing stock, using indices that relate the average tree size (e.g., diameter, volume, or height) to the number of trees per hectare ([7]). Among these density indices which are based on size-density relationships, Reineke’s stand density index (SDI - [41]) was the most widely used ([47], [52], [54], [39]). Moreover, Reineke’s index is more accurate in Mediterranean pine forests than Hart’s index ([44]).
Practically, SDMDs are used to define initial planting spacing or thinning interventions, consequently, to meet various management objectives, which include but not be limited to: increasing stand stability and decreasing crown fire risk ([29]); creating and conserving habitat for wildlife endangered species ([47]); reducing vulnerability to beetles’ attacks ([5], [27]); or optimizing stand density for timber production purposes at rotation age ([11]).
SDMDs have been developed worldwide for a broad set of species, which varied between broad-leaved and conifer species. However, most of them were focused on monoculture stands where Quercus robur L. ([7]), Pinus banksiana Lamb. ([46]), Pinus palustris P. Mill. ([47]), Pinus halepensis Mill. and Pinus pinaster ([52]), Pinus radiata D. Don ([13]), Picea abies (L.) Karst. ([51]), Cunninghamia lanceolata (Lamb.) Hook. ([49]), Eucalyptus grandis W. Hill RS ([30]) or Castanea sativa Mill. ([35]) were the target species. In comparison, there are very few SDMDs for mixed-species forests: Abies balsamea (L.) Mill., Picea rubens Sarg., Picea mariana (Mill.) BSP. and Picea glauca (Moench) Voss forests in northeastern North America ([48]), Mixed-Conifer Stands in Sierra Nevada ([28]), Juniperus procera Hoechst. Ex. Endl and Podocarpus falcatus Thunb. Mirb natural mixed forests in Ethiopia ([50]), and Pinus-Quercus natural mixed forests in Mexico ([11]). Studies have revealed that species mixing can provoke changes in above-ground species allometries in both pine-pine mixtures, including P. pinaster-P. sylvestris mixtures, involving five pine species covering different biogeographical distributions ([15]), and coniferous-broadleaf mixtures ([18]). In view of the foregoing, it is important to develop SDMDs in mixed forest.
Scots pine (Pinus sylvestris) and Maritime pine (Pinus pinaster) are two of the important coniferous species in Europe and the Mediterranean basin. Where P. sylvestris is widely distributed over the Eurasian continent ([31]), while P. pinaster occurs in the western Mediterranean Basin, and the Atlantic coast in Spain, Portugal, and France, and currently it is used for forestation even outside its natural distributions ([3]). For the time being, the new tendency gives priority to safeguarding a wide variety of ecosystem services within the framework of sustainability by adopting the species-mixing principle as an option for adaptive forest management ([4]).
Mixed forests are increasingly becoming more worthwhile in comparison to monoculture forests, as their favorable effects on various ecosystem services at higher levels, including production ([20]). Moreover, they have more resistance to natural disturbance factors ([22]), and species mixing can positively influence the stability of productivity ([17]). All these demonstrate the widely known multifunctionality of the mixed forests ([53]), consequently, enhancing the contribution to climate change mitigation and adaptation. Species mixing dilutes the risk of biotic or abiotic stress and disturbances that emerged from climate change. This response pattern can be attributed to diverse susceptibilities among species to particular disturbances. As a consequence, the number of surviving trees is directly proportional to the number of tree species in a stand ([38]). Moreover, these remaining trees can rather provide a base structure for the stand functioning and recovery ([23]). Although there are many studies reporting the notable effects of mixed forests in terms of stability and important productive capacity, there is still an inadequate knowledge of the mechanisms and trade-offs underlying these effects, and the need for more understanding of the spatial and temporal levels at which these effects are operating ([14]).
The main objective of this study is to develop an SDMD for Pinus sylvestris and Pinus pinaster mixed stands in the Sierra de la Demanda, Burgos and Soria, Spain. In parallel with developing the SDMD, we aimed at studying the behavior of both species in mixed stands.
Material and methods
Study area
The Sierra de la Demanda (Northern Spain) is an elongated mountainous massif, rising in the extreme northwest of the Iberian system (Fig. 1).
Fig. 1 - Study area (Sierra de la Demanda, Northern Spain).
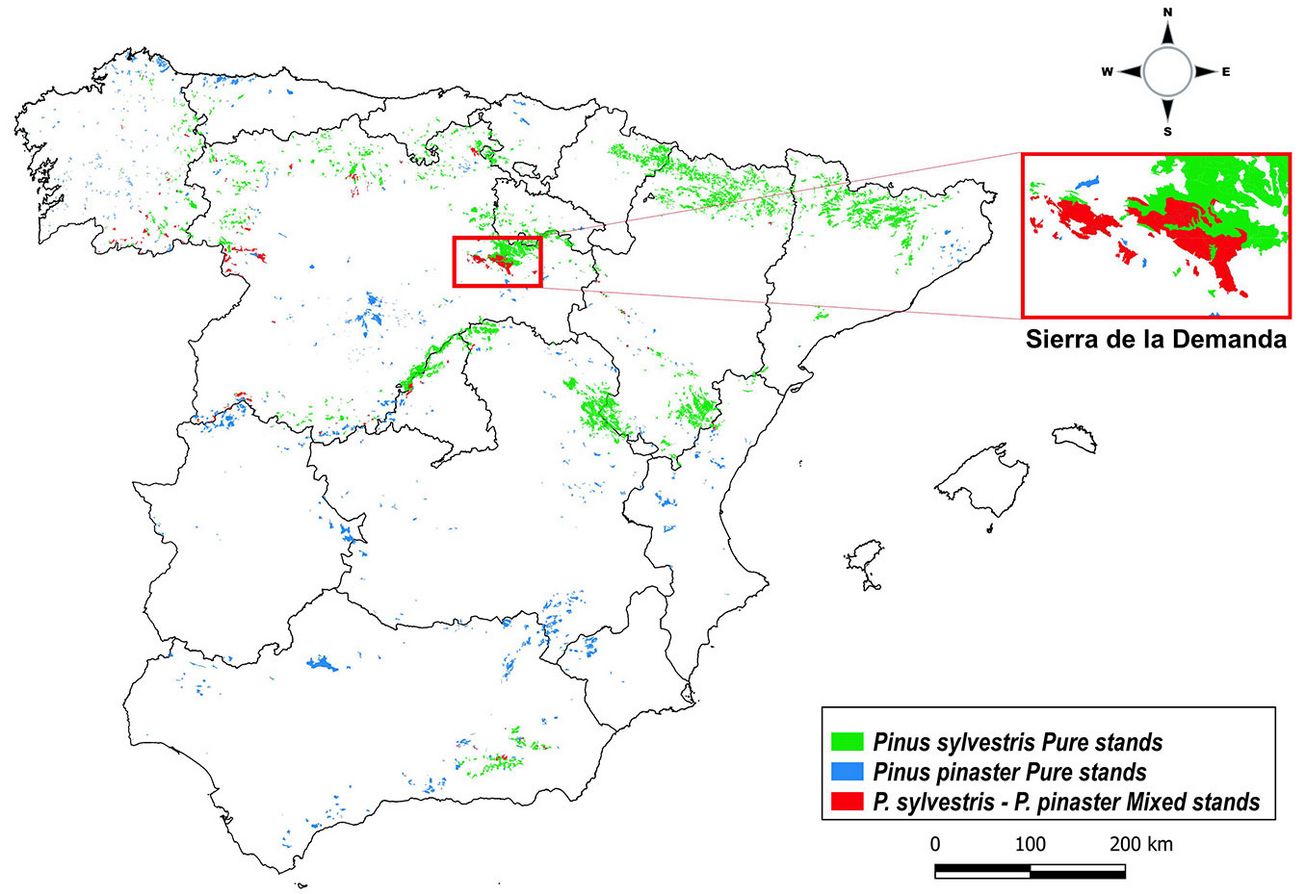
Scots pine (Pinus sylvestris) forests in the study area cover 296.02 km2 of land (about 19.19% of the total forest cover) while Maritime pine (Pinus pinaster) cover only 20.57 km2 of land (about 1.06% of the total forest cover - [1]).
Its climate is characterized as Continental Mediterranean but owing to its elevation, it experiences long, cold winters and short, cool summers. Average total annual precipitation, according to data from the Meteorological Station in Pradoluengo from 1990-2006, is at 746.9 mm with a high of 87.19 mm in November and a low of 36.16 mm of rainfall in February. Temperatures range from annual isotherms of 3.48 to 18.78 °C ([1]).
Data
Data from the third Spanish National Forest Inventory (SNFI3, 1997- 2007) were extracted as a primary input for the purpose of developing an SDMD for Pinus sylvestris and Pinus pinaster mixed stands in the Sierra de la Demanda. The origin of the stands is either natural or plantation; maps with information about stand origin data are available at ⇒ https://sites.google.com/site/sigforestspecies/home. Mixed plots were defined based on the criterion of the combined proportion of basal area for both species accounted for at least 90% of the total, while the proportion of each species in the mixed plots was higher than 15% ([42]). A total of 165 mixed plots were analyzed. The main plots characteristics are summarized in Tab. 1.
Tab. 1 - Summary of the data set (n = 165) from the third Spanish National Forest Inventory used to develop SDMD for Pinus sylvestris and Pinus pinaster mixed stands in the Sierra de la Demanda (Spain). (n): total number of plots; (DBH): average diameter at breast height (cm); (QMD): quadratic mean diameter (cm); (H): average tree height (m); (Ho): dominant height (m); (N): the number of trees per hectare; (V): the over bark volume (m3 ha-1); (G): basal area (m2 ha-1); (SDI): Reineke’s stand density index.
| Attributes (Variable) | Mean | Minimum | Maximum | Standard deviation (SD) |
|---|---|---|---|---|
| DBH | 26.96 | 9.13 | 45.28 | 7.56 |
| QMD | 28.53 | 9.19 | 48.22 | 7.43 |
| H | 13.58 | 4.7 | 22.88 | 4.07 |
| Ho | 16.26 | 6.5 | 26.17 | 3.93 |
| N | 535.32 | 101.29 | 977.99 | 228.67 |
| V | 300.44 | 12.27 | 977.69 | 163.3 |
| G | 32.5 | 2.53 | 73.44 | 14.54 |
| SDI | 599.92 | 74.59 | 1250.36 | 250.42 |
The plots of the Spanish National Forest Inventory are permanent plots systematically distributed on UTM square grids with a resolution of 1 × 1 km each. The plots are re-measured in approximately 10-year intervals. Each plot is composed of four circular concentric subplots with radii of 5, 10, 15, and 25 meters. For trees in the 5 m circle, trees with a diameter at breast height (DBH) that exceed 7.5 cm are taken into account; in the 10 m subplot, those that exceed 12.5 cm; for trees in the 15 m circle, those greater than 22.5 cm; and lastly, in the 25 m subplot, those exceeding 42.5 cm. Variables taken into account include height (h), species, distance, and azimuth of trees measured from plot center. Forest type, erosion factors, anthropogenic activity, tree damage, shrub species, cover (in the 10 m subplot), and plot identification are other data recorded from the concentric subplots. The caliper was used to measure tree diameter, by taking two diameter measurements at right angles to each other.
Different variables are necessary to develop an SDMD: quadratic mean diameter (QMD), dominant height (Ho), total stand volume (V), number of trees per hectare (tree density, N), and stand density index (SDI).
The total stand volume, quadratic mean diameter (QMD), and tree density (N) were estimated using three different functions from the package “basifoR” ([25]) in R ([40]).
The dominant height was calculated according to the criterion of Assmann, which is the definition most widely used in Spain ([8]), where it considers the dominant height as the height corresponding to the tree that presents the average height of the 100 thickest trees per hectare ([6]).
Due to the NFI design, trees are considered in different subplots depending on their DBH, therefore the 100 thickest trees should be defined using the expansion factors. For this reason, the following equation derived from Assmann’s formula was used to calculate the dominant height (eqn. 1):
where Ho is the dominant height (m), H is the tree total height (m), i takes values from 1 to n of thickest trees, expfact is the expansion factor, n is the number of thickest considered trees; this value can vary depending on each NFI plot.
Reineke’s index (SDI) was used as a stand density index. The optimal density-growth interval was determined by upper and lower growing stock limits, where the upper limit intended to avoid trees mortality caused by competition due to high trees density, and it was defined by 60% of maximum SDI found for both species ([16]), while the lower limit was defined by 35% of maximum SDI aiming to ensure adequate site occupancy ([26]).
SDI was calculated by summing up the SDI for P. sylvestris (SDIsyl) and the SDI for P. pinaster (SDIpin) as described in eqn. 2 and eqn. 3, respectively, to take into account the area occupied by each species in mixed stands ([42]):
where SDI is the Reineke’s stand density index, N is the number of trees per hectare, QMD is the quadratic mean diameter, syl indicates Pinus sylvestris and pin indicates Pinus pinaster.
Model structure and statistical methods
The aimed SDMD model has the following fundamental components: (i) Reineke’s stand density index; (ii) an allometric system of two linear equations (eqn. 4, eqn. 5):
where QMD is the quadratic stem diameter (cm), N is the stand density (tree ha-1), Ho is the dominant height (m), V is the stand total volume (m3 ha-1), and βi are the regression coefficients.
Eqn. 4 relates the quadratic mean diameter with stand density and dominant height, while eqn. 5 relates the over bark volume with the quadratic mean diameter, dominant height, and stand density.
ln(QMD) and ln(V) are instrumental and dependent endogenous variables, while ln(Ho) and ln(N) are independent exogenous variables, but as ln(QMD) is defined independently of the system in eqn. 5, therefore it is considered as an independent exogenous variable. The two equations were fit simultaneously to prevent error correlation.
In order to test mixing effect on QMD and V, two models were developed from eqn. 4 and eqn. 5 by taking mixture proportions into account. In this regard, a new variable (mixfrac), calculated using eqn. 8 and eqn. 9, representing mixing degree, was introduced into both eqn. 6 and eqn. 7 ([48]).
The simultaneous fitting of the equations and the analyses were done using the R statistical environment.
SDMD was constructed using the format described by Barrio Anta & Alvarez González ([7]), with quadratic mean diameter (QMD) and density (N) on the major axes. QMD was represented on the x-axis as a logarithmic scale, while N was represented on the y-axis as a logarithmic scale too. Then isolines representing dominant height (Ho), over bark volume (V), and Reineke’s stand density index (SDI) were superimposed on the bivariate graph.
Results
The results from the simultaneous fitting of eqn. 6 and eqn. 7 to estimate quadratic mean diameter and total stand volume, show that all coefficients were significant at a 0.05 significance level, except for the mixture degree variable (mixfrac - Tab. 2). R-squared (R2) for ln(QMD) and ln(V) equations were quite high (0.795 and 0.9506 respectively), reflecting efficient goodness-of-fit statistics (Tab. 3). Due to the non-significant effect of the mixture degree variable (mixfrac), it was eliminated and another run of simultaneous fitting of the initial system of equations represented by eqn. 4 and eqn. 5 was done to estimate quadratic mean diameter and total stand volume. The results show that all the coefficients were quite significant at a 0.05 significance level (Tab. 4). Again, from the validation statistics of simultaneous fitting of the two equations system formed by eqn. 4 and eqn. 5 (Tab. 5), R-squared (R2) values for ln(QMD) and ln(V) equation were quite high (0.7743 and 0.9479 respectively). These results indicate efficient goodness-of-fit statistics and the right choice of both the equation form and the independent variables.
Tab. 2 - Coefficients resulted from the simultaneous fitting of the eqn. 6 and eqn. 7 to estimate quadratic mean diameter (QMD) and volume (V) respectively, for Pinus sylvestris and Pinus pinaster mixed stands.
| Variable (eqn.) |
Coefficients of regression | |||
|---|---|---|---|---|
| Coeff. | Parameter | Estimate | Pr(>|t|) | |
| QMD (eqn. 6) |
β 0 | Intercept | 2.56371 | 9.69E-12 |
| β 1 | mixfrac (Mixture degree) | 0.82466 | 0.486 | |
| β 2 | ln N (Density) | -0.1976 | 1.69E-06 | |
| β 3 | mixfrac (Mixture degree) | -0.34979 | 0.024 | |
| β 4 | ln Ho (Dominant height) | 0.73041 | < 2e-16 | |
| β 5 | mixfrac (Mixture degree) | 0.41264 | 0.145 | |
| V (eqn. 7) |
β 6 | Intercept | -7.58942 | < 2e-16 |
| β 7 | mixfrac (Mixture degree) | -2.24766 | 0.3391 | |
| β 8 | ln QMD (Quadratic mean diameter) | 1.64388 | < 2e-16 | |
| β 9 | mixfrac (Mixture degree) | 1.0148 | 0.1153 | |
| β 10 | ln Ho (Dominant height) | 0.9352 | 1.5E-08 | |
| β 11 | mixfrac (Mixture degree) | -1.07111 | 0.0818 | |
| β 12 | ln N (Density) | 0.82928 | < 2e-16 | |
| β 13 | mixfrac (Mixture degree) | 0.26548 | 0.313 | |
Tab. 3 - Validation statistics of simultaneous fitting of the eqn. 6 and eqn. 7 to estimate quadratic mean diameter (QMD) and volume (V) respectively, for Pinus sylvestris and Pinus pinaster mixed stands.
| Variable (eqn.) |
Parameter | Value |
|---|---|---|
| QMD (eqn. 6) |
RSE (Relative standard error) on 159 degrees of freedom | 0.1317 |
| R2 (Coefficient of determination) | 0.795 | |
| Adjusted R2 | 0.7885 | |
| p-value (Probability value) | < 2.2e-16 | |
| V (eqn. 7) |
RSE (Relative standard error) on 157 degrees of freedom | 0.1596 |
| R2 (Coefficient of determination) | 0.9506 | |
| Adjusted R2 | 0.9484 | |
| p-value (Probability value) | < 2.2e-16 |
Tab. 4 - Coefficients resulted from the simultaneous fitting of the eqn. 4 and eqn. 5 to estimate quadratic mean diameter (QMD) and volume (V) respectively, for Pinus sylvestris and Pinus pinaster mixed stands.
| Variable (eqn.) |
Coefficients of regression | |||
|---|---|---|---|---|
| Coeff. | Parameter | Estimate | Pr(>|t|) | |
| QMD (eqn. 4) |
β 0 | (Intercept) | 2.69703 | <2e-16 |
| β 1 | ln N (Density) | -0.26759 | <2e-16 | |
| β 2 | ln Ho (Dominant height) | 0.82344 | <2e-16 | |
| V (eqn. 5) |
β 3 | (Intercept) | -8.18200 | < 2e-16 |
| β 4 | ln QMD (Quadratic mean diameter) | 1.90971 | < 2e-16 | |
| β 5 | ln Ho (Dominant height) | 0.68569 | 2.05e-12 | |
| β 6 | ln N (Density) | 0.88702 | < 2e-16 | |
Tab. 5 - Validation statistics of simultaneous fitting of the eqn. 4 and eqn. 5 to estimate quadratic mean diameter (QMD) and volume (V) respectively, for Pinus sylvestris and Pinus pinaster mixed stands.
| Variable (eqn.) |
Parameter | Value |
|---|---|---|
| QMD (eqn. 4) |
RSE (Relative standard error) on 162 degrees of freedom | 0.1369 |
| R2 (Coefficient of determination) | 0.7743 | |
| Adjusted R2 | 0.7715 | |
| p-value (Probability value) | < 2.2e-16 | |
| V (eqn. 5) |
RSE (Relative standard error) on 161 degrees of freedom | 0.1618 |
| R2 (Coefficient of determination) | 0.9479 | |
| Adjusted R2 | 0.9469 | |
| p-value (Probability value) | < 2.2e-16 |
Thus, the two linear models eqn. 4 and eqn. 5 without the mixture degree are the appropriate choices to develop the aimed Stand Density Management Diagram. Eventually, the two adjusted linear models to estimate quadratic mean diameter and total stand volume for Pinus sylvestris - Pinus pinaster mixtures in the Sierra de la Demanda were (eqn. 10, eqn. 11):
where QMD is the quadratic stem diameter (cm), N is the stand density (tree ha-1); Ho is the dominant height (m), and V is the stand total volume (m3 ha-1).
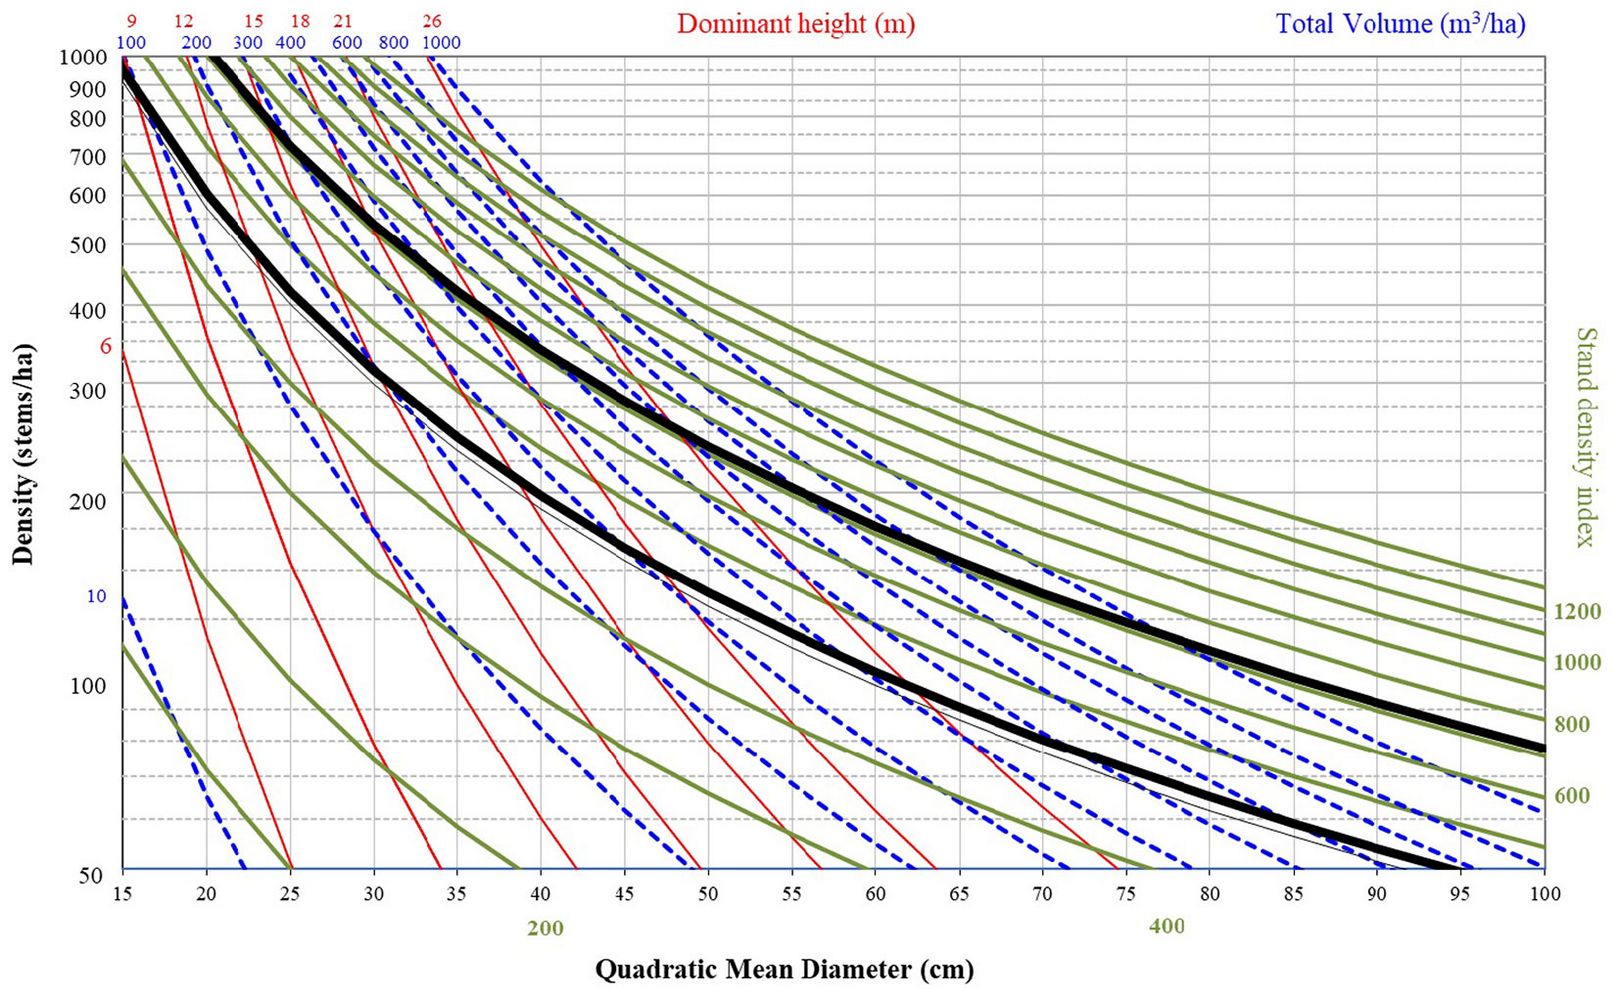
An SDMD for the mixed stands of Pinus sylvestris and P. pinaster in the Sierra de la Demanda was elaborated using the data obtained from the Spanish National Forest Inventory (eqn. 10 and eqn. 11), and the formula of Reineke’s stand density index (Fig. 2), where quadratic mean diameter (QMD) and density (N) were plotted on x-axis and y-axis respectively as logarithmic scales, while the isolines of dominant height (Ho, in red), total volume (V, in blue), and Reineke’s index (SDI, in green) were superimposed on the bivariate graph. The isolines in bold black represent the upper and lower growing stock limits and they are 60% of maximum SDI for the upper limits ([16]) and 35% of maximum SDI for the lower limit ([26]). Optimal density levels should be found between these limits, meaning both bold black lines. Values above the maximum limit mean silvicultural treatments like thinning should be done and values below the minimum limit mean the density is inadequate.
Fig. 2 - Stand Density Management Diagram (SDMD) for mixed stands of Pinus sylvestris and P. pinaster in the Sierra de la Demanda.
Discussion
The value of the stand density management diagram developed in this study for Pinus sylvestris - P. pinaster mixed stands, emerges from the current orientation of moving further in developing efficient tools and models in quantitative silviculture for mixed stands, to quantitatively and qualitatively enhance forest wood and non-wood production and ecosystem functions and services, especially in light of the lack of information on mixed forests combined with a raised interest in such forest systems.
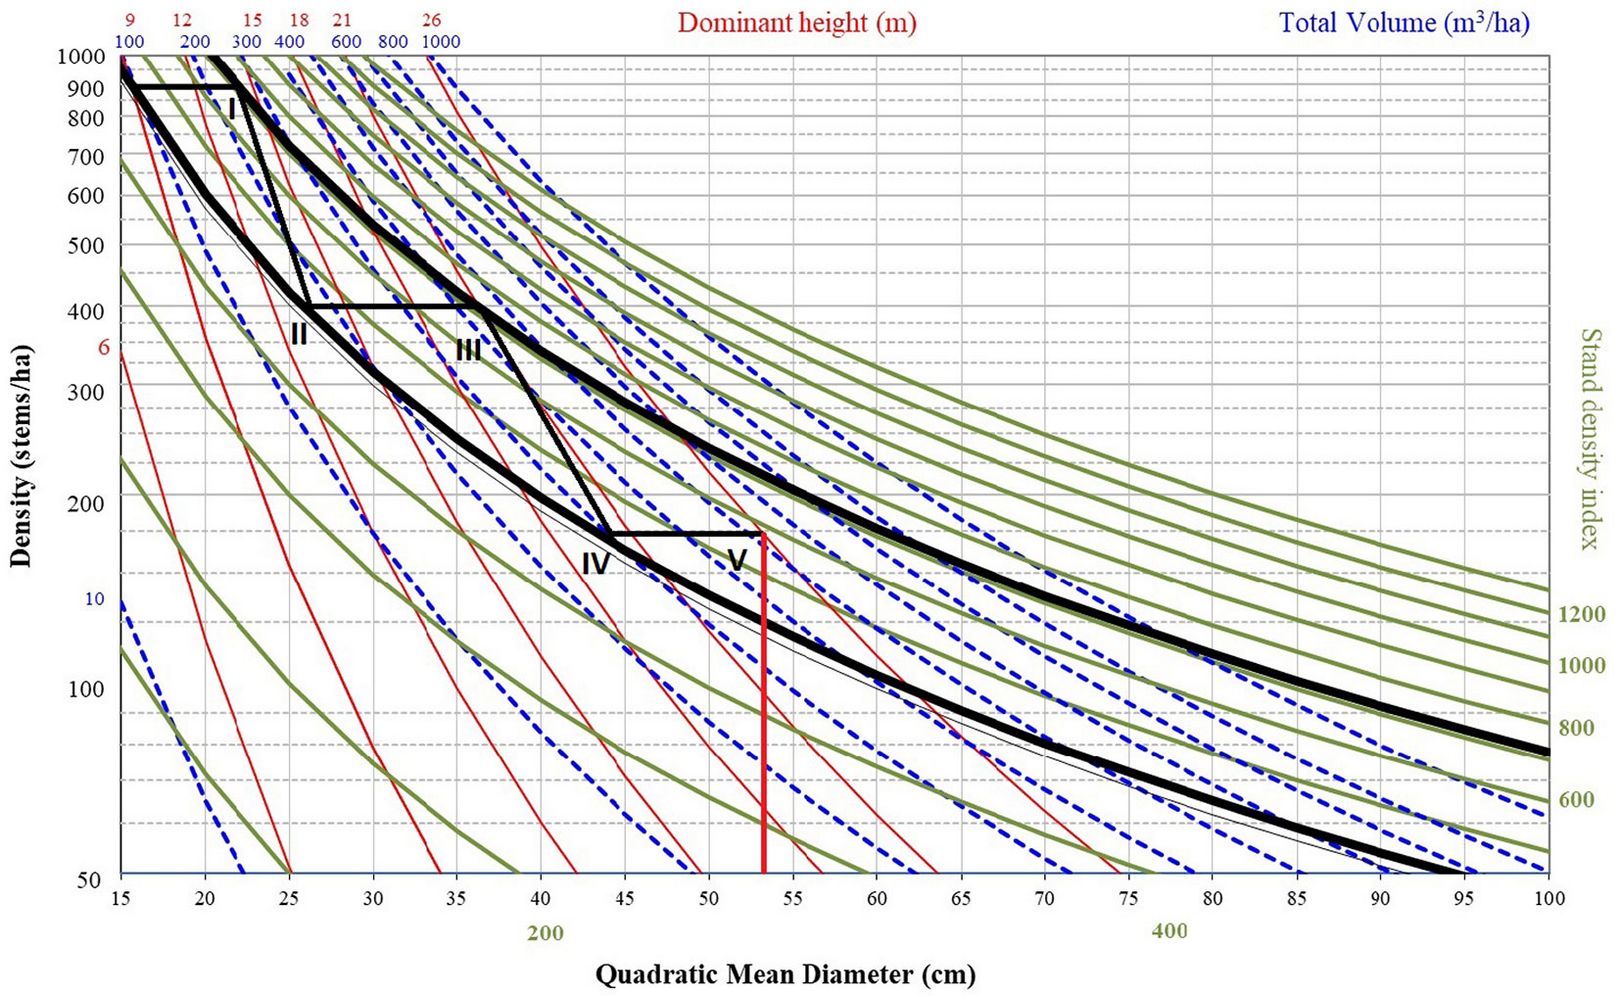
An example of alternative management in this type of forest is shown in Tab. 6 and Fig. 3. In this case, a set of thinning interventions was applied two times and different intensities (I-II and III-IV) and a final cut, which was defined by a dominant height of 26 m. The initial density was 900 trees ha-1 and a quadratic mean diameter of 22.7 cm. The first thinning was applied to obtain a density of 409 tree ha-1. Then the stand grew considering no natural mortality until a quadratic mean diameter of 26.5 cm when the second thinning should be applied. The density decreased from 409 trees ha-1 to 181 trees ha-1 after this second thinning. Again, the stand grew until a quadratic mean diameter of approximately 54 cm, when the final cut should be applied.
Tab. 6 - Silvicultural management alternative shown in Fig. 3. (N): density (trees ha-1); (QMD): quadratic mean diameter (cm); (Ho): dominant height; (V): the over bark volume (m3 ha-1).
| Entry | N (tree ha-1) | QMD (cm) | Ho (m) | V (m3) | ||||
|---|---|---|---|---|---|---|---|---|
| Before | After | Before | After | Before | After | Before | After | |
| I-II | 1000 | 409 | 22.7 | 26.5 | 15.3 | 14.3 | 294.3 | 187.5 |
| III-IV | 409 | 181 | 37.1 | 44 | 21.5 | 20.3 | 471.8 | 304.8 |
| V (Final cut) | 181 | - | 54 | - | 26 | - | 534.3 | - |
Fig. 3 - Silvicultural management alternative for mixed stands of Pinus sylvestris and Pinus pinaster in the Sierra de la Demanda.
Mixed-species stands as diverse systems show a greater increment in above-ground woody biomass than pure-species stands ([55], [34]). For example, the annual woody biomass production of mixed stands in the Alto Tajo region in Spain, which consist of two pine species (Pinus sylvestris and Pinus nigra J.F. Arnold) and two oak species (Quercus ilex L. and Quercus faginea Lam.), exceed the production of monocultures stands by more than 48% ([24]). Moreover, mixed stands have a higher level of carbon storage in the root system ([9]), in addition to their role in enriching wildlife taxa ([12]).
Our results showed that introducing a new variable reflecting species mixing effects into the system of equations was not significant, while it was significant in other studies and was retained in the models to formulate SDMD ([48]). Our results indicated that there was no impact of species mixing on stand yield represented by quadratic mean diameter and over bark volume. This is contrary to what Riofrío et al. ([43]) concluded that at stand level for the two species in mixed stands, there was a shared gain in productivity with respect to varying tree growth responses to inter-specific competition for each species. In another study of mixed stands (a combination between Pinus sylvestris and Fagus sylvatica L.), the results were similar to the previous one, where it showed increased productivity in the stands with superior growth of Pinus sylvestris compared to Fagus sylvatica growth, which was reduced ([36]).
The reasons behind these discrepancies can be attributed to the smaller scale of our data compared to the data in the study of Riofrío et al. ([43]). Moreover, the mixing degree variable (mixfrac - [48]) as a way of explaining the proportion of each species in the two allometric models, total stand volume and quadratic mean diameter, does not capture the effects on stand yield in the mixed stands of study. There is a lack of knowledge about mixed stands though it is increasing during the last few years ([37], [43]). Different cases of site-growth relationships in mixed stands can be observed based on different site conditions. In the first case, when the interactions between the two species are absent, the stand mutual gain in productivity would result in a proportional increase of each species, it means the total productivity summarizes the productivity of each species individually as in pure stands. In other cases, when there are interactions between both species, the total productivity does not correspond to the sum of individual productivities in pure stands, as facilitative or competitive effects affect final productivity ([36]). Moreover, Aldea et al. ([2]) reported that drought events in the Mediterranean sites where mixed stands of co-existing species of Pinus pinaster Ait. and Quercus pyrenaica Willd might affect both species’ growth, putting the stability of such mixed stands at risk.
Therefore, increased temperatures and higher frequency of drought events, which are forecasted for the Mediterranean region based on climate change scenarios, may alter radial variation cycles and cause a similar reduction in radial growth for both species.
In the present work, the interaction between both species is not clear because mixture degree was not significant in both the quadratic mean diameter or volume models.
Reineke’s index (SDI) is being used worldwide and not just for pure even-aged stands, where it has been generalized to be used in all types of stands including mixed stands ([47]). Reineke’s index can be computed based on the number of trees per unit area and one of the following stand attributes: quadratic mean diameter, mean stem volume, mean stand height, or stand basal area. However, Burkhart ([10]) reported that SDI calculated using quadratic mean diameter performed best in comparison with the other stand attributes.
Conclusions
In the present study, a stand density management diagram for Pinus sylvestris and Pinus pinaster mixed forests has been developed. This diagram could be a user-frendly tool for owners and managers to manage mixed stands using simple variables like dominant height or density.
The increasing interest in mixed-species forests is due to their recognized role in reinforcing ecosystem functions and services. Although, the advantages have prompted growing research to understand the mechanisms behind their functioning and stability compared to monocultures, resulting in notable insights in this regard. But at the same time, there is still a gap in the applied knowledge, i.e., the need for silvicultural tools and management guidelines for forest managers to plan, establish and sustain mixed forest systems. However, as the mixed forest is a complex system in terms of different mixing effects at different levels, there is still a lack of knowledge and room for more studies in this area. This complexity of mixing effects is reflected in our results which showed that the interaction between both species is not clear, thus no effects on stand yield. Eventually, to examine the behavior and influences on productivity, further studies should be done by considering different levels and scales.
Acknowledgments
This contribution has been supported by the Project REFORM (PCIN-2017-027) of the Spanish Ministry of Science and Innovation. A. Askarieh acknowledges the Erasmus Mundus Program MEDfOR scholarship offered by the European Commission. The authors would like to thank the reviewers for their constructive and insightful comments that helped to improve this paper.
References
Gscholar
Gscholar
Gscholar
CrossRef | Gscholar
CrossRef | Gscholar
Gscholar
CrossRef | Gscholar
CrossRef | Gscholar
Gscholar
CrossRef | Gscholar
CrossRef | Gscholar
Gscholar
Gscholar
CrossRef | Gscholar
Authors’ Info
Authors’ Affiliation
Irene Ruano 0000-0003-4059-1928
Felipe Bravo 0000-0001-7348-6695
Instituto Universitario de Investigación y Gestión Forestal Sostenible (iuFOR), Unidad Asociada de I+D+i al CSIC, Universidad de Valladolid, Avda. Madrid s/n, 34004 Palencia (Spain)
Irene Ruano 0000-0003-4059-1928
Felipe Bravo 0000-0001-7348-6695
Departamento de Producción Vegetal y Recursos Forestales, ETS de Ingenierías Agrarias, Universidad de Valladolid, Palencia (Spain)
Corresponding author
Paper Info
Citation
Askarieh A, Ruano I, Bravo F (2023). Is it needed to integrate mixture degree in Stand Density Management Diagram (SDMD)?. iForest 16: 274-281. - doi: 10.3832/ifor4005-016
Academic Editor
Emanuele Lingua
Paper history
Received: Oct 25, 2021
Accepted: Aug 21, 2023
First online: Oct 28, 2023
Publication Date: Oct 31, 2023
Publication Time: 2.27 months
Copyright Information
© SISEF - The Italian Society of Silviculture and Forest Ecology 2023
Open Access
This article is distributed under the terms of the Creative Commons Attribution-Non Commercial 4.0 International (https://creativecommons.org/licenses/by-nc/4.0/), which permits unrestricted use, distribution, and reproduction in any medium, provided you give appropriate credit to the original author(s) and the source, provide a link to the Creative Commons license, and indicate if changes were made.

Web Metrics
Breakdown by View Type
Article Usage
Total Article Views: 5681
(from publication date up to now)
Breakdown by View Type
HTML Page Views: 4696
Abstract Page Views: 512
PDF Downloads: 424
Citation/Reference Downloads: 0
XML Downloads: 49
Web Metrics
Days since publication: 182
Overall contacts: 5681
Avg. contacts per week: 218.50
Article Citations
Article citations are based on data periodically collected from the Clarivate Web of Science web site
(last update: Feb 2023)
(No citations were found up to date. Please come back later)
Publication Metrics
by Dimensions ©
Articles citing this article
List of the papers citing this article based on CrossRef Cited-by.
Related Contents
iForest Similar Articles
Research Articles
Age and thinning effects on elemental composition of Pinus pinaster and Pinus radiata needles
vol. 14, pp. 299-306 (online: 08 June 2021)
Review Papers
Should the silviculture of Aleppo pine (Pinus halepensis Mill.) stands in northern Africa be oriented towards wood or seed and cone production? Diagnosis and current potentiality
vol. 12, pp. 297-305 (online: 27 May 2019)
Research Articles
Effects of defoliation by the pine processionary moth Thaumetopoea pityocampa on biomass growth of young stands of Pinus pinaster in northern Portugal
vol. 3, pp. 159-162 (online: 15 November 2010)
Research Articles
Role of serotiny on Pinus pinaster Aiton germination and its relation to mother plant age and fire severity
vol. 12, pp. 491-497 (online: 02 November 2019)
Research Articles
Modeling extreme values for height distributions in Pinus pinaster, Pinus radiata and Eucalyptus globulus stands in northwestern Spain
vol. 9, pp. 23-29 (online: 25 July 2015)
Research Articles
Influence of tree density on climate-growth relationships in a Pinus pinaster Ait. forest in the northern mountains of Sardinia (Italy)
vol. 8, pp. 456-463 (online: 19 October 2014)
Technical Advances
A simplified methodology for the correction of Leaf Area Index (LAI) measurements obtained by ceptometer with reference to Pinus Portuguese forests
vol. 7, pp. 186-192 (online: 17 February 2014)
Research Articles
Long-term implications of traditional forest regulation methods applied to Maritime pine (Pinus pinaster Ait.) forests in central Spain: a century of management plans
vol. 3, pp. 33-38 (online: 02 March 2010)
Research Articles
Tree-oriented silviculture: a new approach for coppice stands
vol. 9, pp. 791-800 (online: 04 August 2016)
Research Articles
The conversion into high forest of Turkey oak coppice stands: methods, silviculture and perspectives
vol. 13, pp. 309-317 (online: 10 July 2020)
iForest Database Search
Search By Author
Search By Keyword
Google Scholar Search
Citing Articles
Search By Author
Search By Keywords
PubMed Search
Search By Author
Search By Keyword


