Influence of climate on tree health evaluated by defoliation in the ICP level I network (Romania)
iForest - Biogeosciences and Forestry, Volume 10, Issue 3, Pages 554-560 (2017)
doi: https://doi.org/10.3832/ifor2202-009
Published: May 05, 2017 - Copyright © 2017 SISEF
Research Articles
Abstract
Defoliation is the main parameter for assessing tree crown conditions, and is the result of cumulative interactions among different types of stressors, including climate, air pollution, pests and diseases, and management systems. Here, we evaluated a long-term data series (1992-2013) provided by the ICP-Forests Level I monitoring network (16 × 16 km) in Romania. Specifically, we investigated how climate influences defoliation at different spatial and temporal levels using statistical analyses. Using periodic climatic data (mean temperature and precipitation) derived from a daily grid dataset (ROCADA) with a resolution of 0.1 × 0.1° (10 × 10 km), we quantified how climatic parameters were correlated with defoliation, which was expressed as the mean tree defoliation per plot (DEF), and the proportion of damaged trees (crown defoliation > 25% - fDEF). The cross-correlation (Spearman r) between defoliation indicators and temperature was positive and relatively constant over time for all broadleaves and conifers, combined and separately, except for Fagus sylvatica (European beech), which had a negative cross-correlation coefficient. The correlation obtained for precipitation was similar to that obtained for temperature; however, this relationship was negative (except, again, for beech). The temporal influence of temperature on defoliation was much lower than that of precipitation, which had the greatest influence in dry regions (south and southeast Romania), especially for Quercus species. Furthermore, precipitation had a positive influence in moderate climate regions for conifers that were situated outside their natural distribution ranges. For beech and conifers situated at the upper altitudinal limits, temperature was negatively correlated with defoliation, i.e., temperature had a positive influence on health status.
Keywords
Climate Change, Defoliation, Tree Species, Forest Health, Temperature, Precipitation, Level I
Introduction
Documentation of the deterioration of Natural Capital components at both the regional and global scale by the international scientific community ([5], [3], [4], [30]) has led decision makers to place strong emphasis on adopting initiatives to stop, or reduce, the rate of biodiversity loss caused by the negative impact of human activities ([3], [17]). Consequently, numerous measures and action plans have been implemented to integrate existing monitoring systems to allow ecosystem status to be assessed, in parallel to adopting new designs based on general guidelines through a “top-down” approach ([18]).
Throughout all terrestrial ecosystems, forests have the highest biodiversity, providing habitats for a wide range of animal and plant species. With their high potential of carbon sequestration, they constitute one of the most important elements of the global carbon cycle. Moreover, forests are the main component of rural development, providing protective functions for soil, water and infrastructure, as well as contributing goods and services to the economic sector ([27]). In parallel, forest ecosystems provide essential socio-ecological and economic benefits that are indispensable for maintaining the quality of life at global, regional, and local levels. These forest ecosystem services can be maintained by ensuring their biodiversity, appropriate health status, stability, functionality, and sustainability through proper forest management ([7], [26], [34], [32]).
Climate change, air pollution and others anthropogenic factors have a dramatic impact on forest ecosystem functions, structure and diversity ([16]), as well as multiple, cumulative effects on the forest health status at local, regional and global scales ([9], [25], [6]). Increasing ozone concentrations and biodiversity loss are also key processes that produce significant changes at the global level, such as increasing average temperatures, as well as causing an increase in the frequency of extreme events, including catastrophic droughts and floods ([22]).
In the last decades, various biotic and abiotic factors causing forest decline have been monitored at the tree, stand and forest levels through several national and international programs ([21], [2]). Most European countries have developed different research/long-term environmental surveys under the program “International Co-operative Programme on Assessment and Monitoring of Air Pollution Effects on Forests” (ICP-Forests) aimed at monitoring the health status of forests. Such monitoring systems, which were formerly focused on the effects of air pollution, had to be revised and reorganized to constitute a “new forest monitoring network” at the European level, using harmonized criteria and indicators of forest health status, and sharing common monitoring methods, in accordance with new environmental issues such as climate change and biodiversity conservation. This unitary approach is expected to ensure good comparability of results for long-term data series.
The health status of trees in forests in Europe is monitored over large areas by surveying the conditions of tree crowns. Indeed, defoliation is the result of cumulative interactions of various stress factors, including climate, air pollution, biotic factors, and management systems. The large-scale forest condition monitoring network (Level I) offers the opportunity to investigate the relationships between tree defoliation and climate, taking into account the large number of species and high spatial variability in their distribution ([10], [31], [15]).
This study aimed to identify the main climatic drivers that have significantly influenced tree defoliation over a 22-year period (1992-2013) in the Level I forest monitoring network (16 × 16 km) of Romania. In particular, we focused on: (i) analyzing long-term defoliation dynamics at the national and regional scale for all tree species, conifers vs. broadleaved species, and the main tree species; (ii) developing statistical analyses of how climate (temperature and precipitation) influences the defoliation of trees; and (ii) analyzing regional and species level variability in detail, based on the statistical relationship between climate and defoliation.
Material and methods
Datasets
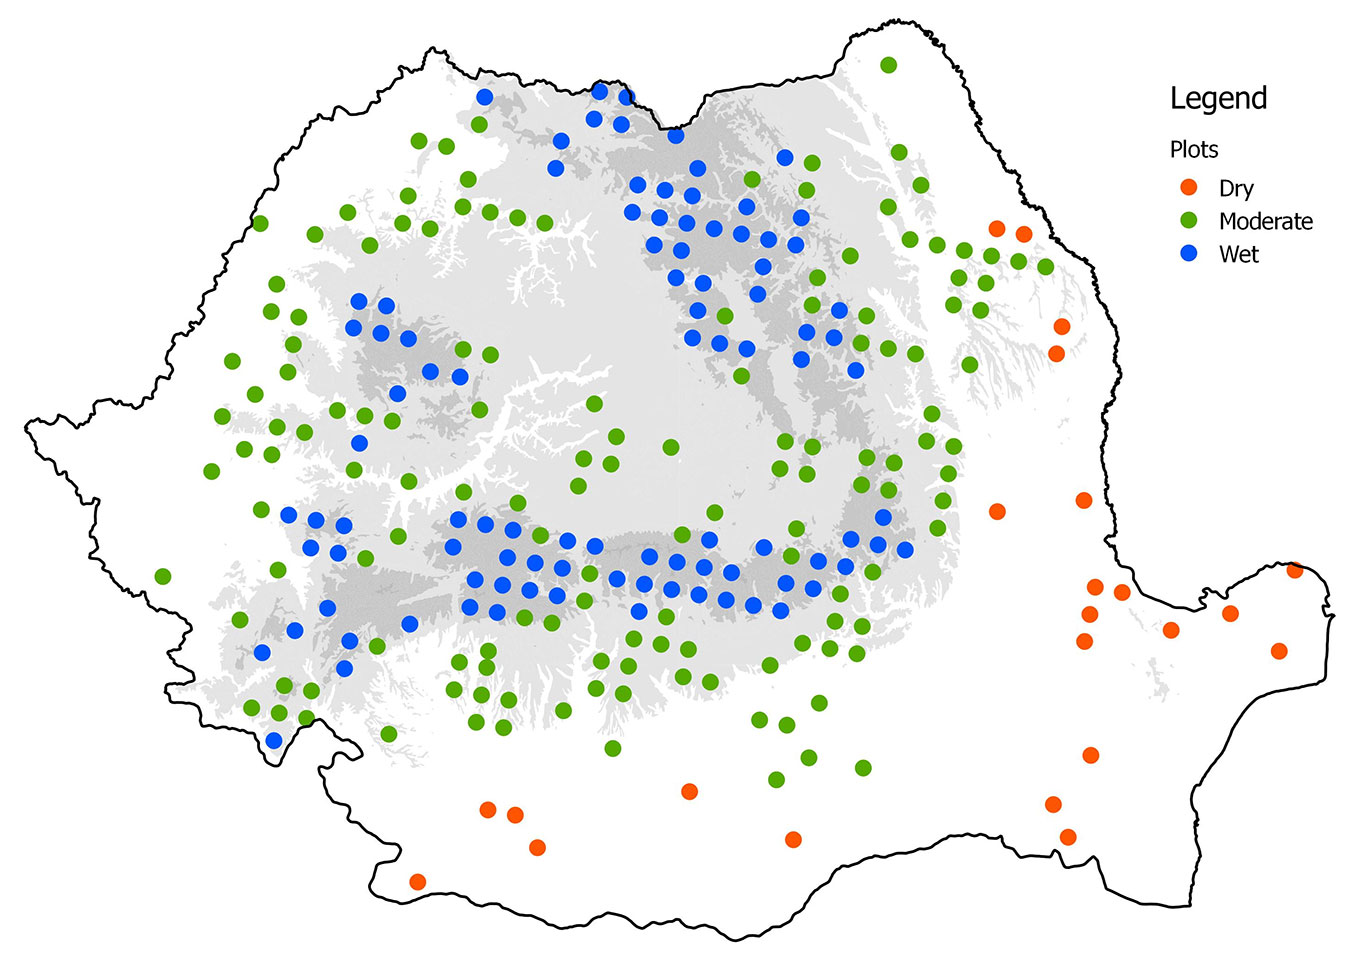
Our dataset contained information on tree crown condition evaluations made across multiple years from 1992 to 2013 (except 2002 and 2008) in the ICP-Forest level I monitoring network (16 × 16 km), which was established in Romanian forests in 1991. In each monitoring plot, 24 predominant, dominant, and co-dominant trees ([20]) were consistently evaluated. Between 215 and 244 plots were monitored annually (Fig. 1). Tree crown defoliation was assessed each year using a common methodology adopted by ICP-Forests ([12], [13]). Based on this information, two defoliation indicators were calculated: the mean tree defoliation per plot (DEF) and the proportion of damaged trees (crown defoliation > 25% - fDEF). These indicators were determined at the plot level for all species, groups of species (broadleaved versus coniferous species), and the main individual species: beech (Fagus sylvatica) oak species (Quercus spp.), and Norway spruce (Picea abies). To ensure there was a minimum sample size for each species (groups of species), a threshold of eight trees per plot was adopted.
Fig. 1 - Romanian ICP-Forest Level I plots network (16 × 16 km) classified according to the De Martonne index (IA).
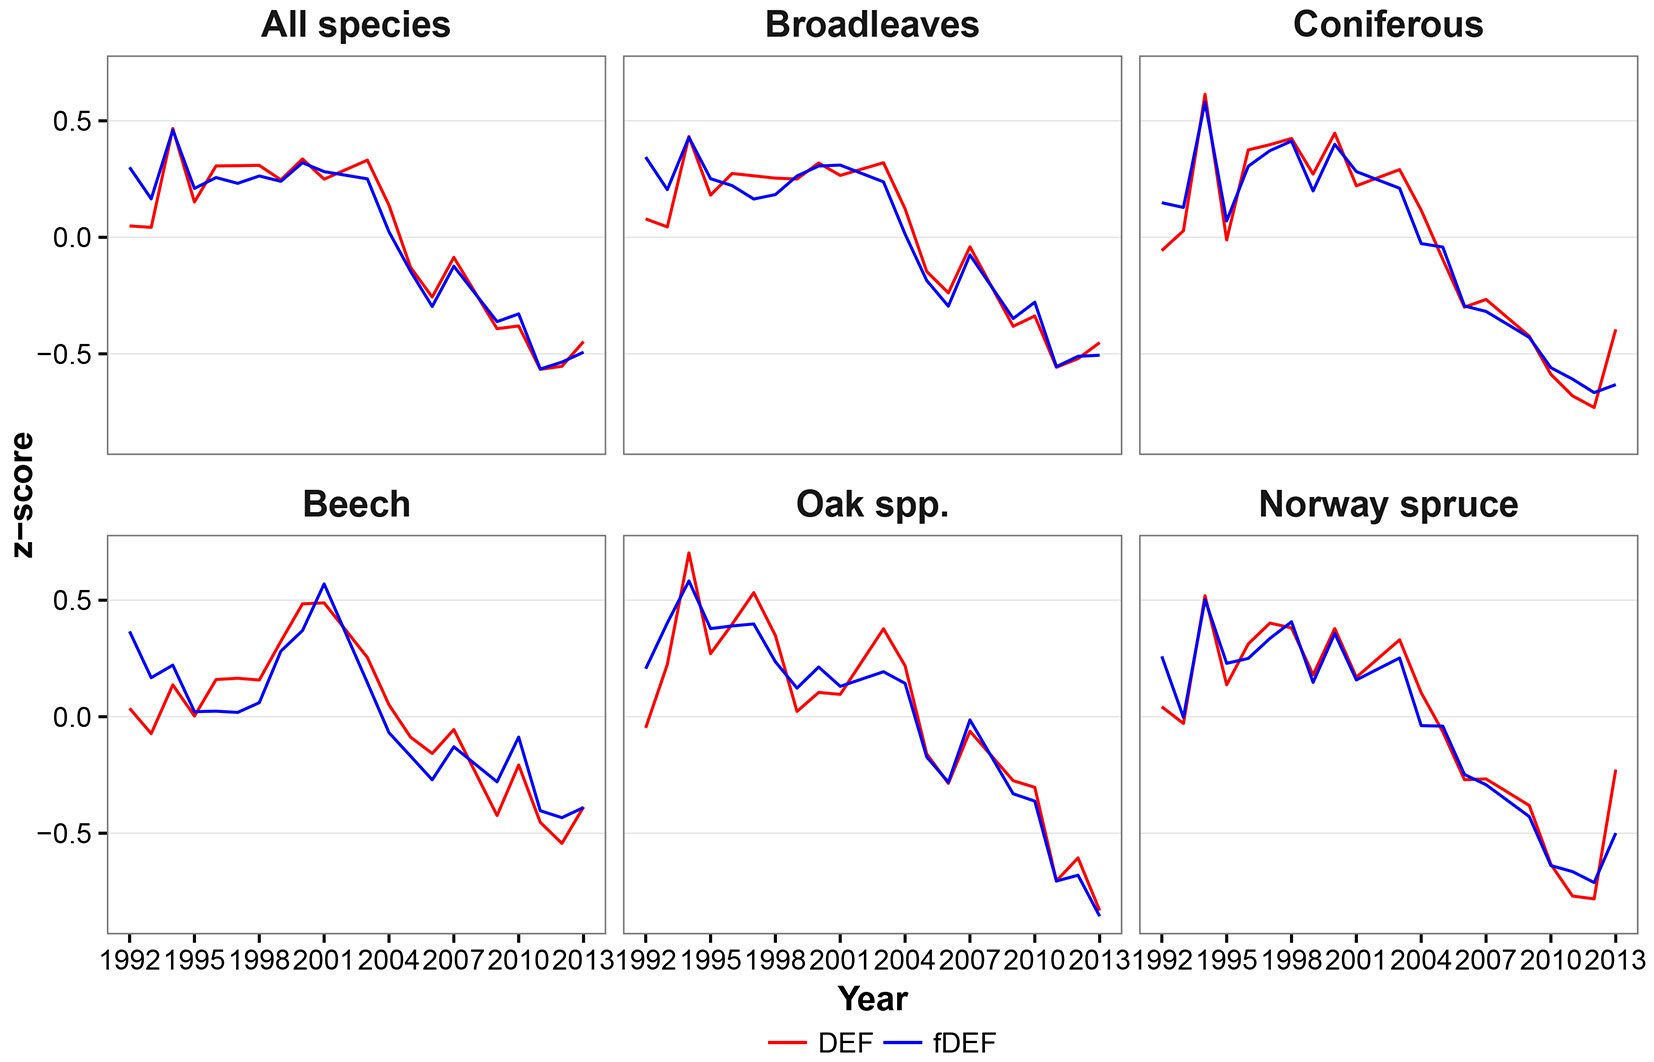
Defoliation indicator datasets include both spatial (cross-sectional) and temporal (longitudinal) gradients as a consequences of different sampling locations and multiple-years evaluations. For the temporal analysis, defoliation indicators were standardized as z-score values based on mean and standard deviation computed at plot level for the 1992-2013 period.
Climatic data
Mean temperature and amount of precipitation were derived from the daily grid dataset ROCADA at a resolution of 0.1 × 0.1° (10 × 10 km - [11]). Averages were computed for three periods: (i) annual mean (previous September until current August - pS_A); (ii) mean of the current growing season (April to August - A_A); and (iii) the mean of the previous growing season (previous April to previous August - pA_pA). Means were calculated from both raw data and z-score values, using the same standardization method described for defoliation indices.
To explore the regional differences within Romania, all plots were classified into three climatic regions according to the annual De Martonne’s index (IA): Dry (IA <26); Moderate (26 ≤ IA ≤ 45); and Wet (IA > 45).
Statistical analysis
Potential trends in defoliation and climate were tested using the non-parametric Mann-Kendall test (Zs). Positive values of Zs indicate increasing trends, while negative Zs values indicate decreasing trends. If Zs < 1 (with p>0.05), then no trend is present in the time series. To quantify the relationship between climatic parameters (temperature and precipitation) and defoliation indicators (DEF and fDEF), the nonparametric Spearman’s correlation coefficient (rs) was used. Cross-sectional analysis was performed for each year and species (groups of species and separate species) using the raw data. The longitudinal analysis used the z-score data, both for defoliation indicators and climate data differentiated in relation to climatic region. All statistical analyses were performed using R software ([33]).
Results
Trends in the defoliation indicators
The defoliation indices considered in this study (DEF and fDEF) had similar trends over the analyzed period (1992-2013). Such general trends did not change when absolute (Fig. 2) or standardized values (Fig. 3) were considered. The maximum defoliation was recorded in the years 1994 and 2000; starting from 2003, a progressive decrease in defoliation and thus a general improvement in forest conditions was observed. The general pattern of variation over time had two components: (i) a relative constant trend until 2002; and (ii) a linear trend with a negative slope starting from 2003. Considering the two components, both defoliation indicators showed a significant negative monotonic trend (Zs = -3.16, p < 0.01 and Zs = -3.44, p < 0.01 for DEF and fDEF, respectively).
Fig. 2 - Fig. 2 - Temporal dynamics of mean defoliation (DEF - red line) and share of damaged trees (fDEF - blue line) based on raw data means.
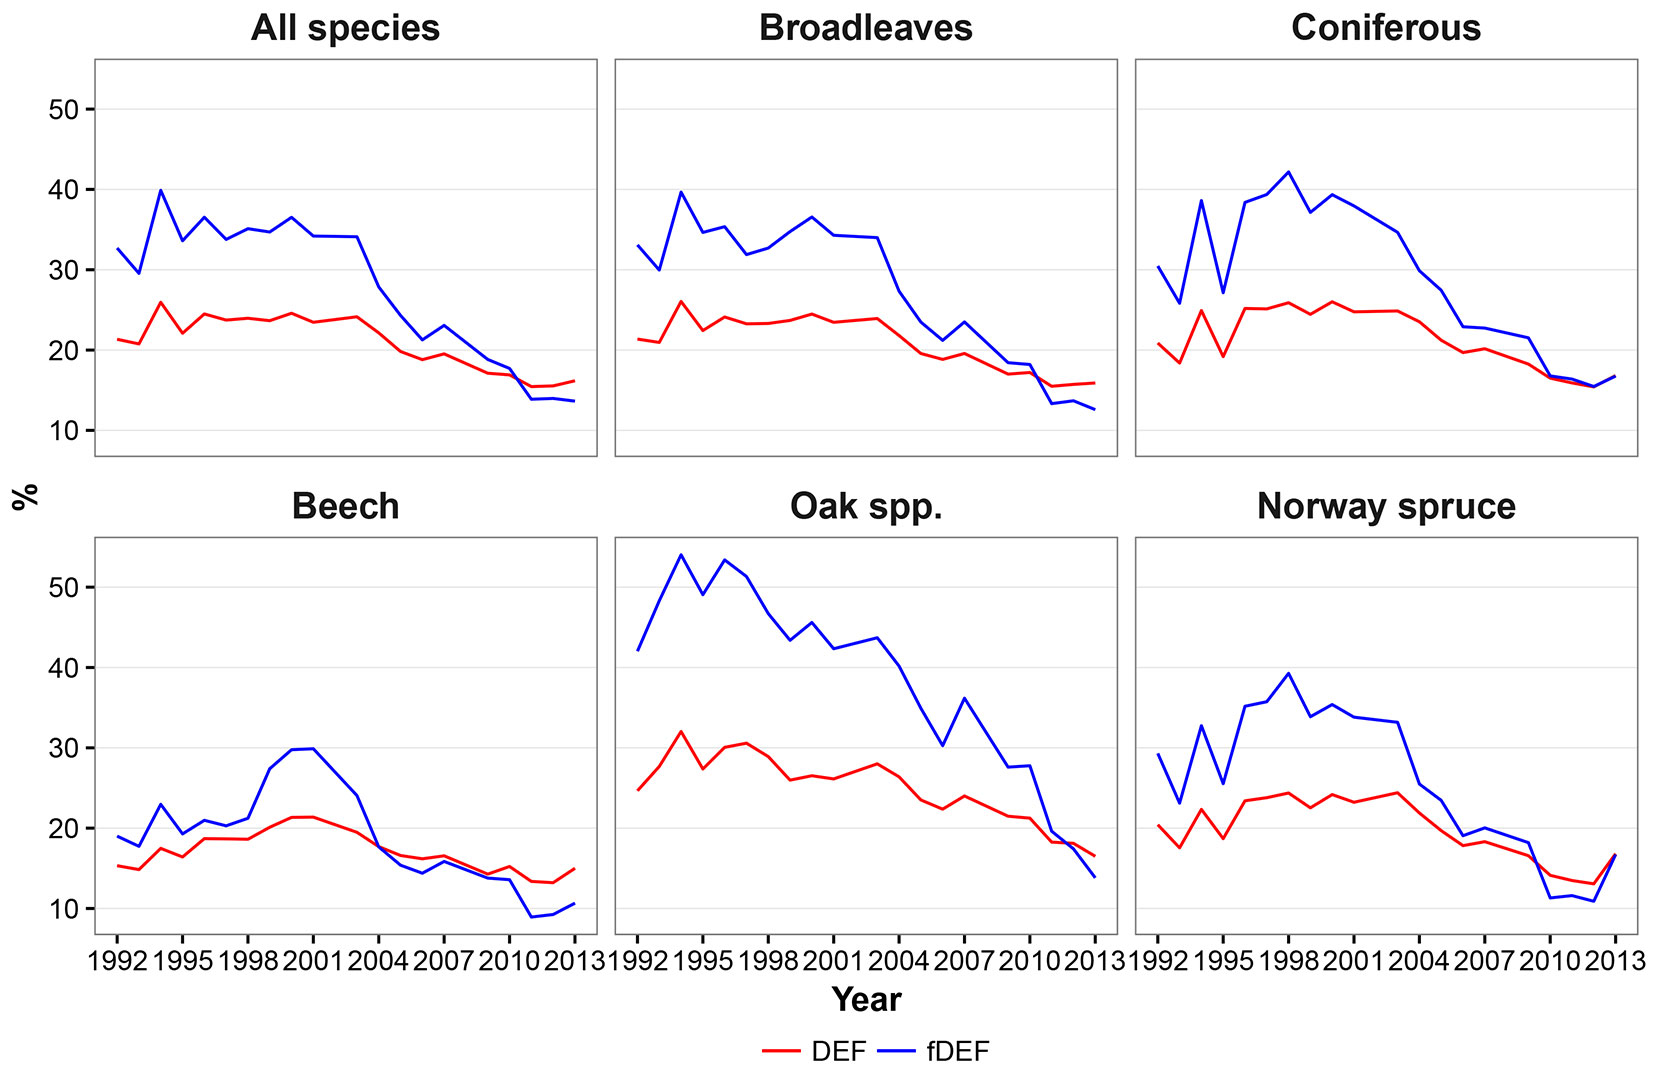
Fig. 3 - Dynamics of relative mean defoliation (DEF) and relative share of damaged trees (fDEF, z-score values).
Both conifer and broadleaved species exhibited an overall decreasing trends in DEF and fDEF over time (p < 0.01 - Fig. 2, Fig. 3). The trends for broadleaved species were very similar to those observed for all species, with a constant pattern being detected until 2003, and a decreasing trend thereafter (Zs = -2.87, p < 0.01 for DEF; Zs = -3.38, p < 0.01 for fDEF). For conifers, the defoliation rate and percentage of damaged trees tended to increase during 1995-1998. After 1998, a constant recovery of tree health status was noticed (up to DEF = 16% in 2013), with this trend being negatively monotonic (Zs = -2.76, p = 0.01 for DEF; Zs = -3.21, p < 0.01). The maximum DEF and fDEF values were recorded in different years for broadleaved and conifers (1994 and 1998, respectively).
At the individual species level, although overall DEF and fDEF trends decreased, patterns in defoliation and the percentage of damaged tree over time differed. Beech had relatively low values for DEF between 1992 and 1998 (around 18%), followed by a deterioration in health status until 2001 (in 2000 and 2001, maximum DEF and fDEF values of 21% and 30% were recorded, respectively); however, the general trend was negative (Zs = -2.2, p = 0.03 for DEF, Zs = -2.48; p = 0.01 for fDEF). An accelerated decreasing trend was observed from 2002 onwards. Oaks had maximum DEF and fDEF values in 1994 (32% and 56%, respectively) and then both health status indicators started to decrease (Zs = -3.44, p<0.01 and Zs=-3.78, p<0.01 for DEF and fDEF, respectively). Yet, oaks were the species that were most affected by climate during the entire study period (Fig. 2, Fig. 3).
During 1992-2000, Norway spruce exhibited large variation in both DEF and fDEF, with high defoliation values alternating with recovery periods, leading to a generally negative trend (Zs = -2.42, p = 0.02 for DEF; Zs = -2.99, p < 0.01 for fDEF). After 2000, the health status of Norway spruce improved (Fig. 2, Fig. 3).
This general pattern was reflected in all species, groups of species, and Norway spruce. However, a continuously decreasing trend was observed for oak species from 1994 onwards. Beech was the healthiest species, showing a slight increase between 1999 and 2002, followed by the same decreasing trend.
Defoliation vs. temperature: spatial correlation analysis
Variation in the cross-sectional correlation (spatial gradient) between defoliation indicators and mean temperature (previous September-current August) was positive and relatively constant over time for all species. Significant values were observed at the start of the study period (1992-1998) and for two individual years (2004 and 2007, rs = 0.133-0.314, p < 0.05 - Tab. 1). For broadleaved species, a similar trend was observed across species, with higher correlation coefficients being detected in 1992-1998 (rs = 0.254-0.385, p < 0.05). Also, in 2004 and 2005, the mean defoliation of broadleaved species was significantly correlated with temperature, with the intensity of this relationship decreasing over time. For conifers, DEF was also positively correlated with temperature; however, significant relationships (rs = 0.274-0.364, p < 0.05) were only detected in the second part of the study period (Tab. 1). The detected significance for the fDEF-temperature correlation was similar to the detected significance for the DEF-temperature correlation for all species, broadleaves and conifers combined.
Tab. 1 - Cross-sectional Spearman’s correlation coefficients (rs) between mean defoliation (DEF), share of damaged trees (fDEF) and annual temperature (pS_A). (*): p<0.05.
| Year | DEF vs. Annual Temperature | fDEF vs. Annual Temperature | ||||||||||
|---|---|---|---|---|---|---|---|---|---|---|---|---|
| All species | Broadleaves | Conifers | Beech | Oak spp. |
Norway spruce | All species | Broadleaves | Conifers | Beech | Oak spp. |
Norway spruce | |
| 1992 | 0.220* | 0.305* | -0.008 | -0.002 | 0.122 | -0.118 | 0.220* | 0.309* | -0.055 | 0.031 | 0.153 | -0.152 |
| 1993 | 0.272* | 0.341* | -0.184 | -0.026 | 0.297 | -0.214 | 0.269* | 0.347* | -0.163 | -0.076 | 0.335 | -0.204 |
| 1994 | 0.314* | 0.385* | 0.152 | -0.119 | 0.008 | 0.041 | 0.292* | 0.371* | 0.104 | -0.105 | 0.159 | -0.034 |
| 1995 | 0.236* | 0.307* | -0.231 | -0.139 | 0.189 | -0.347* | 0.239* | 0.319* | -0.236 | -0.139 | 0.147 | -0.341* |
| 1996 | 0.223* | 0.272* | 0.207 | -0.161 | 0.084 | 0.011 | 0.227* | 0.288* | 0.131 | -0.120 | 0.064 | -0.015 |
| 1997 | 0.196* | 0.254* | 0.283* | -0.259* | 0.105 | 0.064 | 0.179* | 0.270* | 0.164 | -0.205* | 0.146 | -0.019 |
| 1998 | 0.208* | 0.294* | 0.226 | -0.164 | 0.239 | -0.030 | 0.177* | 0.280* | 0.120 | -0.135 | 0.282 | -0.068 |
| 1999 | 0.104 | 0.109 | 0.220 | -0.322* | 0.152 | 0.063 | 0.104 | 0.101 | 0.133 | -0.333* | 0.174 | -0.019 |
| 2000 | 0.080 | 0.103 | 0.255* | -0.296* | 0.200 | 0.064 | 0.094 | 0.102 | 0.225 | -0.326* | 0.177 | 0.041 |
| 2001 | 0.032 | 0.004 | 0.329* | -0.296* | 0.024 | 0.205 | 0.052 | 0.015 | 0.288* | -0.255* | 0.032 | 0.137 |
| 2003 | 0.117 | 0.129 | 0.322* | -0.283* | 0.090 | 0.249 | 0.137* | 0.138 | 0.268* | -0.245* | 0.096 | 0.210 |
| 2004 | 0.133* | 0.169* | 0.342* | -0.190 | -0.071 | 0.220 | 0.160* | 0.178* | 0.373* | -0.167 | -0.076 | 0.195 |
| 2005 | 0.113 | 0.156* | 0.320* | -0.194 | 0.014 | 0.146 | 0.108 | 0.148* | 0.344* | -0.180 | -0.012 | 0.159 |
| 2006 | 0.079 | 0.083 | 0.325* | -0.289* | 0.031 | 0.230 | 0.105 | 0.104 | 0.368* | -0.232* | 0.050 | 0.271 |
| 2007 | 0.139* | 0.129 | 0.247 | -0.250* | -0.064 | 0.229 | 0.166* | 0.169* | 0.279* | -0.222* | -0.095 | 0.315 |
| 2009 | 0.019 | -0.001 | 0.274* | -0.432* | 0.059 | 0.260 | 0.062 | 0.042 | 0.217 | -0.283* | 0.022 | 0.282 |
| 2010 | -0.010 | -0.063 | 0.249 | -0.504* | 0.160 | 0.202 | 0.053 | 0.002 | 0.298* | -0.374* | 0.214 | 0.196 |
| 2011 | 0.005 | -0.044 | 0.294* | -0.465* | 0.185 | 0.274 | 0.011 | -0.036 | 0.339* | -0.407* | 0.148 | 0.407* |
| 2012 | 0.100 | 0.040 | 0.364* | -0.411* | 0.139 | 0.272 | 0.055 | 0.011 | 0.405* | -0.353* | 0.116 | 0.435* |
| 2013 | 0.074 | 0.056 | 0.242 | -0.025 | 0.056 | 0.314* | 0.032 | 0.044 | 0.239 | -0.100 | 0.047 | 0.236 |
At the individual species level, the defoliation-temperature relationship differed to that observed for all species or major species groups. For Fagus sylvatica, both DEF and fDEF were negatively correlated with mean temperature in all years, with significant relationships first being detected from 1997 onwards, except for 1998, 2004, 2005, and 2013 (Tab. 1). In the case of oak species, DEF did not appear to be influenced by temperature in any way. The only significant correlation was that between fDEF and mean temperature in 1993 (rs = 0.335, p < 0.05). The highest fDEF values were recorded after 1993 (Fig. 2).
Norway spruce exhibited a significant correlation between DEF and mean temperature in 1995 (rs = -0.347, p < 0.05) and 2013 (rs = 0.314, p < 0.05). In the case of fDEF, the correlation was stronger, with statistically significant relationships being detected in 1995 and 2011-2012 (Tab. 1).
Defoliation vs. precipitation: spatial correlation analysis
For all species, both DEF and fDEF were negatively correlated with precipitation in all analyzed years, except for 1995, 1997, and 2001 for both indicators and 2009 for DEF and 2011-2012 for fDEF (Tab. 2). Significant values of rs (p < 0.05) ranged between -0.151 (1996) and -0.304 (1992) for DEF, and between -0.144 (1996) and -0.299 (2007) for fDEF. Similar to the defoliation-temperature relationship, broadleaves exhibited the same trend as that detected for all species, with significant negative correlations being recorded in 1992-1996, 1998-2000, 2003-2007, 2010, and 2013 for DEF and in the same years for fDEF, excluding 2010 (Tab. 2). Defoliation indicators for conifers showed a mixed response to precipitation. In the first part of the study period, rs values were mainly positive, but were not significant or very close to zero. From 1995, rs values became statistically significant (rs = 0.310 for DEF and 0.293 for fDEF). From 1999, rs became negative. Statistically significant values were detected in 2000, 2007, and 2010-2013 for DEF and 2000, 2003, 2007, 2010-2011, and 2013 for fDEF (Tab. 2).
Tab. 2 - Cross-sectional Spearman’s correlation coefficients (rs) between defoliation (DEF), share of damaged trees (fDEF) and annual amount of precipitation. (*): p<0.05.
| Year | DEF vs. Precipitation | fDEF vs. Precipitation | ||||||||||
|---|---|---|---|---|---|---|---|---|---|---|---|---|
| All species | Broadleaves | Conifers | Beech | Quercus spp. |
Norway spruce | All species | Broadleaves | Conifers | Beech | Quercus spp. |
Norway spruce | |
| 1992 | -0.304* | -0.401* | 0.026 | -0.003 | -0.561* | 0.077 | -0.284* | -0.374* | 0.025 | 0.089 | -0.528* | 0.088 |
| 1993 | -0.228* | -0.274* | -0.041 | 0.065 | -0.298 | 0.002 | -0.205* | -0.253* | -0.068 | 0.173 | -0.295 | -0.015 |
| 1994 | -0.325* | -0.370* | -0.134 | 0.083 | -0.248 | 0.199 | -0.292* | -0.337* | -0.137 | 0.134 | -0.282 | 0.211 |
| 1995 | -0.075 | -0.157* | 0.310* | 0.240* | -0.032 | 0.402* | -0.081 | -0.163* | 0.293* | 0.252* | 0.056 | 0.407* |
| 1996 | -0.151* | -0.239* | 0.100 | 0.208* | -0.374* | 0.269 | -0.144* | -0.236* | 0.111 | 0.227* | -0.318* | 0.265 |
| 1997 | -0.056 | -0.133 | 0.076 | 0.295* | -0.120 | 0.273 | -0.047 | -0.123 | 0.099 | 0.298* | -0.075 | 0.244 |
| 1998 | -0.210* | -0.323* | 0.044 | 0.065 | -0.424* | 0.235 | -0.189* | -0.313* | 0.067 | 0.040 | -0.418* | 0.266 |
| 1999 | -0.175* | -0.239* | -0.028 | 0.017 | -0.451* | 0.138 | -0.153* | -0.202* | -0.059 | 0.074 | -0.480* | 0.099 |
| 2000 | -0.205* | -0.215* | -0.355* | -0.014 | -0.317* | -0.117 | -0.171* | -0.159* | -0.280* | 0.080 | -0.345* | -0.105 |
| 2001 | -0.108 | -0.140 | -0.011 | -0.026 | -0.239 | 0.179 | -0.075 | -0.095 | 0.031 | -0.003 | -0.205 | 0.261 |
| 2003 | -0.159* | -0.143* | -0.253 | 0.067 | -0.053 | -0.221 | -0.172* | -0.145* | -0.280* | 0.075 | -0.103 | -0.167 |
| 2004 | -0.168* | -0.206* | -0.119 | -0.124 | -0.043 | 0.078 | -0.194* | -0.206* | -0.206 | -0.138 | 0.001 | -0.024 |
| 2005 | -0.138* | -0.183* | -0.055 | 0.003 | -0.208 | 0.138 | -0.172* | -0.209* | -0.119 | -0.110 | -0.124 | 0.061 |
| 2006 | -0.188* | -0.207* | -0.185 | -0.059 | -0.157 | 0.035 | -0.209* | -0.203* | -0.250 | -0.062 | -0.134 | -0.123 |
| 2007 | -0.269* | -0.248* | -0.343* | -0.148 | 0.149 | -0.188 | -0.299* | -0.279* | -0.447* | -0.159 | 0.155 | -0.320* |
| 2009 | -0.128 | -0.131 | -0.176 | -0.043 | 0.089 | -0.014 | -0.158* | -0.146* | -0.216 | -0.112 | 0.140 | -0.031 |
| 2010 | -0.213* | -0.189* | -0.373* | -0.107 | -0.279* | -0.167 | -0.195* | -0.157* | -0.378* | -0.076 | -0.218 | -0.154 |
| 2011 | -0.165* | -0.131 | -0.375* | 0.025 | -0.252 | -0.243 | -0.097 | -0.072 | -0.294* | 0.134 | -0.264 | -0.159 |
| 2012 | -0.162* | -0.112 | -0.328* | 0.134 | 0.052 | -0.202 | -0.117 | -0.103 | -0.225 | 0.125 | -0.068 | -0.137 |
| 2013 | -0.302* | -0.281* | -0.350* | -0.272* | -0.244 | -0.316* | -0.202* | -0.179* | -0.349* | -0.135 | -0.176 | -0.292 |
The defoliation-precipitation relationship for individual species followed the same trends detected for their corresponding species group, except for beech. For this species, both DEF and fDEF were positively correlated with the amount of precipitation during 1995-1997. After 2000, rs values became negative, reflecting the trend detected for the other broadleaved species.
Defoliation vs. climate: temporal correlation analysis
The dry region (southeastern Romania) was characterized by IA < 26 and predominant broadleaved species. In this region, the mean temperature of the previous growing season (t_pA_pA - April to August) was negatively correlated with DEF and fDEF for all species and broadleaved species (Tab. 3, Tab. 4), fDEF was also sensitive to annual mean temperature (t_pS_A - previous September to current August). The correlation between temperature recorded during the previous and current growing seasons and the health of conifers (DEF and fDEF) situated in a dry climate region (outside their natural area) was significantly positive (rs = 0.471 and 0.486, respectively - Tab. 3, Tab. 4).
Tab. 3 - Spearman’s correlation coefficients (rs) between relative mean defoliation (DEF) and climatic variables at the regional level. (*): p<0.05.
| Climate variable |
Region | All species | Broadleaves | Conifers | Beech | Quercus ssp. | Norway spruce |
|---|---|---|---|---|---|---|---|
| t_A_A | Dry | -0.006 | -0.010 | 0.197 | - | 0.005 | - |
| Moderate | -0.120* | -0.119* | -0.145* | -0.085* | -0.154* | -0.066 | |
| Wet | -0.133* | -0.090* | -0.186* | -0.079* | - | -0.213* | |
| p_A_A | Dry | -0.234* | -0.247* | -0.036 | - | -0.439* | - |
| Moderate | -0.087* | -0.073* | -0.143* | -0.057 | -0.034 | -0.189* | |
| Wet | -0.086* | -0.070* | -0.128* | -0.072* | - | -0.117* | |
| t_pS_A | Dry | -0.084 | -0.082 | 0.027 | - | -0.097 | - |
| Moderate | -0.125* | -0.120* | -0.175* | -0.074* | -0.154* | -0.127 | |
| Wet | -0.124* | -0.083* | -0.185* | -0.073* | - | -0.190* | |
| p_pS_A | Dry | -0.274* | -0.295* | 0.020 | - | -0.434* | - |
| Moderate | -0.084* | -0.071* | -0.123* | -0.058 | -0.034 | -0.187* | |
| Wet | -0.091* | -0.080* | -0.122* | -0.085* | - | -0.114* | |
| t_pA_pA | Dry | -0.181* | -0.219* | 0.471* | - | -0.178 | - |
| Moderate | -0.098* | -0.090* | -0.125* | -0.016 | -0.103* | -0.055 | |
| Wet | -0.100* | -0.048 | -0.183* | -0.045 | - | -0.201* | |
| p_pA_pA | Dry | -0.021* | -0.001 | -0.281 | - | -0.050 | - |
| Moderate | -0.104* | -0.094* | -0.187* | -0.079* | -0.132* | -0.214* | |
| Wet | -0.127* | -0.118* | -0.144* | -0.104* | - | -0.149* |
Tab. 4 - Spearman’s correlation (rs) between relative share of damaged trees (fDEF) and climatic variables at the regional level. (*): p<0.05.
| Climate Variable | Region | All species | Broadleaves | Conifers | Beech | Quercus ssp. | Norway spruce |
|---|---|---|---|---|---|---|---|
| t_A_A | Dry | -0.054 | -0.067 | 0.229 | - | -0.043 | - |
| Moderate | -0.137* | -0.129* | -0.175* | -0.093* | -0.148* | -0.105 | |
| Wet | -0.118* | -0.065* | -0.190* | -0.036 | - | -0.216* | |
| p_A_A | Dry | -0.277* | -0.288* | -0.150 | - | -0.415* | - |
| Moderate | -0.081* | -0.080* | -0.079 | -0.085* | -0.044 | -0.105 | |
| Wet | -0.087* | -0.079* | -0.104* | -0.088* | - | -0.101* | |
| t_pS_A | Dry | -0.126* | -0.130* | 0.021 | - | -0.178 | - |
| Moderate | -0.136* | -0.129* | -0.171* | -0.023 | -0.147* | -0.154* | |
| Wet | -0.104* | -0.054 | -0.172* | -0.024 | - | -0.188* | |
| p_pS_A | Dry | -0.312* | -0.334* | 0.012 | - | -0.362* | - |
| Moderate | -0.090* | -0.086* | -0.093 | -0.110* | -0.045 | -0.134 | |
| Wet | -0.097* | -0.094* | -0.111* | -0.107* | - | -0.095* | |
| t_pA_pA | Dry | -0.214* | -0.256* | 0.486* | - | -0.145 | - |
| Moderate | -0.118* | -0.107* | -0.163* | -0.023 | -0.106* | -0.131 | |
| Wet | -0.097* | -0.036 | -0.185* | -0.024 | - | -0.205* | |
| p_pA_pA | Dry | -0.003 | -0.334* | -0.293 | - | -0.001 | - |
| Moderate | -0.104* | -0.086* | -0.143* | -0.109* | -0.112* | -0.148* | |
| Wet | -0.111* | -0.094* | -0.129* | -0.079* | - | -0.122* |
As expected, the precipitation deficit has the greatest influence on the defoliation indicators of all species, broadleaved species, and oaks. The highest Spearman’s correlation coefficients were observed for the precipitation that accumulated during the year (p_pS_A), and precipitation in the current growing season (p_A_A). For conifers situated outside their natural area (dry climate regions) precipitation in the previous and current growing seasons (p_pA_A and p_A_A) had a strong (but non-significant) influence on DEF and fDEF (Tab. 3, Tab. 4).
Precipitation had a similar influence on broadleaved species in the moderate and wet climatic regions (Tab. 3, Tab. 4). For conifers, especially Norway spruce, this influence was slightly higher in moderate than in wet climatic regions. On the other hand, oak species (which are more adapted to dry climates) were less affected by precipitation compared to other broadleaves. In moderate climate regions, where sessile oak (Quercus petraea) is the dominant species, temperature had a minor influence (rs = -0.103 to -0.154, p < 0.05). For beech, the mean temperature in the current growing season (t_A_A) and throughout the entire year (t_pS_A) had a similar minor (but statistically significant) influence in moderate and wet climate regions (Tab. 3, Tab. 4). In general, the crown condition of conifers, and especially Norway spruces situated in wet climate regions, was negatively correlated with temperature indicators, with rs having statistically significant values between -0.188 and -0.216 (Tab. 3, Tab. 4).
Discussion
The defoliation indicators obtained from data collected at the level I plots (16 × 16 km) produced similar trends to those recorded for the national network (4 × 4 km - e% < 2%, p > 0.05), but with higher values ([1]). Also, at the European level, with the exception of Norway spruce, all individual species exhibited an increase in mean defoliation until the mid-1990s; however, defoliation then stabilized until 2013, with the highest levels being recorded in 2004. The overall trend slightly increased for all species from 1991 to 2013 ([23]).
In general, temperature and precipitation had a similar influence on tree health, with a negative relationship being detected for all species and for broadleaved and coniferous species, except beech. The small influence of precipitation on the health status of beech demonstrates that this species grows well both in moderate and wet climate regions. Furthermore, beech is the most stable and healthiest species at a national level ([2]).
Based on our results, at the regional level temperature had a much lower effect on forest health conditions compared to precipitation. In general, the correlation coefficient values were negative, with the highest values being recorded for all species and broadleaved species situated in the dry climate regions. This is mainly due to the temperature recorded in previous growing seasons, which contribute to the development of full foliar buds. A similar trend was detected for Quercus spp., whose defoliation showed negative correlation coefficients with temperature in most cases. This means that an increase of temperature has improved oak tree health, mainly in high hills and sub-mountainous regions (the optimum area for beech).
In conifers, the positive relationship of the observed defoliation with temperature might be explained by the sensitivity of conifers established outside their natural area, especially at low altitude ([2]). Indeed, a negative influence of temperature on tree health was observed for Norway spruce, while precipitation had a positive effect. The positive relationship between temperature and conifer defoliation in dry climate regions reflects the response of trees to thermal stress by reducing foliar biomass. Thus, the loss of needles represents an adaptation mechanism in response to prolonged high temperature ([8]). In the wet climate region, an increase in temperature prolongs the growing season and enhances the vegetation (and crown) condition of conifers situated at the upper altitudinal forest limit. A similar health status was recorded for conifers situated in the moderate climate region, with the influence of temperature being combined with that of precipitation.
Similar relationships between climatic variables and mean tree defoliation have been reported for regions with a similar climate to Romania. For example, in France, Ferretti et al. ([14]) showed that precipitation and precipitation deficits were the factors that were mainly correlated with defoliation changes in ICP Forests Level II RENECOFOR plots. In contrast, in southern Europe, thermal stressors (temperature from April and June of the current and previous years) were the main climatic factors determining an increase in mean defoliation of trees in ICP-Forests level I plots, with synchronized response ([8]). Further, in northern Europe, tree species showed a strong response to both biotic and abiotic factors ([24]) and air pollutants ([28]).
According to the latest IPCC report ([19]), an increase in water deficit and temperature in southern and eastern Romania is likely. Recent studies confirm the trend towards greater aridity in south Romania, with consequences on the stability of agricultural and forestry ecosystems being expected ([29]). An increase in the intensity and frequency of drought will cause the health status of oak species to deteriorate, especially in the southern and southeastern parts of Romania. This phenomenon will have a significant influence on the stability of the forest ecosystem in this region.
Conclusions
In this study the health status of Romanian forests in the period 1992-2013 was analyzed based on data collected at the ICP level I network plots. Similar trends in the intensity of defoliation across years were observe using both the percentage of damaged trees (defoliation > 25%) and the percentage of mean defoliation at the plot level. For all species, groups of species (broadleaves and conifers), and individual species, defoliation was slightly positively correlated with temperature and was negatively correlated with precipitation, except for Norway spruce and European beech. For these two species, temperature had a positive effect on trees within the natural distribution range area and at the upper altitudinal limit. Outside of their natural ranges, precipitation had a slightly positive influence, while temperature had a negative effect on defoliation for both species.
Temperature had a much lower influence on defoliation compared to precipitation. In dry regions (south and southeast), where the most Quercus spp. (except sessile oak) are located, precipitation that accumulated during the previous and current growing seasons had the greatest influence. In these regions, temperature also had a slightly positive influence in the previous growing season. In moderate climate regions, precipitation strongly influenced the health status of Norway spruce and other conifers located outside their natural distributional ranges (i.e., other than in wet climate regions). In these moderate climate regions, temperature had a lower influence on defoliation compared to wet climate regions, and prolonged the growing season, which enhanced the health status of beech, spruce, and other conifers situated at the upper altitudinal range limit of these species. Both precipitation and temperature minimally influenced beech located in the optimum area (i.e., high hills and sub-mountain regions).
Although at the national level raising temperatures and lower precipitation associated with climate change are not limiting factors triggering high levels of defoliation, our research showed an increasing negative effect of prolonged drought on the tree health status in Southern and South-Eastern part of Romania, which can lead in time to losses in the biodiversity of these forest ecosystems.
Acknowledgements
We acknowledge the financial support provided by the Romanian National Authority for Scientific Research and Innovation through Nucleu Programme GEDEFOR (PN09460116), and the technical support provided by the Romanian Public Authority for Forestry, ICP-Forests, National Forest Administration-ROMSILVA, and National Administration for Meteorology. We also thank all the people of the forest monitoring team from INCDS “Marin DrÄcea” for their assistance.
References
Gscholar
Gscholar
CrossRef | Gscholar
Gscholar
Gscholar
CrossRef | Gscholar
Online | Gscholar
Gscholar
Gscholar
Gscholar
Gscholar
Authors’ Info
Authors’ Affiliation
Ovidiu Badea
Diana Silaghi
National Institute for Research and Development in Forestry “Marin Dracea” (INCDS), Eroilor 128, 077190 Voluntari (Romania)
Transilvania” University of Brasov, Universitatii 1, 500068 Brasov (Romania)
Corresponding author
Paper Info
Citation
Popa I, Badea O, Silaghi D (2017). Influence of climate on tree health evaluated by defoliation in the ICP level I network (Romania). iForest 10: 554-560. - doi: 10.3832/ifor2202-009
Academic Editor
Silvano Fares
Paper history
Received: Aug 18, 2016
Accepted: Mar 29, 2017
First online: May 05, 2017
Publication Date: Jun 30, 2017
Publication Time: 1.23 months
Copyright Information
© SISEF - The Italian Society of Silviculture and Forest Ecology 2017
Open Access
This article is distributed under the terms of the Creative Commons Attribution-Non Commercial 4.0 International (https://creativecommons.org/licenses/by-nc/4.0/), which permits unrestricted use, distribution, and reproduction in any medium, provided you give appropriate credit to the original author(s) and the source, provide a link to the Creative Commons license, and indicate if changes were made.

Web Metrics
Breakdown by View Type
Article Usage
Total Article Views: 50732
(from publication date up to now)
Breakdown by View Type
HTML Page Views: 41524
Abstract Page Views: 4070
PDF Downloads: 3892
Citation/Reference Downloads: 26
XML Downloads: 1220
Web Metrics
Days since publication: 3299
Overall contacts: 50732
Avg. contacts per week: 107.65
Article Citations
Article citations are based on data periodically collected from the Clarivate Web of Science web site
(last update: Mar 2025)
Total number of cites (since 2017): 15
Average cites per year: 1.67
Publication Metrics
by Dimensions ©
Articles citing this article
List of the papers citing this article based on CrossRef Cited-by.
Related Contents
iForest Similar Articles
Research Articles
Extreme climatic events, biotic interactions and species-specific responses drive tree crown defoliation and mortality in Italian forests
vol. 17, pp. 300-308 (online: 30 September 2024)
Research Articles
Potential impacts of regional climate change on site productivity of Larix olgensis plantations in northeast China
vol. 8, pp. 642-651 (online: 02 March 2015)
Research Articles
Predicting the effect of climate change on tree species abundance and distribution at a regional scale
vol. 1, pp. 132-139 (online: 27 August 2008)
Research Articles
Impact of climate change on radial growth of Siberian spruce and Scots pine in North-western Russia
vol. 1, pp. 13-21 (online: 28 February 2008)
Research Articles
Seeing, believing, acting: climate change attitudes and adaptation of Hungarian forest managers
vol. 15, pp. 509-518 (online: 14 December 2022)
Research Articles
Is Pinus pinea growth affected by climate change in western Anatolia?
vol. 18, pp. 93-101 (online: 28 April 2025)
Review Papers
Forests and climate change - lessons from insects
vol. 1, pp. 1-5 (online: 28 February 2008)
Review Papers
Impacts of climate change on the establishment, distribution, growth and mortality of Swiss stone pine (Pinus cembra L.)
vol. 3, pp. 82-85 (online: 15 July 2010)
Research Articles
Model-based assessment of ecological adaptations of three forest tree species growing in Italy and impact on carbon and water balance at national scale under current and future climate scenarios
vol. 5, pp. 235-246 (online: 24 October 2012)
Research Articles
Impact of climate change on tree-ring growth of Scots pine, common beech and pedunculate oak in northeastern Germany
vol. 9, pp. 1-11 (online: 13 October 2015)
iForest Database Search
Search By Author
Search By Keyword
Google Scholar Search
Citing Articles
Search By Author
Search By Keywords
PubMed Search
Search By Author
Search By Keyword


