
Potential impacts of regional climate change on site productivity of Larix olgensis plantations in northeast China
iForest - Biogeosciences and Forestry, Volume 8, Issue 5, Pages 642-651 (2015)
doi: https://doi.org/10.3832/ifor1203-007
Published: Mar 02, 2015 - Copyright © 2015 SISEF
Research Articles
Abstract
Climate change is expected to substantially affect forest site productivity. However, its effects may vary depending on the climate scenario, region and tree species. We chose Larix olgensis in northeast China to investigate the responses of forest site productivity to regional climate change using a generalized additive model (GAM). Based on site index data and climate variables from 335 townships across the Jilin Province, we developed a climate-sensitive forest site index model, which accounted for 72.9% of the variation in the site index at the referred age of 20 (SI20). Our results indicated that climatic and geographic factors significantly affect forest site productivity. The geographic location, mean annual temperature, mean annual precipitation and mean temperature differential were found to be statistically significant explanatory variables. We predict that the change of mean SI20 would vary from 0.3 m to -0.8 m (2.2% to -5.9%) by 2050 and from 0.5 m to -1.6 m (3.7% to -11.8%) by 2070 under three BC-RCP scenarios with rising temperature and increasing precipitation. Our study suggests that climate is an important factor affecting forest site productivity. Future climate changes could affect the forest site productivity both positively and negatively for Larix olgensis in northeast China. The relationship between climate and forest site productivity has strong implications for adaptive forest management and needs to be considered in forest management planning under future climate change.
Keywords
Site Productivity, Climate Change, Potential Impacts, Larix Olgensis
Introduction
Understanding how climate change affects forest site productivity is of great importance for adaptive forest management under climate change conditions. Forest site productivity, as a quantitative estimate of the potential for producing plant biomass at a site, is a significant indicator of forest quality, as well as an important variable of forest growth models in forest management ([52]). However, site productivity presents great spatial and temporal variability ([53]). Climate change directly or indirectly affects forest productivity due to rising atmospheric CO2 concentration and temperatures, changes in the amount and timing of precipitation and the interactions of forest ecosystems ([27], [35]). Experiments, observations and models indicate that the forest productivity changes with climate change, but the direction and magnitude of the effects are still uncertain ([35]). Using dominant height as a measure of site productivity, Bontemps et al. ([7]) reported an increase of more than 50% in common beech at the end of the 20th century in north-eastern France, whereas Badeau et al. ([6]) found an increase of 27%. Charru et al. ([12]) found an increase of 27.8% in stand basal area increment between 1977 and 1987, and a decrease of approximately 5% between 1987 and 2004. Both positive and negative estimated impacts on forest growth have been reported depending on the climate scenarios employed ([33]).
One of the most widely used indicators of forest site productivity in forest management is the site index (SI), which is the mean height of the dominant trees growing on a site at a reference age ([11], [52]). The site index is assumed to be constant over time, and thus included as a driving variable in forest growth and yield models. In reality, the site index often varies greatly due to changes in the genetic make-up of stands, climatic conditions and management practices ([39], [57], [59]). Empirical models have been developed to estimate the site index from climate, soil and vegetation information, thus allowing the possibility of predicting changes in the site index, forest growth and forest yield under climate change ([38], [43], [40], [41], [3], [2], [45]). The climate variables that influence the site index vary with species and sites, as do the magnitude of these variables ([37]). Nigh et al. ([43]) developed climate-sensitive site index models of three species (spruce, lodgepole pine and Douglas fir) in the interior of British Columbia, Canada. They found that the site index for all species increased as the temperature rose, and that site index increased with precipitation for the two latter species. Monserud et al. ([40]) found that the strongest linear predictors of site index for lodgepole pine were growing with degree days > 5 °C (the Julian date when degree days > 5 °C reaches 100) and the July mean temperature. They also found that climate could explain approximately one quarter of the variation in the lodgepole pine site index within the Alberta Province. Nothdurft et al. ([45]) observed that only the site index of Douglas fir continuously improved with increasing total precipitation over the growing season, while it reached an optimum value for other tree species.
A variety of modeling approaches have been successfully applied to predict the site index from climate and other environmental variables. For instance, studies have used parametric modeling, such as multiple linear and nonlinear regressions ([13], [38], [43], [40], [8], [49]), as well as non-parametric modeling, such as classification and regression trees ([1], [4]), generalized additive models ([3], [1], [2]), artificial neural networks and boosted regression trees ([1], [2]). After comparing the performance of five modeling techniques, Aertsen et al. ([2]) concluded that non-parametric models, such as Generalized Additive Models (GAM), were superior to traditional multiple linear regression in site index predictions. In contrast to some modeling methods, GAM does not make a prior assumption about underlying relationships. The shape of the smoothing function is data-driven and allows for the visualization of the additive effect of each predictor variable on the dependent variables ([19], [60]).
Larch is one of the most common and widely employed commercial plantation tree species in China. It comprises 6.83% of the area and 7.15% of the volume of forests over the country ([54]). Changbai larch (Larix olgensis) is mainly distributed in northeast China. According to previous tree-ring studies, larch is one of the tree species most sensitive to climate change ([17]). Consequently, climate change may have impacts on forest site productivity and on corresponding management decision-making, such as classifying sites as mature age and rotation age. Assessing the effects of climate change on site productivity of larch has not been explored yet, though such information is needed for future adaptive management.
The objectives of this study are to develop a climate-sensitive site index model by investigating the relationship between forest site productivity of Changbai larch and regional climate change, as well as to predict the response of forest site productivity to future climate change.
Material and methods
Study area and data collection
The Jilin Province is located in the mid northeastern China (40° 52′ - 46°18′ N, 121° 38′ - 131° 19′ E - Fig. 1), and is one of the most important forest regions of the country. This area belongs to the temperate continental monsoon climate type with four distinct seasons. The mean temperature is > 23 °C in the summer and < -11°C in winter. The annual frost-free period is approximately 100 to 160 days. The average annual precipitation is approximately 400 to 600 mm, mostly concentrated in the summer.
Fig. 1 - Distribution of sampling sites and climate stations used in the study. The “high-low” scale refers to the elevation (m a.s.l.).
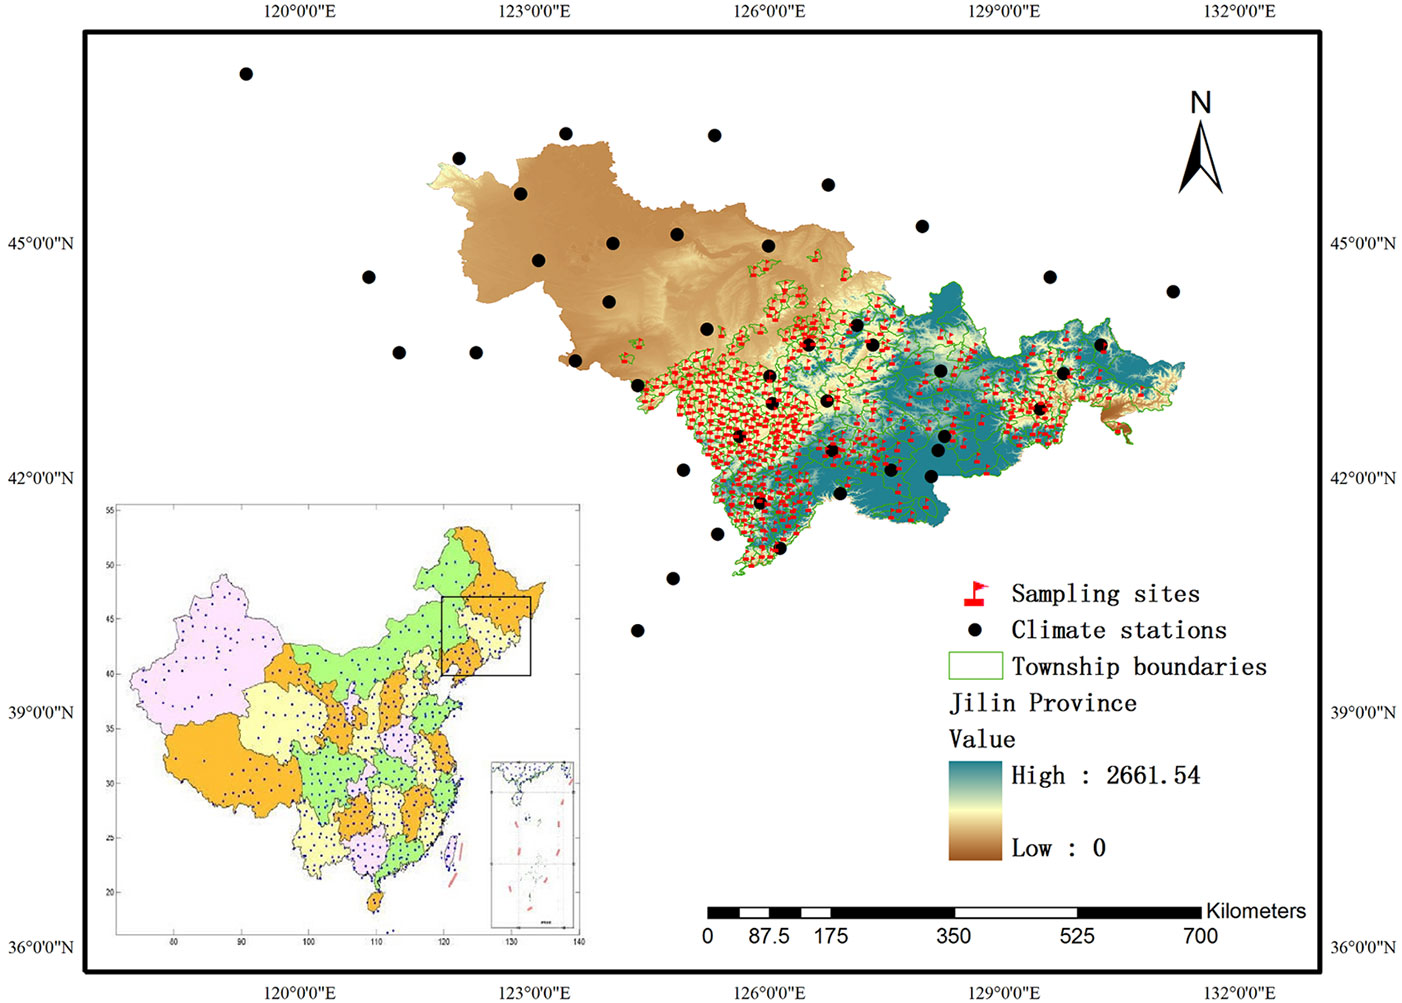
Site index data were taken from a previous study already published ([31]). In 1999, we set 335 temporary rectangular plots of 0.06 ha across 335 townships of the Jilin Province spread over the distribution area of Changbai larch plantations (Fig. 1). In each plot, five dominant trees were selected and their height and age were recorded. Tree age was taken from subcompartment documents. The summary statistics of the trees’ height and age are displayed in Tab. 1. Based on stand age and average dominant height, a site index model was created by the guide curve method ([36]) using the software package FORSTAT (a professional forestry statistics software developed by the Chinese Academy of Forestry - [55]). We randomly chose 80% of the data for model calibration and the remaining 20% for model validation. Finally, the site index of all plots predicted by the model was used as a driving variable in modeling the relationship between the site index and climate.
Tab. 1 - Summary statistics of dominant tree age-height for Larix olgensis plots analyzed in this study. (STD): standard deviation; (CV): coefficient of variation.
| Variable | Min | Max | Mean | STD | CV |
|---|---|---|---|---|---|
| Age (yrs) | 6 | 56 | 22.9 | 6.48 | 0.283 |
| Height (m) | 3.5 | 22.3 | 13.7 | 3.19 | 0.233 |
Basic climate data were provided by the China Meteorological Data Sharing Service System ([16]). To assign climate variables to each plot, geographic and basic meteorological data from 1961 to 2010 (latitude, longitude and altitude, daily and monthly mean temperature, minimum and maximum temperature, precipitation, radiation hours and relative humidity) were first collected from 43 weather stations spread within and around the Jilin Province. Climate data were then spatially interpolated to obtain values for every site in the province based on its elevation and geographic location. To this purpose, we used the professional spatial interpolation software ANUSPLIN® v. 4.36 based on the FORTRAN programming language and developed at the Australian National University ([23]). The working principle of the software derives from ordinary thin plate and partial thin plate smoothing for multi-data interpolation ([23]). We used a high-quality digital elevation model (DEM) in this study, obtaining a resolution of interpolated values of 300 m. The variables subjected to interpolation were monthly and annual mean temperature, mean minimum temperature, mean maximum temperature, total precipitation, total radiation hours, mean relative humidity and the accumulated temperature above 5°C during the growing season. Using all the monthly climate data, we could calculate the annual climate parameters over the period 1961-2010, thereby the climate change in recent decades could be analyzed on a 300×300 m grid. The generalized cross validation (GCV) method was applied on the spatially-interpolated climate dataset, revealing a high accuracy of simulations. Such spatially-interpolated dataset was then used in the analyses of climate change and in the modeling of climate-sensitive site index.
Tab. 2 - Descriptive statistics for candidate climate variables used in the model simulation. (STD): standard deviation; (CV): coefficient of variation.
| Label | Variable description | Units | Mean | STD | CV | Min | Max |
|---|---|---|---|---|---|---|---|
| MAT | mean annual temperature | °C | 4.9 | 1.12 | 0.229 | -0.4 | 8.1 |
| AMAXT | annual maximum temperature | °C | 19.2 | 1.04 | 0.054 | 13.9 | 21.2 |
| AMINT | annual minimum temperature | °C | -9.4 | 1.41 | -0.150 | -15.3 | -5.2 |
| MTWM | mean maximum temperature in the warmest month | °C | 21.5 | 1.32 | 0.061 | 16.7 | 23.7 |
| MTCM | mean minimum temperature in the coldest month | °C | -16.0 | 1.21 | -0.076 | -20.7 | -11.8 |
| GSMAXT | mean maximum temperature during growing season | °C | 35.3 | 1.04 | 0.029 | 30.64 | 38.2 |
| GSMINT | mean minimum temperature during growing season | °C | -11.9 | 1.90 | -0.160 | -20.24 | -6.9 |
| MTD | mean temperature differential | °C | 28.6 | 0.75 | 0.026 | 26.1 | 30.1 |
| GSAT | accumulated temperature higher than 5 °C during growing season | °C | 2928 | 228.87 | 0.078 | 2038 | 3320 |
| MAP | mean annual precipitation | mm | 691 | 77 | 0.111 | 542 | 901 |
| GSP | mean precipitation during growing season | mm | 99 | 10 | 0.101 | 79 | 132 |
| MR | mean annual radiation hours | h | 2388 | 80.6 | 0.034 | 2259 | 2665 |
| GSR | mean radiation hours during growing season | h | 215 | 9.3 | 0.043 | 195 | 240 |
| MRH | mean annual relative humidity | % | 71 | 1.8 | 0.025 | 65 | 78 |
| GSRH | mean relative humidity during growing season | % | 70 | 1.9 | 0.027 | 64 | 74 |
The candidate climatic variables for later model calibration are listed in Tab. 2. They were calculated as the mean annual values from the planting to the inventory year for the climate-sensitive site index model (eqn. 1).
where A is an N×N matrix called the influence matrix; W is the diagonal matrix with N×N; trace(I-A) is the number of effective degrees of freedom (EDF); MSR is the weighted mean residual sum of squares; MSE is the mean square error of the fitted function; σ2 is the variance.
To analyse the shifts in site index values due to changing climatic conditions, the SI of each plot in the reference period 1961-1999 was compared with that predicted for the period 2041-2080. Then the climate-sensitive model was applied under three Representative Concentration Pathways (RCPs) which are the most recent GCM (Global Climate Models) projections used in the Fifth Assessment IPCC report ([42]). The three RCPs included (i) a mitigation scenario leading to a very low forcing level (RCP2.6); (ii) a medium stabilization scenario (RCP6.0); and (iii) a very high-baseline emission scenario (RCP8.5 - [42], [58]). These future climate data were obtained with a resolution of 1×1 km in BCC-CSM1-1 for the time periods 2050 (average for 2041-2060) and 2070 (average for 2061-2080) from the dataset of the World Climate Research Programme (⇒ cmip-pcmdi.llnl.gov/cmip5/).
Site index equation
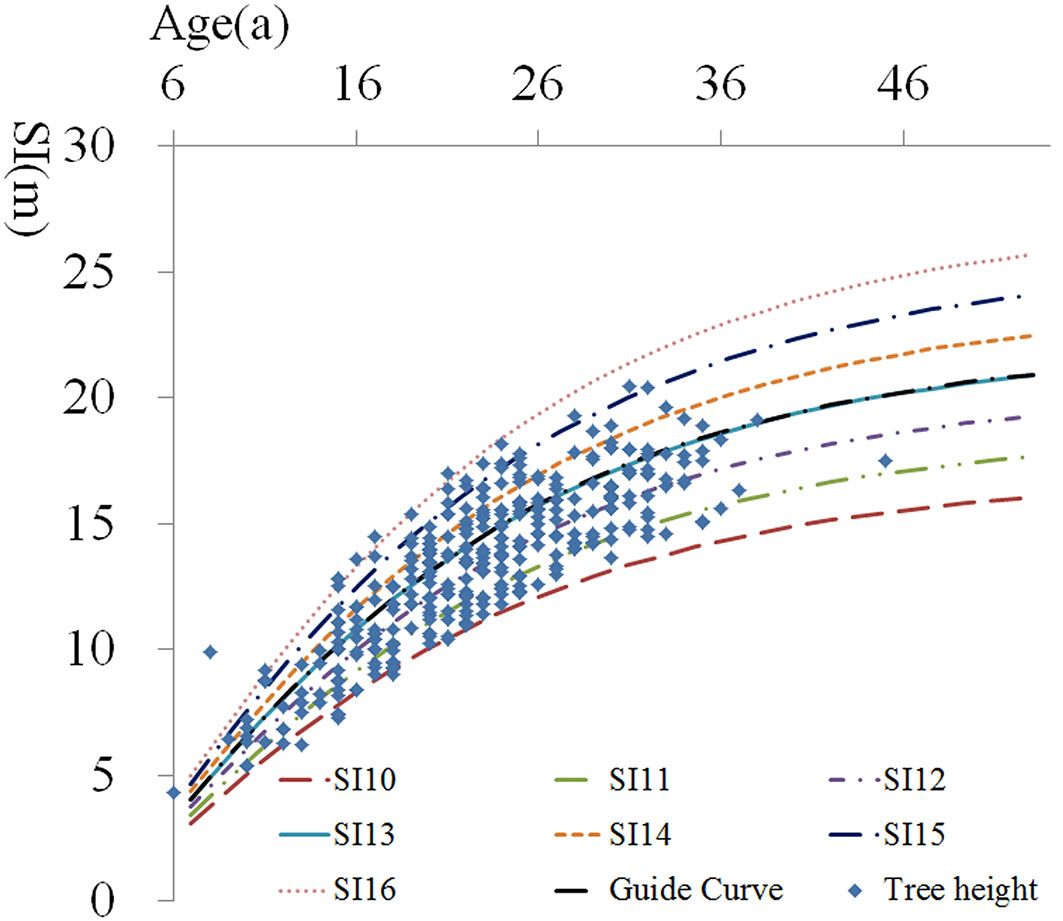
A guide curve method was utilized for estimating the site index values from the mean dominant height and age. Five widely used and highly flexible growth functions, including the Logistics model, the Richards model, the Levakvic model, the Gompertz model and the Hossfeld model, were selected and calibrated for the development of a guide curve. According to model performances, the Richards model was adopted as the guide curve. The final model equation was (eqn. 2):
where SIt0 is the site index at the reference age t0, which was 20 in this study ([31]), indicated as SI20 henceforth; Ht is the stand dominant height at the age t. The coefficient of determination obtained for the above equation was R2 = 0.86. No significant differences were found between the predicted and observed values after validation test (p > 0.05). The absolute and percent root mean square error (RMSE) values of the model obtained were 0.23 m and 0.017, respectively. We also verified the model reliability through a placement test, that showed that 99.7% of the values are within the interval of site index curves (Fig. 2). The SI20 of each site analyzed was estimated from the eqn. 2.
Fig. 2 - Site index curves and placement test.
Climate-sensitive site index
Generalized Additive Models (GAM) are powerful tools making use of smooth functions that can adequately describe complex, possibly nonlinear relationships in ecology ([22], [5]). In this study, we selected GAM to develop a climate-sensitive site index model based on the estimated SI20 values and the climatic variables from 1961 to 1999 shown in Tab. 2. We also introduced the geographical location (latitude, longitude) as an additional predictor to model a spatial trend, which is assumed to be a proxy for other variables showing regional autocorrelation and not explicitly included in the model ([3]). We excluded from the training set 11 plots with less than 15 years of age because the site index is imprecise for very young stands ([59]). The generalized additive model adopted to represent the relationships between the site index, climate variables and spatial variation was (eqn. 3):
where SI20 is the site index; β0 is the intercept; fi and fj are smooth functions of climate variables (i = 1 to k) and geographic location, respectively; and ε is the random error. All computations were carried out using the MGCV package in the R platform ([60], [51]). The MGCV uses generalized cross validation for the model selection, producing a statistically defensible degree of smoothing, which avoids over-fitting and lowers the computing cost. The GCV value or score could be considered as an estimate of the mean square prediction error based on a leave-one-out cross validation estimate process ([15]). The optimal roughness of the smooth terms was determined by minimizing the GCV value. A model with a lower GCV value has more explanatory power and is preferred to models with higher values. The values of F-statistic calculated from the GAM indicated the relative importance of independent variables to the site index. Multi-collinearity of explanatory variables was tested by calculating the variance inflation factor (VIF), and correlated climate variables showing VIF > 5 were discarded. Because of multiple testing, Bonferroni correction was applied for statistical significance. Model residuals were also examined graphically to check that model assumptions were not violated. Climate variables were obtained from spatially interpolated climatic data estimated as described above.
Results
The climate change of Jilin Province from 1961 to 2010
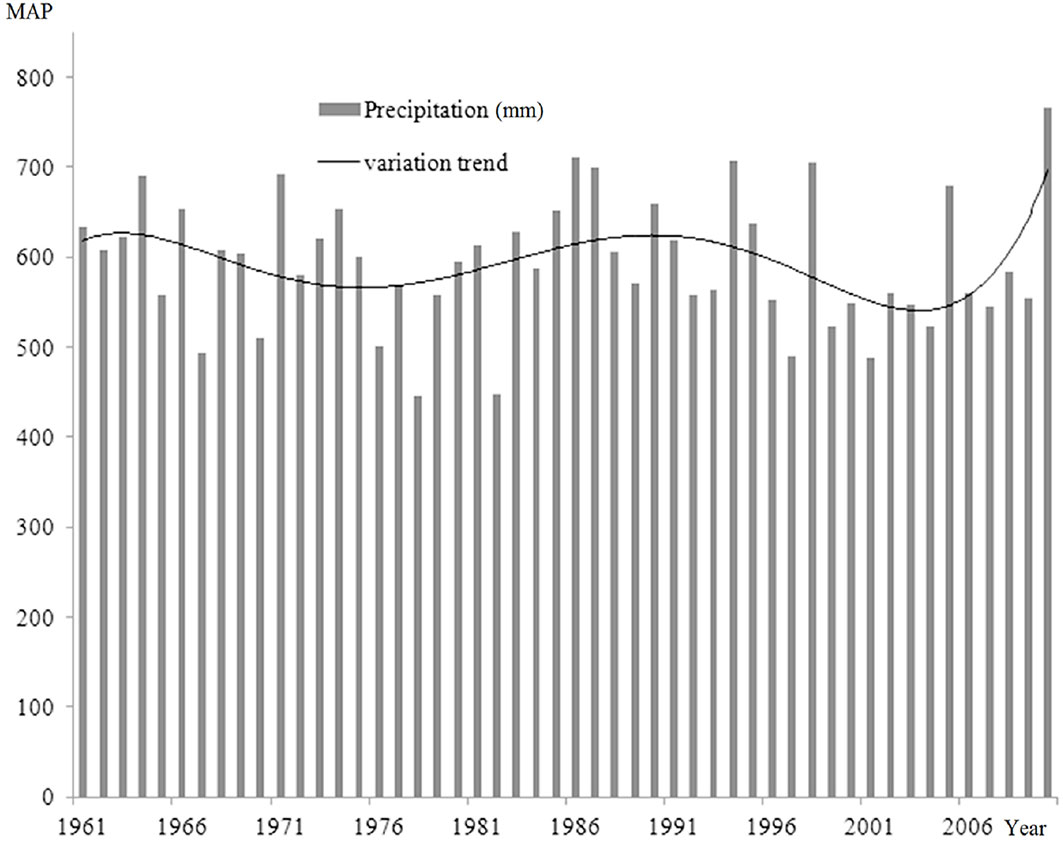
Fig. 3 and Fig. 4 show the changes in mean annual temperature (MAT) and precipitation (MAP), respectively, obtained for the Jilin Province over the period 1961-2010 using the interpolated dataset. A fluctuating, rising trend of MAT was observed, whose increase was even more obvious when MAT values were averaged over the last five decades. Contrastingly, mean annual precipitation varied in the same period from 500 to 700 mm, with no prevalent trends. Nonetheless, a sharp increase of precipitation was detected in the latest decade after a significant reduction. These results agree with previous studies on climate change in the northeast region of China ([61], [50], [56]), which predicted that temperature precipitation would both increase in northeast China in the 21st century based on IPCC climate scenarios and other prediction models.
Fig. 3 - Mean annual temperature (MAT) trend from 1961 to 2010 in the Jilin Province (NE China).
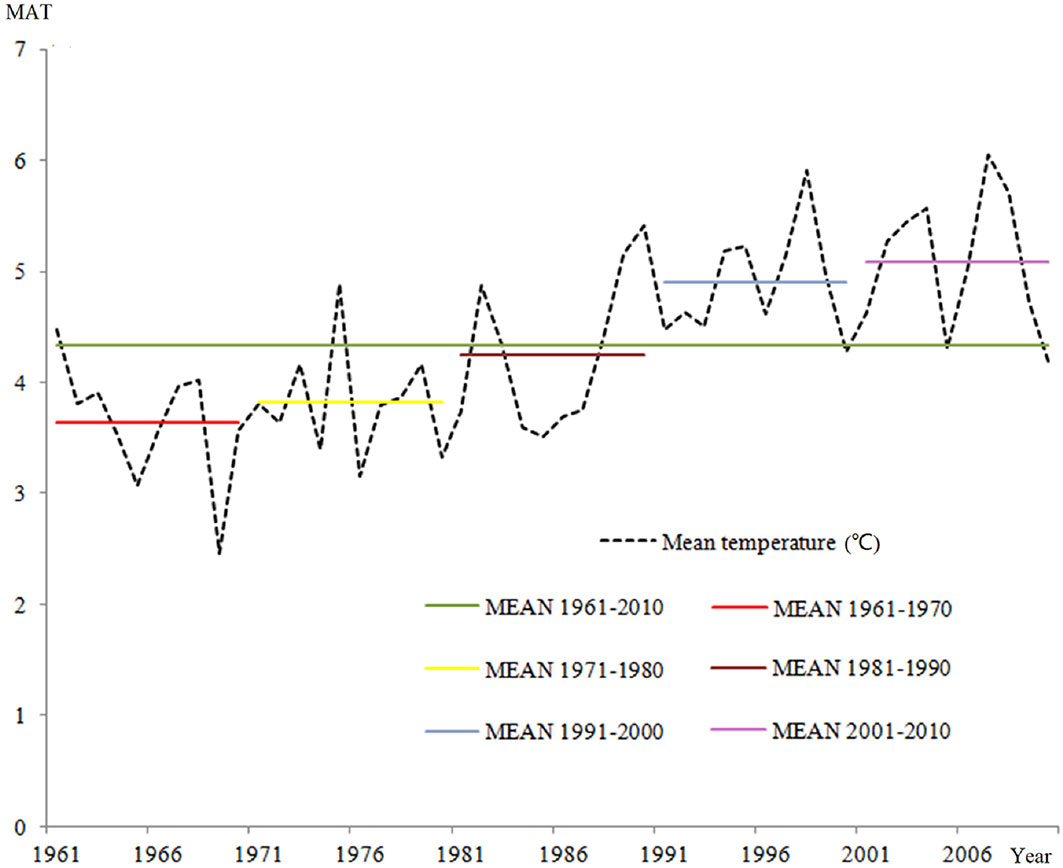
Fig. 4 - Mean annual precipitation (MAP) trend from 1961 to 2010 in the Jilin Province (NE China).
Climate-sensitive site index model
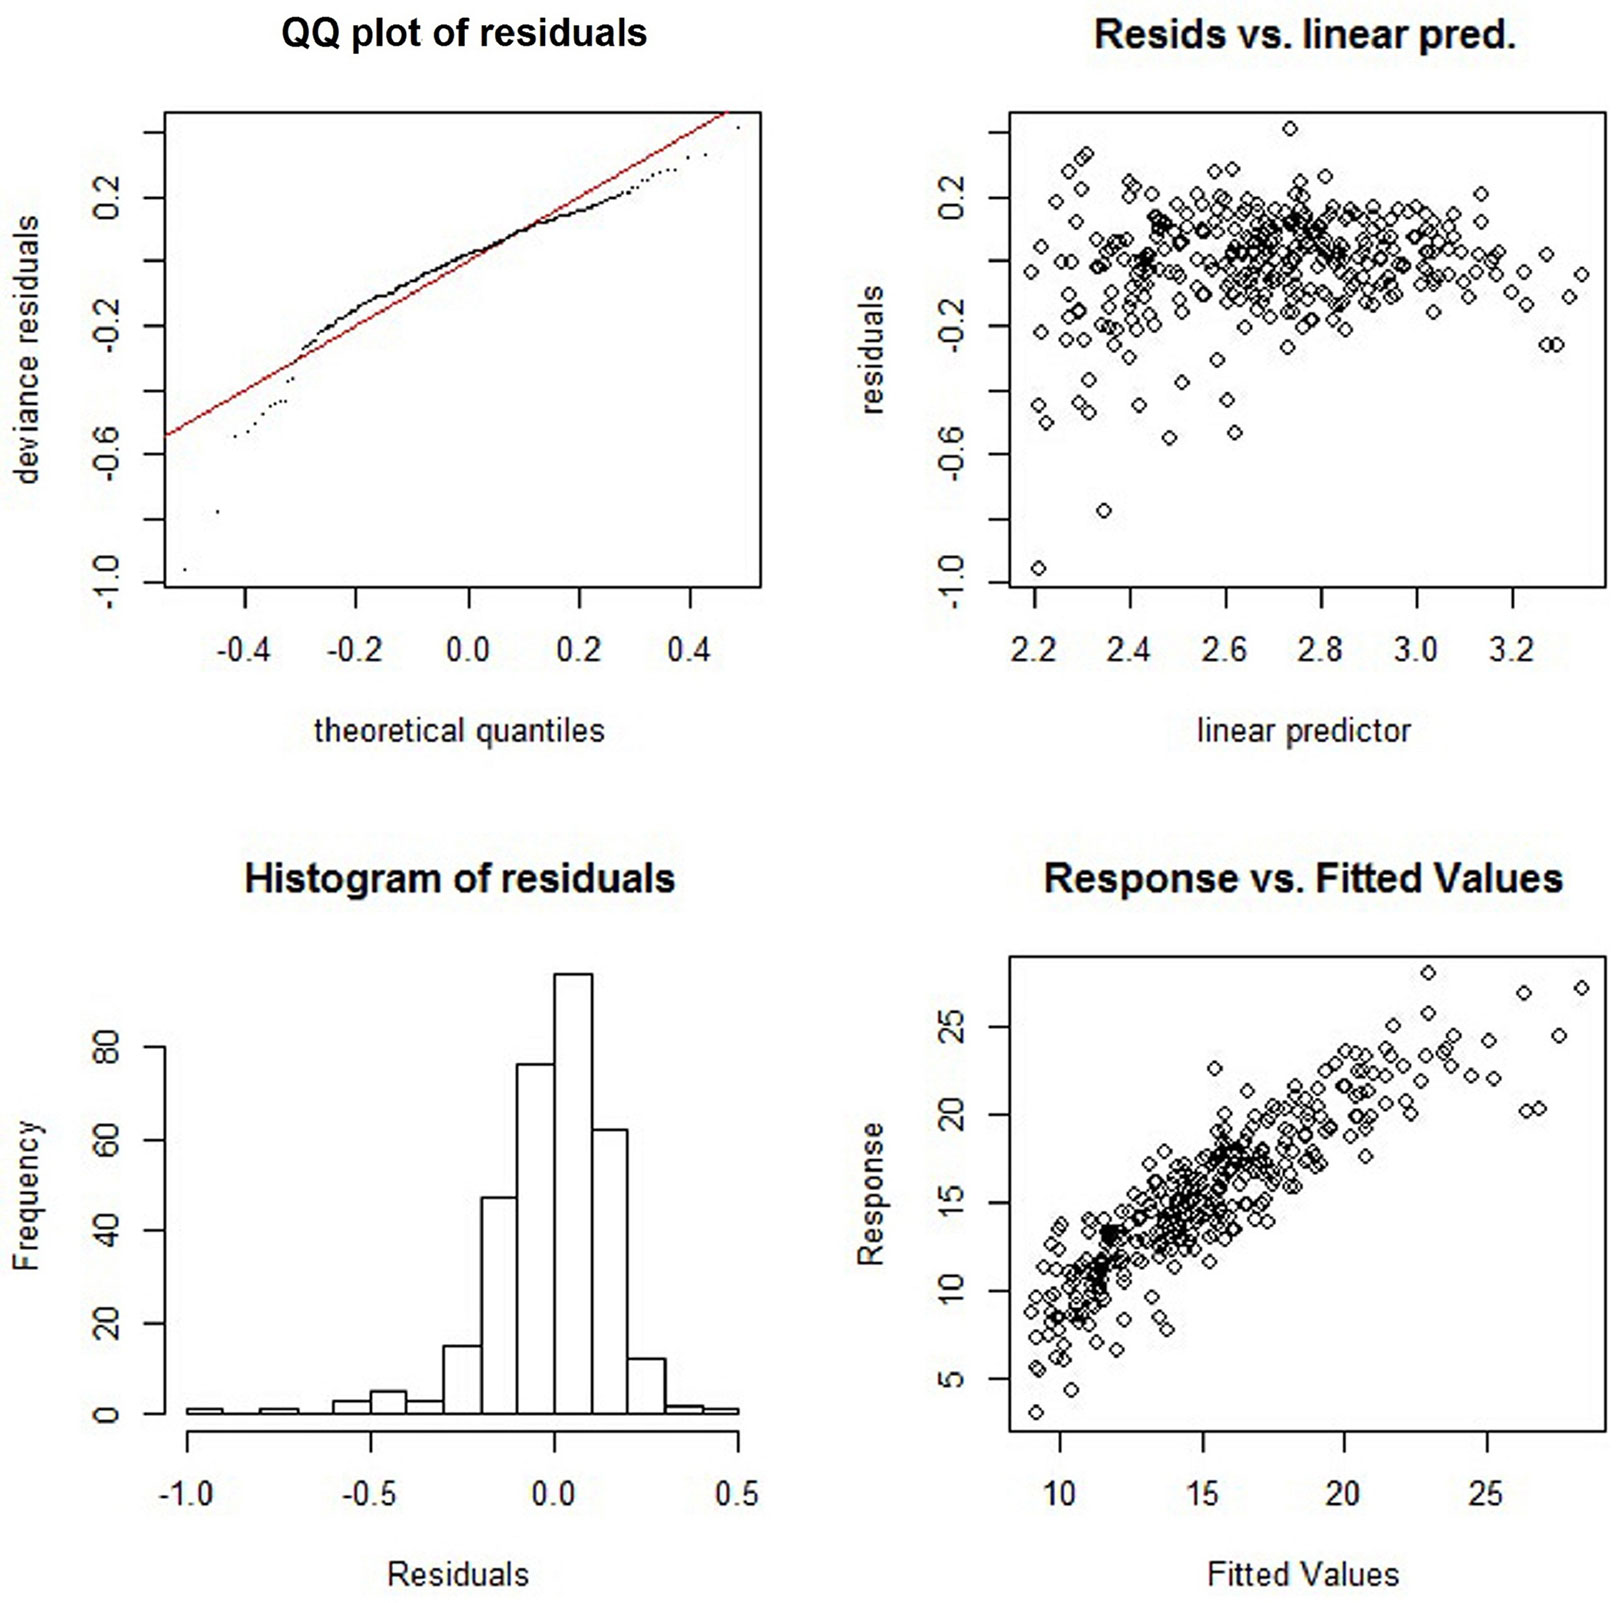
Fitting statistics and estimated values of the GAM applied are summarized in Tab. 3. All smooth terms are very significant with α = 0.001 after Bonferroni correction, and biologically meaningful. Longitude and latitude (LL), MAT, MAP and MTD were the significant explanatory variables. Overall, the climate variables and the geographic location included in the model could account for 72.9% of the variation in the SI20. The small GCV score obtained (0.037) indicated a good fit of the projection on the data, as confirmed by the low RMSE (0.83 m). The QQ plot, residual plot and histogram (Fig. 5) indicated that residuals were normally distributed, with no obvious evidence of heteroscedasticity. The fitted values were quite consistent with the modeled values (Fig. 5).
Tab. 3 - Estimated coefficients and cross validation statistics for the GAM. (***): p<0.0002
| Parameter | Coeff./ Smooth | Estimate | Standard error |
Estimated degree of freedom |
F | P-value |
|---|---|---|---|---|---|---|
| Intercept | β 0 |
2.693 | 0.009 | - | - | - |
| LL (Long/Lat) | f 1 |
- | - | 20.661 | 24.42 | <2 e-16*** |
| MAT | f 2 |
- | - | 1.000 | 33.47 | 1.75 e-8*** |
| MAP | f 3 |
- | - | 1.000 | 323.77 | <2 e-16*** |
| MTD | f 4 |
- | - | 3.159 | 14.38 | 1.19 e-10*** |
| Adjusted R2 | - | 0.77 | - | - | - | - |
| Deviance explained (%) | - | 72.9 | - | - | - | - |
GCV score |
- | 0.037 | - | - | - | - |
Fig. 5 - Analysis of residuals and response values obtained by the application of the generalized additive model.
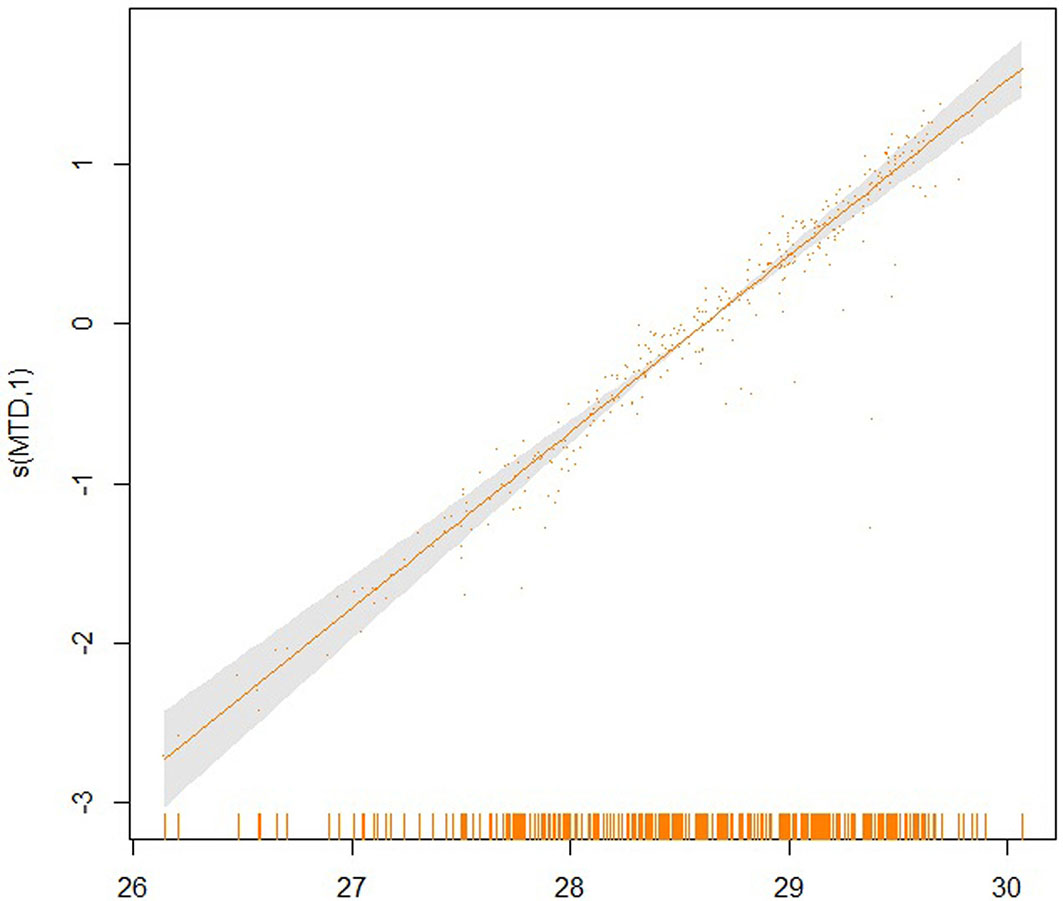
The partial effects of the four significant model predictors on the parameter SI20 are shown in Fig. 6 to 9. The partial effect surface of longitude and latitude (Fig. 6) reveals the relationship between the geographic location and the SI20. In the Jilin Province, the site index decreases eastbound and northbound, reaching the lowest value in the central-northern part of the province, likely due to the altitude change. MAT has a linear negative effect on SI20, though a larger uncertainty exists at the lowest and the highest temperatures (Fig. 7). The effect of MAP on SI20 appeared more complicated, in that SI20 decreases with increasing MAP up to about 720 mm, and then increases for higher values (Fig. 8). On the contrary, MTD had a strong linear positive impact on SI20 (Fig. 9).
Fig. 6 - The partial effect of longitude and latitude on the SI20.
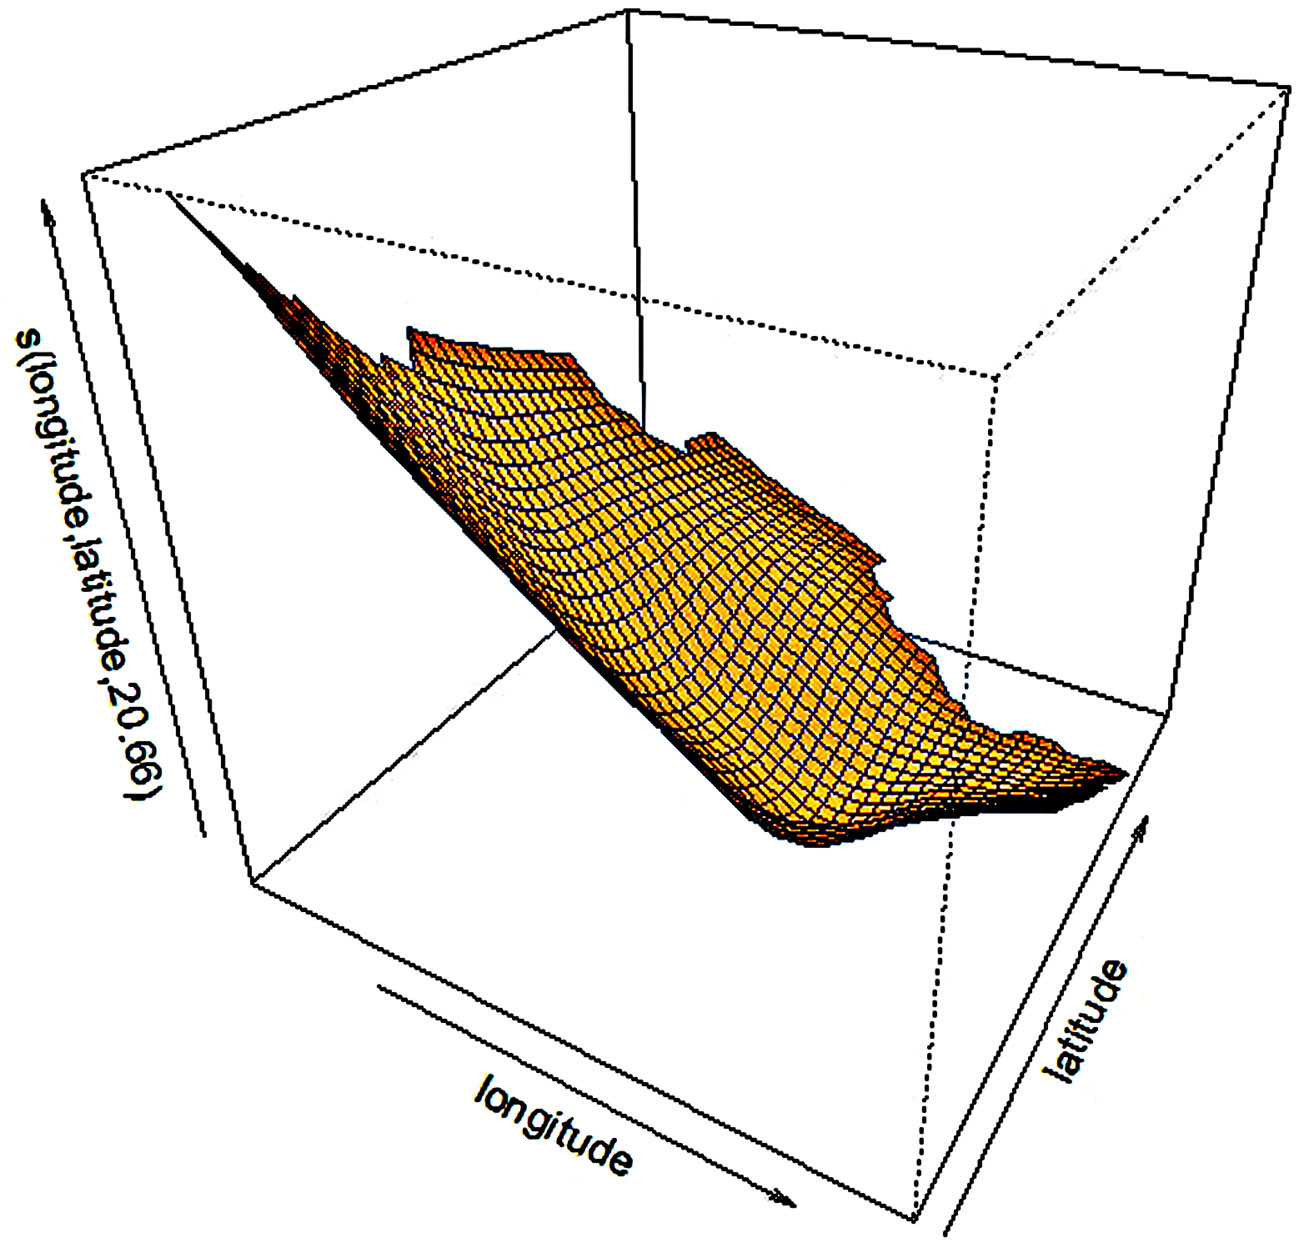
Fig. 7 - Partial effect of the MAT on the SI20.
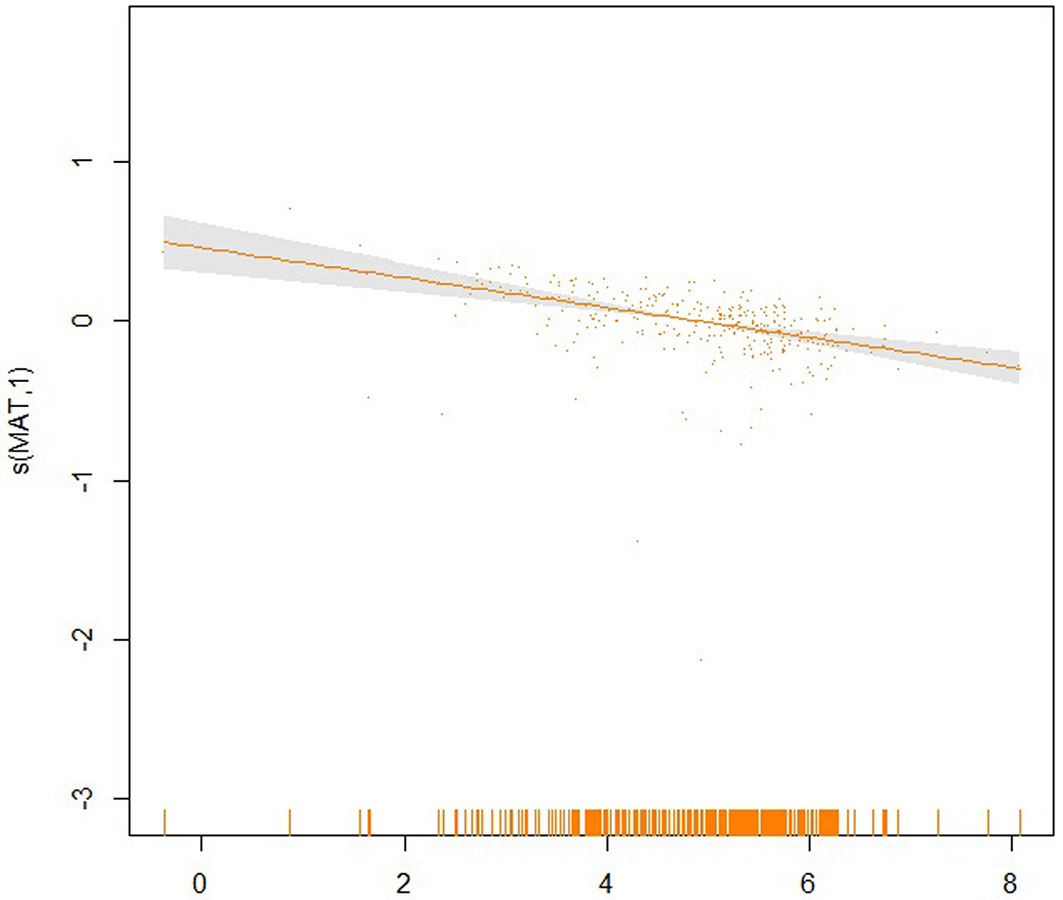
Fig. 8 - Partial effect of the MAP on the SI20.
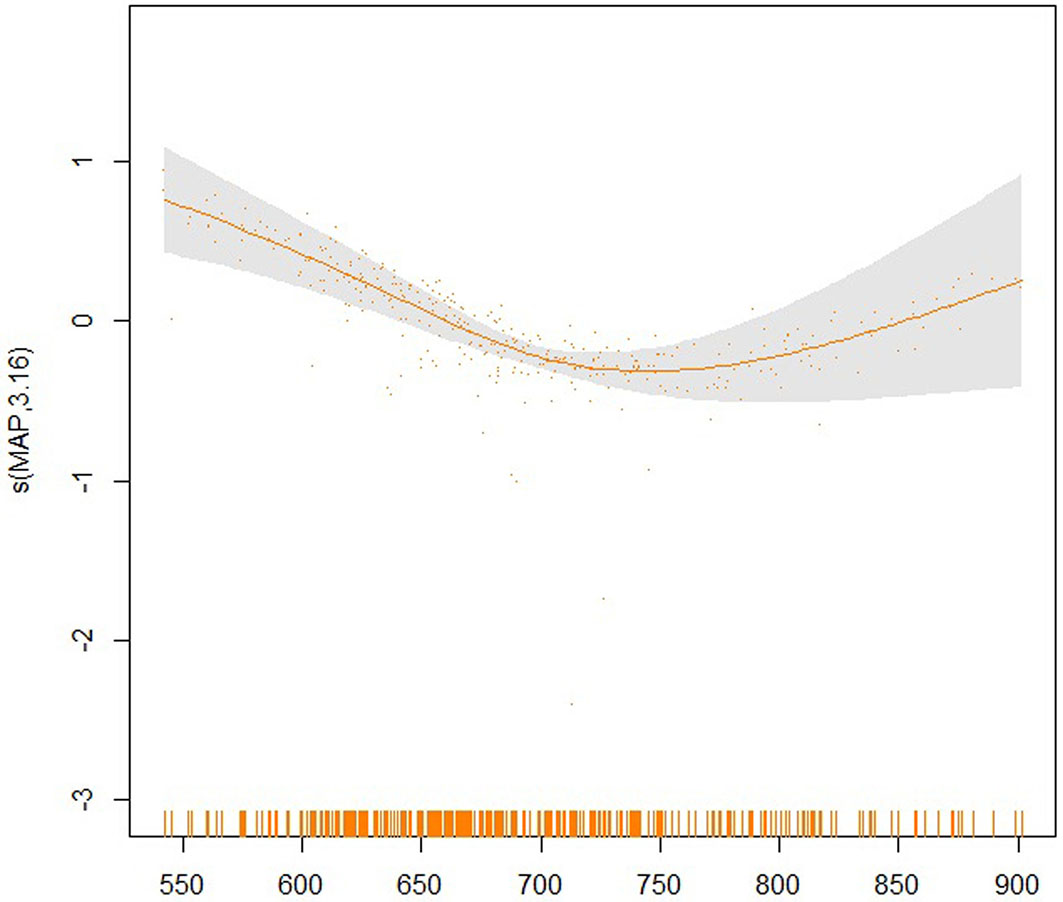
Fig. 9 - Partial effect of the MTD on the SI20.
Predicting site index to future climate change
For predicting the change of SI20 in response to future climate change, we applied three RCPs climate scenarios from the IPCC. The results showed that from 2040 to 2080 MAT would increase by 1.3 to 3.5 °C, while MAP would increase by 8 to 26% (Tab. 4). Changes of SI20 across all sites showed spatial heterogeneity in terms of magnitude and direction under each scenario. Compared with mean SI20 under the current climate conditions (13.6 m), an increase to 13.9 m (2.2%) by 2050 and 14.1 m (3.7%) by 2070 was predicted under the BC-RCP2.6 scenario. However, the mean SI20 across Changbai Larch distribution areas would decrease gradually under the remaining two climate scenarios both in 2050 and 2070. Specifically, The mean SI20 would decrease by 0.4 m (-2.9%) and 0.8 m (-5.9%) by 2050 and by 0.9 m (-6.6%) and 1.6 m (-11.8%) by 2070 under BC-RCP6.0 and BC-RCP8.5, respectively. These results indicate that SI20 will increase under climate scenarios with less forcing emissions, and decline under scenarios with more forcing emissions. Based on the above results, it might be hypothesized that excessive greenhouse gases in forcing emissions would lead to the inhibition of tree growth.
Tab. 4 - Prediction of the mean SI20 changes across the Changbai Larch distribution areas under IPCC climate scenarios. (MAT): mean annual temperature; (MAP): mean annual precipitation; (SI20): site index at the reference age of 20 years.
| Time period |
Climate scenario |
MAT [°C] | MAP [mm] | SI20 [m] | ||||||
|---|---|---|---|---|---|---|---|---|---|---|
| ΔMAT | Mean | STD | ΔMAP (%) | Mean | STD | ΔSI20 | Mean | STD | ||
| - | Current | 0 | 4.9 | 1.118 | 0 | 691 | 77.1 | 0 | 13.6 | 2.69 |
| 2050 (2041-2060) |
BC-RCP2.6 | 1.3 | 6.2 | 1.091 | 8 | 751 | 113.3 | 0.3 (2.2%) | 13.9 | 5.33 |
| BC-RCP6.0 | 1.9 | 6.8 | 1.087 | 16 | 802 | 116.1 | -0.4 (-2.9%) | 13.2 | 5.86 | |
| BC-RCP8.5 | 2.4 | 7.3 | 1.094 | 18 | 818 | 123.1 | -0.8 (-5.9%) | 12.8 | 5.65 | |
| 2070 (2061-2080) |
BC-RCP2.6 | 1.3 | 6.2 | 1.086 | 22 | 843 | 131.7 | 0.5 (3.7%) | 14.1 | 5.94 |
| BC-RCP6.0 | 2.3 | 7.2 | 1.081 | 26 | 868 | 139.2 | -0.9 (-6.6%) | 12.7 | 5.33 | |
| BC-RCP8.5 | 3.5 | 8.4 | 1.096 | 23 | 852 | 131.3 | -1.6 (-11.8%) | 12.0 | 5.71 | |
Discussion
Climate-sensitive site index model
Despite of its limitations, the site index is the most widely used indicator for quantifying forest site productivity and analyzing forest growth ([52]). Using traditional growth and yield models, it is difficult to predict forest growth under climate change because the site index is always assumed to be constant ([20], [34]). Although process-based models are still widely used, recent models describing the relationships between the site index and environmental/climatic factors have the potential to facilitate the prediction of timber production in the context of environmental change ([40], [3]). In this study, we developed a climate-sensitive site index model using the GAM method. Both geographic location and climate factors, including mean annual temperature, mean annual precipitation and mean temperature differential, were used as predictors. Among these variables, geographic location played a significant role in quantifying site index, in accordance with findings by Monserud et al. ([41]) and Albert & Schmidt ([3]). Spatial variability of the site index was also confirmed by another recent investigation by Skovsgaard & Vanclay ([53]). Most studies have shown that climatic variables, especially those related to warmth and moisture (evapotranspiration, mean annual temperature, mean annual precipitation, etc), are effective and useful predictors of site productivity. For instance, Monserud et al. ([40]) found that the strongest predictors in their site index model for lodgepole pine were all related to heat. The relationships between the site index of maritime pine and the climatic and environmental factors were investigated by Bravo-Oviedo et al. ([10]), who found that the site qualities were better in warm and humid sites than in cold and dry sites. Moreover, some composite climate variables (e.g., the ratio of the mean annual temperature to the mean annual precipitation, the ratio of summer precipitation to annual precipitation and the summer-winter temperature differential) have also been used for site index modeling ([43], [59]), demonstrating the complicated interaction among climate variables. The adjusted R2 statistics of all these site index models ranged from 0.08 to 0.91, and 90% ranged from 0.2 to 0.6 ([13], [43], [8], [10], [49], [44]). There are huge differences in climate variables and modeling results among these studies, indicating that the relationship between forest site productivity and climate is still uncertain to some extent. Process-based or hybrid representations of the relationship between climate and productivity are needed ([47], [18], [9]). Using spatial and climatic variables, our empirical model could explain 72.9% of the site index variation. In addition to climate factors, the site index is also affected by soil and local environmental variables ([21], [29], [49], [10]). The effects of soil variables on the site index of larch will be the subject of future study.
Response to climate change
Temperature, light, water and nutrient availability are the key drivers of forest productivity that may be affected by future climate change. In the context of global warming, the effect of rising temperatures on site productivity have been examined and both positive and negative impacts have been reported ([32], [46], [26], [14], [29], [18], [28]). Quantifying such effect is still challenging, because the temperature simultaneously affects ecosystem processes (photosynthesis, respiration, transpiration, allocation, decomposition, etc.). Moreover, the effects of rising temperature are in part the result of its interaction with precipitation and the adaptability of plants to temperature change. This difficulty is further worsen by the frequent nonlinear nature of the impacts ([35]).
In our study, the application of a generalized additive model revealed that rising temperatures have a partial negative effect on site index of larch plantations in the studied region (Fig. 7), but such effect varied with increasing precipitation (Tab. 4), a scenario which is more complicated than that reported by previous studies in other regions ([3]). Temperature controls the rate of plant metabolism, which in turn controls the amount of photosynthesis that can take place. However, a higher temperature also increases evaporative demand causing water stress that would hinder tree growth. Consequently, potential drought stress in the Jilin Province would negatively affect the site index. The mean annual precipitation displays a typical nonlinear effect on site index in this study. Changes in precipitation are spatially variable and highly uncertain, though a tendency towards more abrupt and intense precipitation is expected under climate change. Abrupt rainfall would greatly challenge the water storage capacity of the soil, which would result in too high soil moisture that would weaken the respiration of plant roots. In addition, the increased runoff would lead to an increased leakage of nutrients from soil. These two aspects of increasing precipitation would also negatively affect the site index. However, the situation would change when the mean annual precipitation reaches a threshold of approximately 720 mm (Fig. 8), i.e., continuous rainfall could ease and compensate the hydrological stress caused by rising temperature. Although there is still much uncertainty, our study shows that climate is clearly a significant driver of the change in the site index.
Predicting the site index to climate change
Climate change has significant effects on forest site productivity; however, the direction and magnitude of such effects are still uncertain and dependent on the climate change scenario, tree species and region ([35], [59]). We found that the average SI20 of Larix olgensis varies from 0.3 m (2.2%) to -0.8 m (-5.9%) by 2050 and from 0.5 m (3.7%) to -1.6 m (-11.8%) by 2070, as a consequence of the increasing temperature and precipitation. The increase of site productivity of larch with rising temperature and precipitation was projected from both empirical ([30]) and process-based models ([48]). Uncertainty in the model prediction of site index under climate change was also observed in previous studies. Monserud et al. ([41]) used a nonlinear general circulation model to predict that the site index of lodgepole pine in Alberta (Canada) would increase by 26% to 35%. Albert & Schmidt ([3]) analyzed the site index under the A1B future climate scenario ([24]), predicting a change for the period 2041-2050 that varied from -1.19 m to -2.87 m (-4.4% to -10.5%) with decreasing precipitation and from -0.24 m to 2.05 m (-0.8% to 7.7%) with increasing temperature. Bravo-Oviedo et al. ([9]) found that the change in site index prediction of Spanish Pinus pinaster fluctuated greatly between -30% and 12.5%. Coops et al. ([18]) found that the site index of Douglas fir in the interior varied in an opposite manner to the variation along the coast. Weiskittel et al. ([59]) reported that the predominant trend from 2000 to 2090 was a 0-5 m (0-30%) increase in the average site index across forests of the western part of the United States, though the site index in some areas would decrease by approximately 30%. Nothdurft et al. ([45]) predicted that the site index would decrease in low areas and increase at high altitudes in the mid-21st century. For the Norway spruce, Douglas fir, Scots pine, sessile oak and common beech, the site index would remain high based on scenario B1, whereas it would decrease based on scenarios A1B and A2 in most areas. Because of the differences in model input, climate scenario, tree species, location and scale, the outputs of the site index change are difficult to compare. When using model outputs for the site index under future climate change, caution should be taken because of the uncertainty arising from the different climate scenarios, model errors and plant ability to acclimate and adapt to climate change ([3], [18], [35]). Nonetheless, models still provide useful information for adaptive management in response to climate change despite these uncertainties.
Implications for forest management planning of larch plantations
Adaptive forest management strategies at both landscape and stand levels are needed to meet the challenge of climate change. China released its Forestry Action Plan to address climate change, which advocated a combination of mitigating and adapting measures ([54]). Climate change is not currently considered in forest management plans. Understanding the potential impacts of climate change on forest productivity is useful for incorporating climate change into forest management plan and silvicultural decision-making process. Currently, the annual allowable cut and rotation age are determined by empirical growth and yield models based on historical data, which do not and cannot respond to current or future climate scenarios ([25]). Empirical models with a climate-sensitive site index as an important driving variable could project future growth and yield under climate change, thus providing forest managers with a useful tool for adapting their plans. Under future climate change in the Jilin Province, we found both an increase and a decrease of average SI20 for Larix olgensis from 2041 to 2080, with a magnitude varying from 3.7% to -11.8%. Therefore, local specific management should be adapted according to the above predictions.
At the landscape scale, the spatial prediction of site index changes in relation to climate change would be of great importance to newly established and current larch plantations. Indeed, when establishing new plantations, it is recommended replanting at future productive sites with more robust genotypes. Diversification of tree species mixtures and management approaches would increase the adaptive capacity and improve the overall resilience of the regional forest ecosystem. For example, prolonged rotations or conversion with other tree species may be needed where site productivity is lowered, while a shorter rotation may be necessary for timber production where site productivity is enhanced. Furthermore, management might focus on currently productive sites and those likely to remain productive under future climate scenarios, reducing the efforts on poor sites. These adaptive measures should be integrated with the impacts of other environmental variables, such as soil and climate-induced forest health and loss. Additionally, owing to some uncertainties related to climate change, the management and analysis of risk should be considered in long-term forest management planning.
Conclusions
A climate-sensitive index model was developed using a generalized additive model for Larix olgensis in the Jilin Province (northeastern China). We found that the effective predictors are geographic location, mean annual temperature (MAT), mean annual precipitation (MAP) and mean temperature differential (MTD). The MAT and MTD showed linear negative and positive effects on the site index, whereas the MAP showed obvious nonlinear effects. Under the BC-RCP scenarios of IPCC from 2041 to 2080, the change of average site index of Larix olgensis varies from 0.5 m (3.7%) to -1.6 m (-11.8%) with increasing temperature and precipitation. Our findings indicate that the impact of future climate change on forest site productivity of Larix olgensis could be both beneficial and adverse depending on the regional cliate change scenario considered. In addition, a remarkable spatial variability of site index change was found. The model provides relevant information and has the potential to be applied in forest and yield models for adaptive forest management under future climate change.
Acknowledgments
This work was supported by the National Natural Science Foundation of China (31270679 and 41271120). We highly appreciate the assistance of the Jilin Academy of Forestry for setting the study plots and the China Meteorological Data Sharing Service System for sharing climate data. We thank the computer network department in the Institute of Forest Resource Information Techniques, the Chinese Academy of Forestry for providing high-performance computer clusters for the parallel computing of climate interpolation. We are so grateful to two anonymous reviewers for their valuable comments that greatly improved our manuscript.
List of Abbreviations
The following abbreviations have been used throughout the paper:
- GAM: Generalised additive model
- SI: Site index
- DEM: Digital elevation model
- GCV: Generalised cross validation
- RCPs: Representative concentration pathways
- GCM: Global circulation models
- RMSE : Root mean square error
- VIF: Variance inflation factor
References
Gscholar
Gscholar
Gscholar
Gscholar
Gscholar
Gscholar
CrossRef | Gscholar
Gscholar
Gscholar
Gscholar
Gscholar
Gscholar
Gscholar
Gscholar
Authors’ Info
Authors’ Affiliation
Lily Wang
Key Laboratory of Land Surface Pattern and Simulation, Institute of Geographic Sciences and Natural Resources Research, Chinese Academy of Sciences 86, 100101 Beijing (China)
Hongyu Liu
Institute of Forest Resource Information Techniques, Chinese Academy of Forestry 86, 100091 Beijing (China)
Jilin Academy of Forestry 86, 130033 Changchun (China)
Corresponding author
Paper Info
Citation
Shen C, Lei X, Liu H, Wang L, Liang W (2015). Potential impacts of regional climate change on site productivity of Larix olgensis plantations in northeast China. iForest 8: 642-651. - doi: 10.3832/ifor1203-007
Academic Editor
Giorgio Matteucci
Paper history
Received: Dec 14, 2013
Accepted: Oct 28, 2014
First online: Mar 02, 2015
Publication Date: Oct 01, 2015
Publication Time: 4.17 months
Copyright Information
© SISEF - The Italian Society of Silviculture and Forest Ecology 2015
Open Access
This article is distributed under the terms of the Creative Commons Attribution-Non Commercial 4.0 International (https://creativecommons.org/licenses/by-nc/4.0/), which permits unrestricted use, distribution, and reproduction in any medium, provided you give appropriate credit to the original author(s) and the source, provide a link to the Creative Commons license, and indicate if changes were made.

Web Metrics
Breakdown by View Type
Article Usage
Total Article Views: 69326
(from publication date up to now)
Breakdown by View Type
HTML Page Views: 48939
Abstract Page Views: 4578
PDF Downloads: 14167
Citation/Reference Downloads: 62
XML Downloads: 1580
Web Metrics
Days since publication: 4130
Overall contacts: 69326
Avg. contacts per week: 117.50
Article Citations
Article citations are based on data periodically collected from the Clarivate Web of Science web site
(last update: Mar 2025)
Total number of cites (since 2015): 19
Average cites per year: 1.73
Publication Metrics
by Dimensions ©
Articles citing this article
List of the papers citing this article based on CrossRef Cited-by.
Related Contents
iForest Similar Articles
Research Articles
An assessment of climate change impacts on the tropical forests of Central America using the Holdridge Life Zone (HLZ) land classification system
vol. 6, pp. 183-189 (online: 08 May 2013)
Research Articles
Predicting the effect of climate change on tree species abundance and distribution at a regional scale
vol. 1, pp. 132-139 (online: 27 August 2008)
Research Articles
Seeing, believing, acting: climate change attitudes and adaptation of Hungarian forest managers
vol. 15, pp. 509-518 (online: 14 December 2022)
Review Papers
Impacts of climate change on the establishment, distribution, growth and mortality of Swiss stone pine (Pinus cembra L.)
vol. 3, pp. 82-85 (online: 15 July 2010)
Research Articles
Impact of climate change on radial growth of Siberian spruce and Scots pine in North-western Russia
vol. 1, pp. 13-21 (online: 28 February 2008)
Editorials
COST Action FP0903: “Research, monitoring and modelling in the study of climate change and air pollution impacts on forest ecosystems”
vol. 4, pp. 160-161 (online: 11 August 2011)
Research Articles
Model-based assessment of ecological adaptations of three forest tree species growing in Italy and impact on carbon and water balance at national scale under current and future climate scenarios
vol. 5, pp. 235-246 (online: 24 October 2012)
Research Articles
Is Pinus pinea growth affected by climate change in western Anatolia?
vol. 18, pp. 93-101 (online: 28 April 2025)
Review Papers
Climate change impacts on spatial distribution, tree-ring growth, and water use of stone pine (Pinus pinea L.) forests in the Mediterranean region and silvicultural practices to limit those impacts
vol. 14, pp. 104-112 (online: 01 March 2021)
Research Articles
Approaches to classifying and restoring degraded tropical forests for the anticipated REDD+ climate change mitigation mechanism
vol. 4, pp. 1-6 (online: 27 January 2011)
iForest Database Search
Search By Author
Search By Keyword
Google Scholar Search
Citing Articles
Search By Author
Search By Keywords
PubMed Search
Search By Author
Search By Keyword


