Impact of climate change on tree-ring growth of Scots pine, common beech and pedunculate oak in northeastern Germany
iForest - Biogeosciences and Forestry, Volume 9, Issue 1, Pages 1-11 (2015)
doi: https://doi.org/10.3832/ifor1421-008
Published: Oct 13, 2015 - Copyright © 2015 SISEF
Research Articles
Abstract
Tree growth depends, among other factors, largely on the prevailing climatic conditions. Therefore, changes to tree growth patterns are to be expected under climate change. Here, we analyze the tree-ring growth response of three major European tree species to projected future climate across a climatic (mostly precipitation) gradient in northeastern Germany. We used monthly data for temperature, precipitation, and the standardized precipitation evapotranspiration index (SPEI) over multiple time scales (1, 3, 6, 12, and 24 months) to construct models of tree-ring growth for Scots pine (Pinus sylvestris L.) at three pure stands, and for common beech (Fagus sylvatica L.) and pedunculate oak (Quercus robur L.) at three mature mixed stands. The regression models were derived using a two-step approach based on partial least squares regression (PLSR) to extract potentially well explaining variables followed by ordinary least squares regression (OLSR) to consolidate the models to the least number of variables while retaining high explanatory power. The stability of the models was tested through a comprehensive calibration-verification scheme. All models were successfully verified with R²s ranging from 0.21 for the western pine stand to 0.62 for the beech stand in the east. For growth prediction, climate data forecasted until 2100 by the regional climate model WETTREG2010 based on the A1B Intergovernmental Panel on Climate Change (IPCC) emission scenario was used. For beech and oak, growth rates will likely decrease until the end of the 21st century. For pine, modeled growth trends vary and range from a slight growth increase to a weak decrease in growth rates. The climatic gradient across the study area will possibly affect the future growth of oak with larger growth reductions towards the drier east. For beech, site-specific adaptations seem to override the influence of the climatic gradient. We conclude that Scots pine has great potential to remain resilient to projected climate change without any greater impairment, whereas common beech and pedunculate oak will likely face lesser growth under the expected warmer and dryer climate conditions. The results call for an adaptation of forest management to mitigate the negative effects of climate change for beech and oak.
Keywords
Partial Least Squares Regression (PLSR), Precipitation Gradient, Tree-ring Growth Forecast, Standardized Precipitation Evapotranspiration Index (SPEI), Tree Rings, WETTREG
Introduction
Climatic conditions are decisive factors for the growth of trees. The yearly sequence of favorable and unfavorable climate is recorded by the sequence of wide and narrow tree rings ([22]). Compared with pre-industrial times, the mean annual temperature has risen by about 1 °C across Europe ([17]). According to regional climate models, a further increase in mean annual temperatures for northeastern Germany is predicted until 2100, associated with a shift to drier summers and wetter winters ([34]). Therefore, adaptation strategies aiming at mitigating the consequences of global warming on forest ecosystems, such as increasing drought stress ([44]) are an issue of intense debate ([7], [35]). In this context, future tree growth of the ecologically as well as economically very important central European tree species Scots pine (Pinus sylvestris L.), common beech (Fagus sylvatica L.), and pedunculate oak (Quercus robur L.) is of major interest to science and forest practitioners alike.
For these tree species, changes in growth rates due to environmental changes have become apparent across European forests during the last decades. In a comparative study, Kint et al. ([33]) observed different growth trends for pedunculate oak (increase), common beech (decrease), and Scots pine (no trend) in northwestern European lowland forests, and related these trends to climate change and increased atmospheric N deposition. Decreasing future growth rates for Scots pine under global warming have been suggested by Reich & Oleksyn ([52]) for the whole Europe, except the far north. In contrast, Martínez-Vilalta et al. ([41]) reported an overall rise in radial growth of Scots pine in northeastern Spain over the 20th century and explained this with the increased atmospheric CO2 concentration. Common beech seems to have grown faster at lower altitudes and slower at higher elevations in central Europe during past decades, driven amongst other causes by the increased tropospheric ozone concentration ([15]). Growth reductions as a consequence of increasing drought stress are reported from the southern distribution limits of beech in Spain ([31]) and Italy ([46]). In contrast, Tegel et al. ([60]) reported on a recent growth increase of beech at its southeastern distribution limit at the Balkan Peninsula. Sessile and pedunculate oaks seem to have rising growth rates in recent decades in Germany and in northern and northeastern France, presumably driven by changes in temperature regime, CO2 concentration and N deposition ([3], [47], [5]). While these retrospective studies give valuable indications for regional species-specific future growth developments, the direct impact of projected climate change scenarios on radial growth (i.e., tree-ring width) of Scots pine, common beech and pedunculate oak in central European lowland forests have not been assessed adequately so far.
There is a selection of approaches for modeling tree growth ranging from relatively simply models using climatic data only ([36], [24], [59]) to more complex ones using additional ecophysiological variables as predictors for regression equations ([51], [23]). For instance, Laroque & Smith ([36]) and Takahashi & Okuhara ([59]) used temperature and precipitation to predict tree-ring width, while Girardin et al. ([23]) extended this empirical approach by incorporating process-based physiological model results into the regression equations. Rathgeber et al. ([51]) argue that empirical models based solely on meteorological variables are of weak predictive power, because of their limited ability to properly factor in the water budget. Therefore, they introduced bioclimatic variables describing the actual evapotranspiration and soil moisture, and showed that the final bioclimatic models gave better results than classic response functions. Unfortunately, measured data related to soil water balance or tree physiology are usually not available over longer time periods. The application of process-based models could be an option, but their results are themselves often characterized by high levels of uncertainty.
The use of parameters describing evapotranspiration and water balance, such as drought indexes derived from regularly measured, long-term climatic variables, could be an alternative way to increase the predictive power of the models. Recently, several studies ([20], [55]) demonstrated that the self-calibrated Palmer Drought Severity Index (sc-PDSI - [63]) may explain inter-annual variations of tree-ring widths better than temperature or precipitation. Another drought index, the standardized precipitation evapotranspiration index (SPEI - [64]) is based only on precipitation and temperature, and involves the climatic water balance into its calculation. Unlike the sc-PDSI, the SPEI can be calculated for different time scales that represent drought conditions in different hydrological sub-systems, ranging from short term fluctuations of soil water content to longer term variations in groundwater storage ([64]). The high relevance of taking into account multiple time scales in the analysis of climate-growth relationships became apparent in a study by Pasho et al. ([45]), who calculated the maximum correlations between tree-ring widths and the standardized precipitation index (SPI - [43]) for time scales from 5 to 11 months.
Here, we model tree-ring growth using monthly precipitation and temperature data of a regional statistical climate model as well as SPEI derived from these data over multiple time scales based on a comprehensive and robust calibration-verification scheme. With the resulting multiple regression models we evaluate the impact of projected climate change on tree-ring growth of Scots pine, common beech, and pedunculate oak, which are the three most important tree species in northeastern Germany. To this end, we applied a moderate regionalized climate change scenario until 2100.
Material and methods
Study sites
The study region is northeastern Germany (Fig. 1). This lowland region is mainly characterized by a flat topography and gentle slopes. Some 23% of the area is covered by forests, the main tree species being Scots pine (39%), beech (12%), and oak (9% - [6]).
Fig. 1 - Location of the study sites along a west-east transect in northeastern Germany.
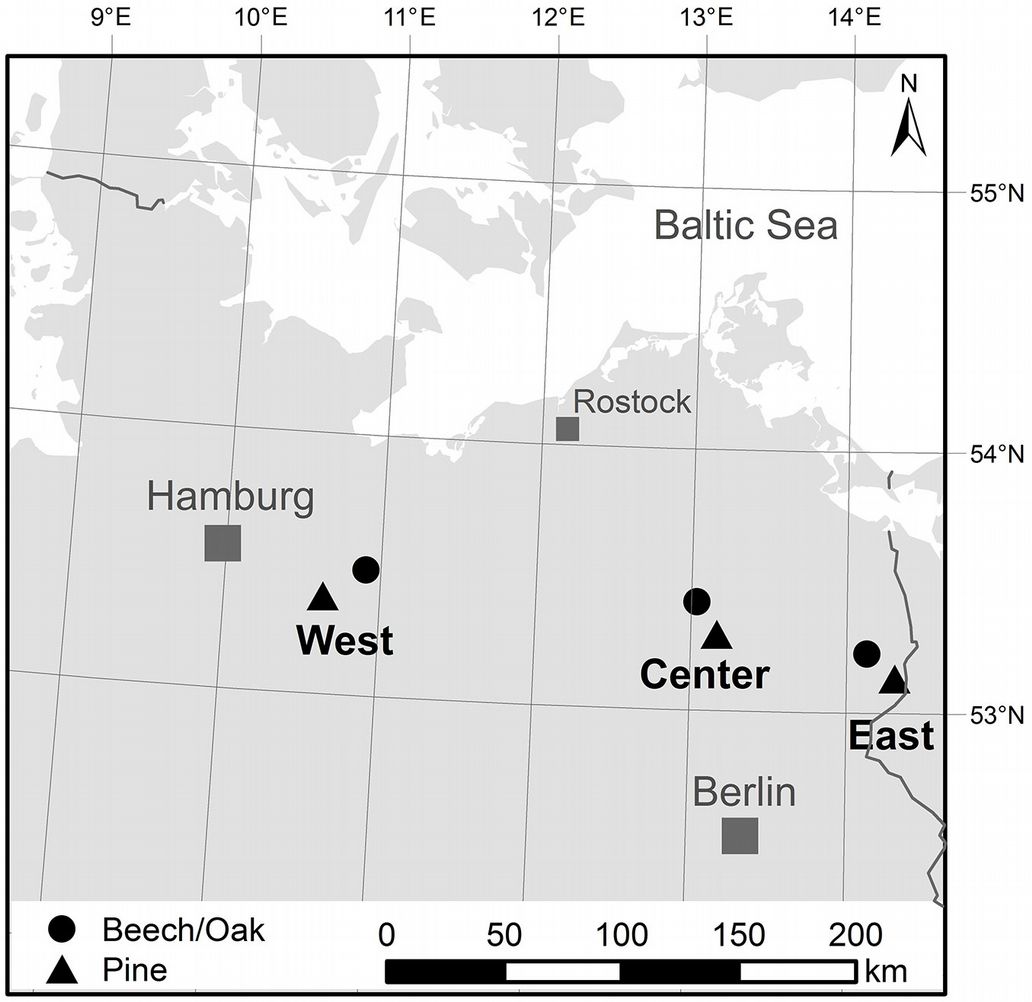
The study sites were chosen to be representative for the study region and are located in the west, center, and east of a 250 km west-east transect. They represent three mature mixed stands of beech and oak as well as three pure pine stands typical for the region (Fig. 1) with otherwise similar characteristics. The ages of the six forest stands were between 110 and 210 years (Tab. 1) and the stand densities ranged from 172 to 185 trees ha-1 for the mixed and from 220 to 731 trees ha-1 for the pine stands. In particular, the pine stands are highly managed by the local forest authorities, which is the reason for the large differences in stand densities. Pines in northeastern Germany usually grow on soils with limited water supply, which is reflected in differences of the available water capacity (AWC) resulting in higher AWCs for the broadleaved sites (141-165 mm) compared to the pine stands (72-131 mm).
Tab. 1 - Site and stand characteristics. (AWC): available water capacity; (DBH): diameter at breast height.
| Study Site | Lat. Lon. |
Elevation (m a.s.l) |
Mean stand age (years) |
Density (trees/ha) |
Mean stand height (m) |
DBH (cm) |
AWC (mm/m) |
|---|---|---|---|---|---|---|---|
| Pine West | 53.377 N 10.370 E |
15 | 130 | 276 | 22.0 | 39 | 131 |
| Pine Center | 53.294 N 13.166 E |
73 | 121 | 220 | 29.5 | 43 | 121 |
| Pine East | 53.135 N 14.209 E |
35 | 110 | 731 | 25.0 | 28 | 72 |
| Beech/Oak West | 53.485 N 10.915 E |
50 | 125 (210) |
172 | 34.6 | 42 | 155 |
| Beech/Oak Center | 53.417 N 13.033 E |
80 | 130 | 172 | 31.2 | 44 | 141 |
| Beech/Oak East | 53.223 N 14.130 E |
20 | 140 | 185 | 30.0 | 43 | 165 |
Vegetation characteristics and soil properties are similar among the broadleaved mixed stands and among the pine stands, respectively. The soil texture at all sites is dominated by sand with average contents between 80% and 95% and the prevailing soil types are Cambisols and Podzols for the mixed deciduous and the pine forests, respectively ([70]).
Northeastern Germany is located in the transition zone from the Atlantic-influenced climate in the west to a more continental climate in the east. This is reflected in the climatic situation of the study sites (Tab. 2). Temperatures at the study sites are almost identical on an annual time scale, but vary across seasons with temperatures being about 1 °C higher in summer and about 1 °C lower in winter at the eastern compared to the western sites. The annual precipitation totals decrease from the western to the eastern parts of the region, with about 150 mm lower precipitation in the East compared to the West.
Tab. 2 - Average precipitation and temperatures at the study sites (1971-2000). January and July refer to the coldest and warmest months in the study region.
| Study Site | Precipitation (mm) | Temperature (°C) | ||
|---|---|---|---|---|
| Annual | Annual | January | July | |
| Beech/Oak West | 662 | 8.8 | 0.8 | 17.3 |
| Pine West | 637 | 9.0 | 0.9 | 17.7 |
| Beech/Oak Center | 609 | 8.2 | -0.2 | 17.2 |
| Pine Center | 592 | 8.4 | -0.2 | 17.5 |
| Beech/Oak East | 506 | 8.8 | 0.0 | 18.1 |
| Pine East | 496 | 9.0 | 0.1 | 18.4 |
Tree-ring data
At each site, we selected a minimum of 18 dominant trees of each species and extracted two cores at breast height, taken perpendicular to each other. The cores were glued to wooden mounts, sanded and finally the ring widths were measured with an accuracy of 1/100 mm using a LINTAB-measuring table and the software TSAP-Win ([53]). The two measurements per tree were averaged after crossdating them first visually and then statistically using the COFECHA® software package ([27]), resulting in tree-ring width series per tree. In order to emphasize the climatic signal and to remove the non-climatic age trend as well as the influence of disturbance, competition and management from the raw measurements, we first detrended the single series ([9]) before combining the single-tree related series to stand chronologies.
Two detrending methods, differing in the flexibility of the fitted trend curve, were tested and compared. In a first conservative approach, a negative exponential function or, if not appropriate (function non-decreasing or some values negative), a straight line was fitted to the raw measurements, to retain as much low frequency (decadal) variations in the tree-ring data as possible. In a second, less conservative approach, more flexible cubic smoothing splines ([10]) were fitted to the data, with a frequency response of 50% at 32 years that removed most of the low frequency signal. While the first approach typically retains a potential signal of longer term climatic trends, at the same time non-climatic growth releases following management interventions or natural disturbances are not removed from tree-ring data. Thus, the climatic signal might get blurred by this approach. In contrast, the flexible spline detrending method strongly emphasizes the inter-annual growth variations by eliminating both, potential decadal climatic and non-climatic trends.
The ring-width indexes were derived by subtracting the trend curve from the raw measurements after initial power transformation, a method that is preferable to division ([26]). Finally, autocorrelation, i.e., the growth persistence of the previous year(s), was removed by autoregressive modelling, and the detrended single tree series were averaged to species specific site chronologies using a bi-weight robust mean. All chronology computations were carried out using the software package ARSTAN ([11]).
The differently detrended chronologies showed only small differences. In general, inter-annual variations were similar between both approaches, with the negative exponential/straight line approach producing slightly higher amplitudes (Fig. S1 in Appendix 1). Since no common longer-term trend emerged, we decided to use the spline detrended chronologies for all further analyses to avoid the potential interference of management-related growth trends with climate growth relationships. Common dendrochronological statistics as the mean sensitivity (MS) - a measure of the strength of inter-annual fluctuations, the mean interseries correlation (Rbar) - indicating the strength of the common signal among all trees - and the expressed population signal (EPS) - a measure of how well a subsample represents the theoretical population, were computed for all chronologies over the common period 1910-2009 (Tab. S1 in Appendix 1).
Climate data
Climatic data were taken from the 1×1 km grid of monthly values for precipitation and temperature (mean, min, max) of the German Weather Service, which contains continuous data for the whole country since 1901. This grid product has the advantage that climatic data is readily prepared with a very high accuracy for the desired location. In addition, for drought index computation, the climatic water balance was determined using the approach of Thornthwaite ([62]) as the difference between monthly precipitation and monthly potential evapotranspiration. SPEIs were then calculated for every site using the log-logistic probability distribution function for the time scales of 1, 3, 6, 12, and 24 months. The result is a standardized variable with an average value of 0 and a standard deviation of 1. We calculated SPEIs using the R package SPEI 1.2 ([4]).
Model construction
We used the nine chronologies (3 tree species × 3 sites) through a 100-year period from 1910 until 2009 and the corresponding climatic variables to build the regression models. For all models, monthly mean temperatures (max, mean, min), monthly precipitation sums, and the SPEIs covering time scales of 1, 3, 6, 12, and 24 months over an 18-month window (from May of the previous year until October of the growing year) entered the analysis as potential variables to predict the ring-width indexes (RWI). Hence, we started with 162 variables as potential predictors. We did not eliminate variables in advance on the basis of strong inter-correlations among variables or low relations with RWI, since some variables could become important only when in concert with others. Instead, the final models were obtained in two steps, namely variable pre-selection and variable reduction, that are described in details hereafter.
The following procedure was applied to each of the 9 chronologies. Partial least squares regression (PLSR - [69]) models were built by using the R package “autopls” version 1.2-3 ([57]). PLSR has the advantage that variables can be highly inter-correlated and that the number of variables can be larger than the number of observations, which is a constraint for other regression techniques. We used stepwise backward selection combined with a 10-fold cross-validation to substantially reduce the number of variables, i.e., to extract the variables with the highest explanatory power. The PLSR procedure was repeated 100 times, because the results were not stable, meaning that the obtained PLSR models differed widely both in the number and in the choice of variables and, hence, in their predictive performance. The 100 runs yielded 100 models, and we extracted the 5 “best” models based on a performance index IP, which was taken by combining important model statistics (eqn. 1):
where N is the number of variables that entered the model (N=162), Ns the number of significant variables, R2cal and R2val the coefficients of determination for calibration and validation, respectively; RMSEcal and RMSEval the root mean square errors for calibration and validation, respectively; R2diff = R2cal - R2val, and RMSEdiff = RMSEcal - RMSEval. Thus, the model showing the lowest number of retained variables, the highest R2s and lowest RMSEs (both for calibration and validation), and the smallest differences between the last two, has the lowest (i.e., best) performance index IP. This seems reasonable to us because in models with high coefficients of determination and low error terms for calibration and validation the retained variables have high predictive power. In addition, when aiming at modeling scenarios it is also important that calibration and validation performances are similar. Therefore, we included the difference terms. Finally, Ns was included because we were looking for the best performing model with the least number of variables to avoid overfitting.
We further reduced the number of variables by applying ordinary least squares regression (OLSR) to the set of final variables included in the 5 “best” PLSR models. This step was necessary, because it became obvious in initial tests that after performing OLSR, the former 1st, 2nd, 3rd, or 4th best PLSR model could be the best OLSR model based on the Akaike information criterion (AIC). We used the function “step” of the R package “stats” ([50]) with an iterative approach of combined forward and backward selection, using the lowest AIC as selection criterion for deciding on the final regression equations. Eventually, the final models consisted of five to ten predictor variables. The regression coefficients used for modeling future growth response were obtained by fitting these models over the data of the complete observation period 1910-2009.
Calibration-verification procedure
To evaluate the stability and quality of the regression models, the predictors that had been identified with the above approach were subjected to an extensive calibration-verification procedure. From the entire 100 years data set, 50 years were randomly selected as calibration data set and the remaining 50 years were used as verification data set. This procedure was repeated 100 times resulting in 100 regression coefficients for each variable. Several quality parameters that are described below were calculated for each run, resulting in 100 values for each quality parameter. Finally, the overall robustness and predictive performance of the models were evaluated by calculating mean values and standard deviations of the quality parameters.
We used the following parameters to verify the quality of the regression models: adjusted coefficient of determination (adj. R²) and root mean square error (RMSE) for calibration; R², RMSE, sign test (ST), cross-product mean test (PM), reduction of error (RE), and coefficient of efficiency (CE) for verification. The ST statistic compares the direction of change in tree-ring width from one year to the other in the observed and the predicted data set. This test counts the number of agreements and disagreements between both series. A significant relation between the observed and predicted chronology is accepted if the number of agreements is significantly larger than the number of disagreements ([22]). The PM statistic calculates the product of observed and predicted yearly departure from their respective mean values. The products of agreements and disagreements are summed up separately, and the difference between both sums is tested with the t-statistic ([22]). The RE and CE statistics provide other methods to test the strength of associations between observed and predicted values, which both result in values from - ∞ to + 1 ([12]). RE and CE > 0 indicate that the predicted values are better than the mean of the observed values in the calibration period (RE) and in the verification period (CE). For details, see Fritts ([22]) and Cook et al. ([12]).
Climate change scenario
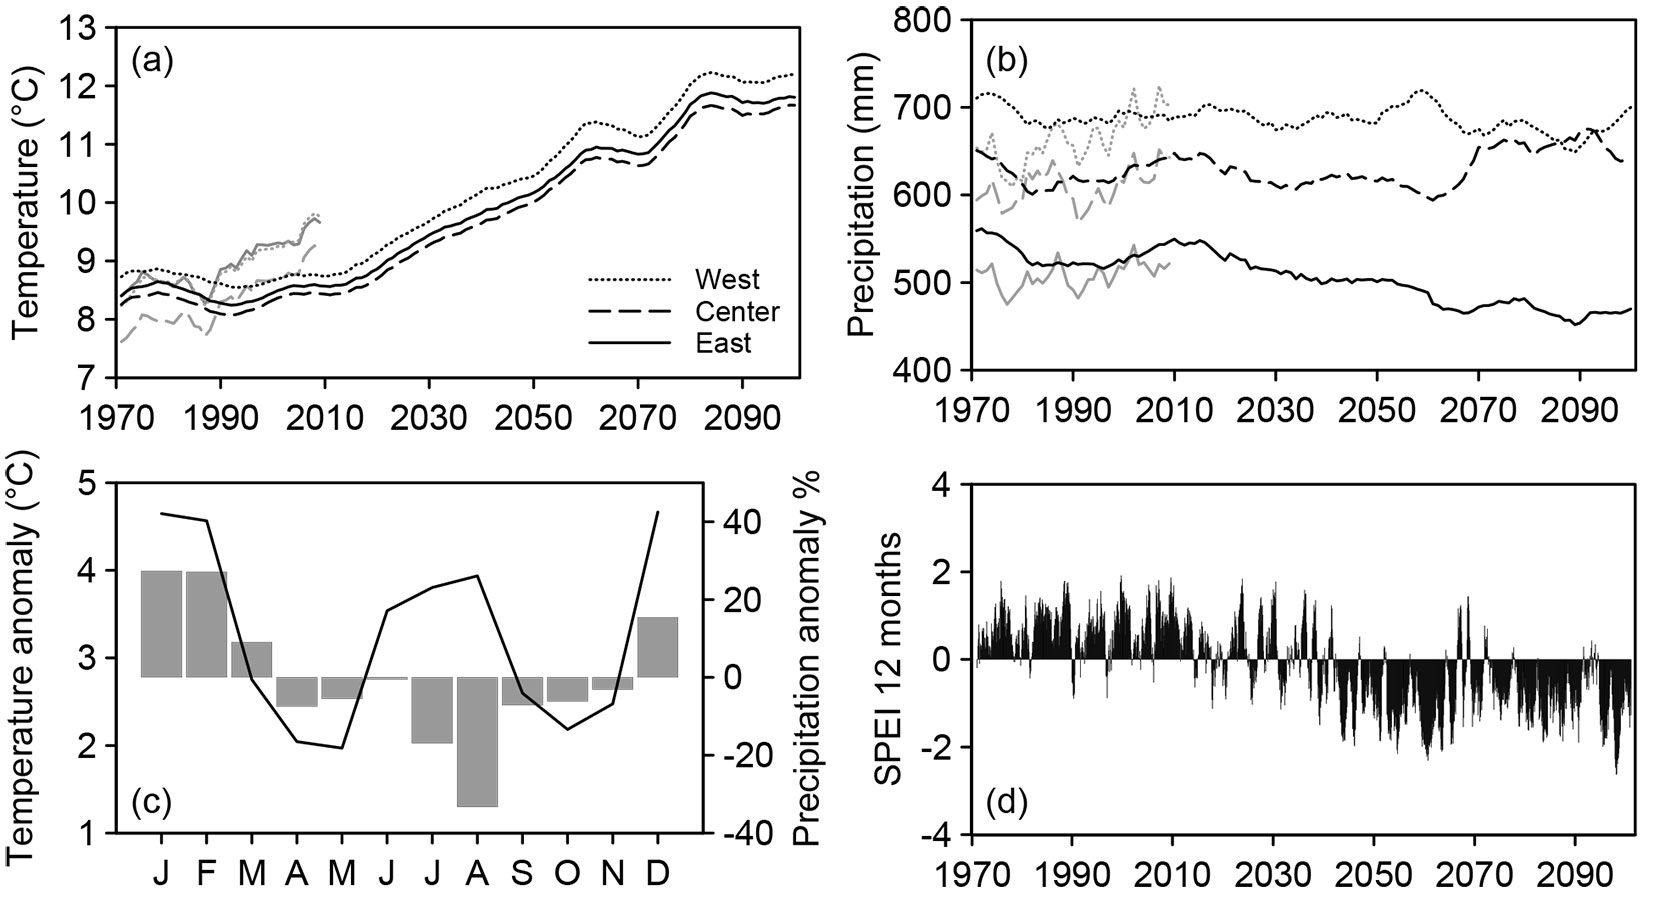
Future weather data (Fig. 2) were taken from the regional climate model WETTREG2010 ([34]). WETTREG2010 uses a statistical downscaling method and is forced by the atmospheric general circulation model ECHAM5/MPI-OM ([54]). It provides daily weather data until 2100. To forecast the tree-ring growth of the three tree species under study, the greenhouse gas emission scenario A1B was assumed. Scenario A1B is based on a balanced emphasis on all energy sources ([30]). Data are available in ten data sets for 398 climate and 3012 precipitation stations across Germany. For each site, we used the data from the nearest precipitation (4-7 km) and climate stations (4-24 km) for every site, and applied the final models to predict future RWIs for all ten data sets. To evaluate growth trends, we used the following periods for comparison: 1971-2000 as reference period, 2021-2050 as near future and 2071-2100 as distant future.
Fig. 2 - Climate projections according to the A1B emission scenario of the regional climate model WETTREG2010 for the period 1971-2100. (a) Mean annual temperature and (b) annual precipitation with corresponding observed values for the period 1971-2010 (gray lines). (c) Monthly deviation of temperature and precipitation in the distant future (2071-2100) from the reference period (1971-2000) averaged over the study sites. (d) Twelve-months standardized precipitation-evaporation index (SPEI) for the central beech/oak site.
Results
Calibration and verification
Chronology statistics showed that for the common period 1910-2009 the EPS was well above the generally applied threshold of 0.85 ([68]) for all species at all sites. A comparatively high Rbar between 0.34 and 0.59 indicates a common (climatic) forcing for all species (Tab. S1, Fig. S1 in Appendix 1).
The number of variables and the selection of climatic elements that entered the final models differed slightly among the sites (Tab. 3). The number of predictors in the final regression models, on the basis of 162 source variables, were relatively low, and ranged from 5 (Pinus, west) to 10 (Fagus, east) with a mean value of 8. In general, all climatic elements were relevant for model building, except SPEI24 which was only significant for the central pine stand. Variables of the growing year were more important (n=67) than variables of the previous year (n=26). Some seasonal patterns were observed: variables of the summer months were most frequently retained in the models, whereby June dominated the SPEI variables at the one and three month time scales, and July and August dominated the temperature variables (mean, min).
Tab. 3 - Climate variables of the final regression models. Numbers refer to months of the growing year. (*): indicates months of the previous year.
| Study Site | Precipitation | Temperature | SPEI | ||||||
|---|---|---|---|---|---|---|---|---|---|
| max | mean | min | 01 | 03 | 06 | 12 | 24 | ||
| Pine West | - | 2 | 2 | - | 6*/6 | - | - | 9 | - |
| Pine Center | 6 | 2/5/10 | 3/8 | 5* | - | - | - | - | 1 |
| Pine East | 9* | 10 | - | 8 | 3/5/6 | - | - | 7 | - |
| Beech West | - | - | 12* | 2/7/10 | 6 | 7 | 3 | 1/9 | - |
| Beech Center | 11* | - | - | 6* | 6 | 9*/7/10 | - | - | - |
| Beech East | 8 | 10 | 6*/10* | 7 | - | 6/7 | 12* | 6*/12* | - |
| Oak West | 4/6 | - | - | 10* | - | 7 | 7*/8 | 6 | - |
| Oak Center | 1 | 6* | 10*/8 | - | 6/7 | 9* | - | - | - |
| Oak East | 1/2/5/8 | - | - | 8 | 6 | - | 10 | 6 | - |
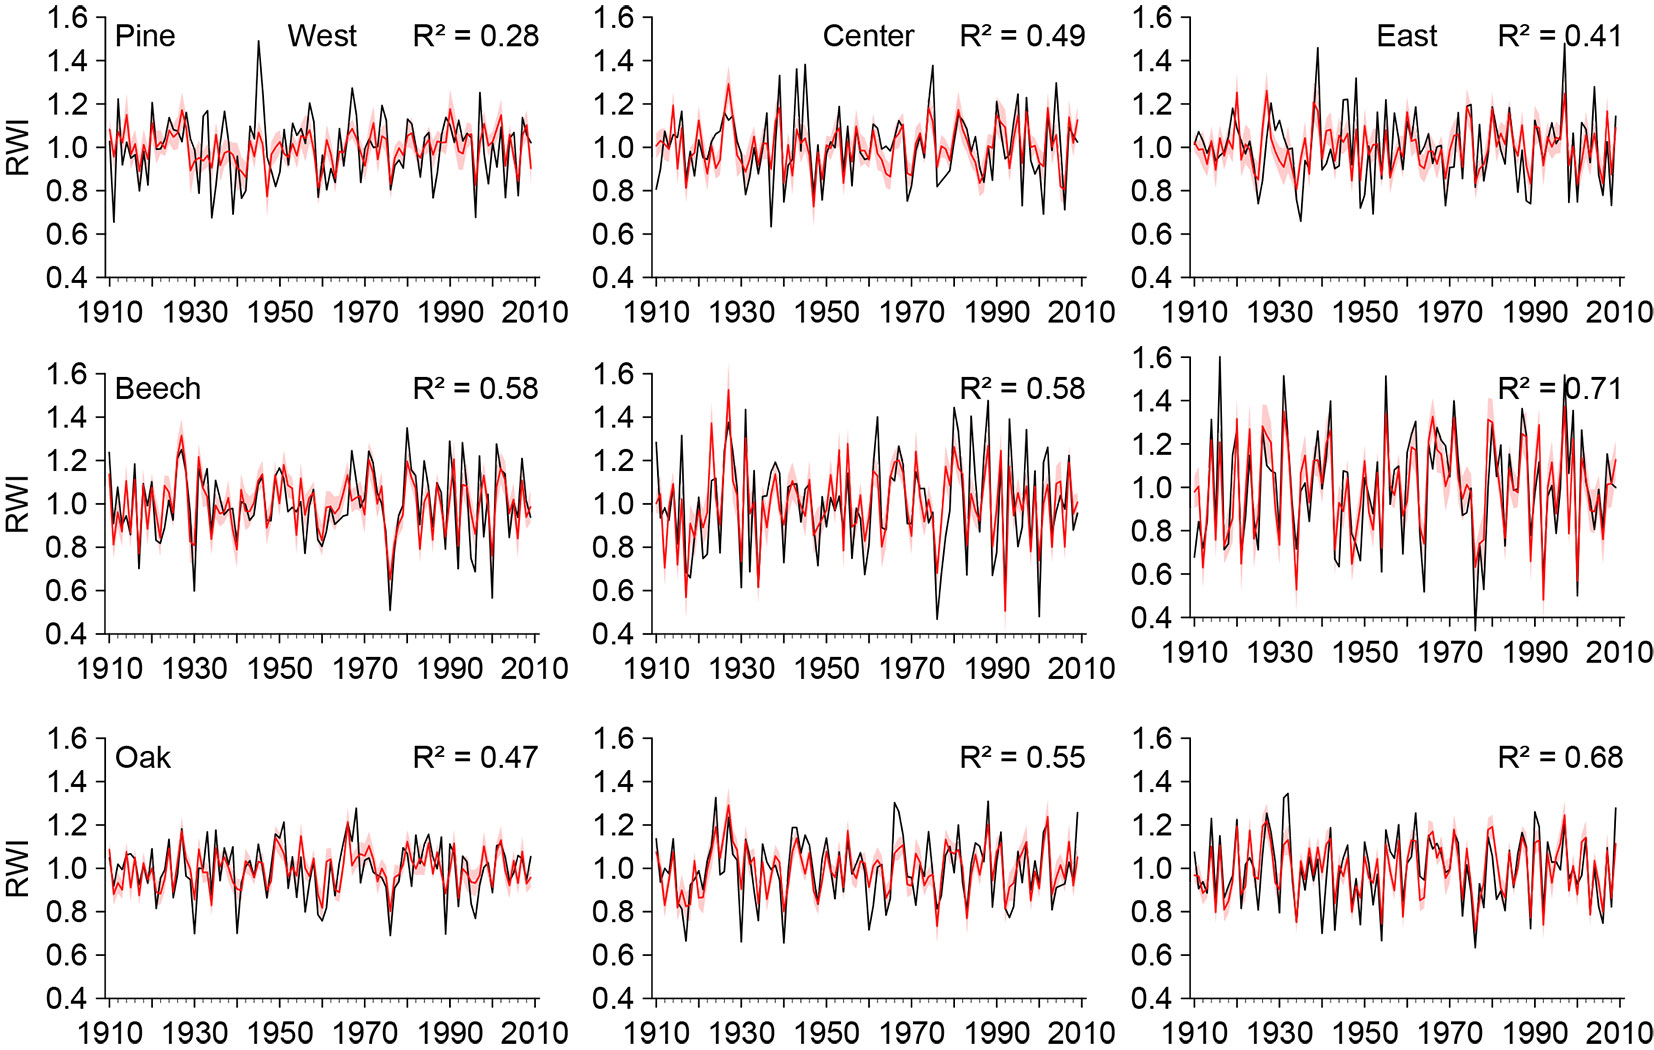
The final regression models were able to reproduce the tree-ring growth for both the mixed beech and oak stands and the pine stands (Tab. 4, Fig. 3). The goodness-of-fit parameters of the models revealed two general patterns: (i) prediction accuracy was species-dependent and increased in the order from pine, to oak, to beech; and (ii) prediction accuracy was location-dependent, with a higher predictive power eastwards for all three tree species. One exception from the latter was the central pine stand, at which the predictive performance was slightly higher than in the east. The adjusted coefficients of determination over the 50-year calibration period ranged from comparably low (adj. R² = 0.24) for the western pine stand to very high (adj. R² = 0.67) for beech at the eastern site (Tab. 4). Coefficients of determination (R²) for the verification period were only slightly lower, ranging from 0.21 for the western pine stand to 0.62 for beech at the eastern site. The sign test (ST), the cross-product means test (PM), the reduction of error (RE), and the coefficient of efficiency (CE) indicated that all models properly predicted the tree-ring growth, hence the inter-annual change and the magnitude of tree-ring width. These four tests showed fair values for the pine stands and excellent values for beech and oak, especially in the east (Tab. 4). In addition, the low standard deviations of the quality parameters indicate that the developed models were robust and valid for any chosen data set for calibration and verification.
Tab. 4 - Calibration and verification statistics of the regression models. The observation period is 1910-2009. One-hundred calibration-verification runs were conducted with 50 randomly chosen years for calibration and the rest for verification. (R²): coefficient of determination; (RMSE): root mean square error; (ST): sign test (p < 0.05 if n(-) < 18); (PM): cross-product means test (p < 0.05 if PM > 1.677); (RE): reduction of error (satisfactory if RE > 0); (CE): coefficient of efficiency (satisfactory if CE > 0). Mean values and standard deviations are given.
| Study Site | Calibration | Verification | |||||||
|---|---|---|---|---|---|---|---|---|---|
| R² | adj. R² | RMSE | R² | RMSE | ST (+/-) | PM | RE | CE | |
| Pine West | 0.32 ± 0.06 | 0.24 ± 0.07 | 0.098 ± 0.007 | 0.21 ± 0.06 | 0.109 ± 0.008 | 32/17 ± 3 | 4.19 ± 0.38 | 0.15 ± 0.11 | 0.11 ± 0.12 |
| Pine Center | 0.53 ± 0.06 | 0.43 ± 0.07 | 0.079 ± 0.008 | 0.38 ± 0.07 | 0.095 ± 0.009 | 36/13 ± 3 | 4.56 ± 0.51 | 0.34 ± 0.10 | 0.31 ± 0.10 |
| Pine East | 0.44 ± 0.08 | 0.34 ± 0.10 | 0.092 ± 0.007 | 0.32 ± 0.07 | 0.108 ± 0.009 | 34/15 ± 3 | 3.96 ± 0.50 | 0.26 ± 0.13 | 0.24 ± 0.14 |
| Beech West | 0.62 ± 0.06 | 0.54 ± 0.08 | 0.078 ± 0.007 | 0.46 ± 0.08 | 0.098 ± 0.010 | 36/13 ± 3 | 4.06 ± 0.59 | 0.42 ± 0.13 | 0.40 ± 0.14 |
| Beech Center | 0.61 ± 0.06 | 0.56 ± 0.07 | 0.115 ± 0.009 | 0.52 ± 0.07 | 0.133 ± 0.010 | 38/11 ± 3 | 4.25 ± 0.45 | 0.48 ± 0.10 | 0.45 ± 0.11 |
| Beech East | 0.74 ± 0.05 | 0.67 ± 0.06 | 0.098 ± 0.010 | 0.62 ± 0.07 | 0.128 ± 0.012 | 39/10 ± 3 | 5.18 ± 0.60 | 0.60 ± 0.08 | 0.58 ± 0.09 |
| Oak West | 0.50 ± 0.07 | 0.42 ± 0.08 | 0.066 ± 0.006 | 0.36 ± 0.08 | 0.080 ± 0.007 | 35/14 ± 3 | 4.05 ± 0.44 | 0.33 ± 0.12 | 0.30 ± 0.14 |
| Oak Center | 0.59 ± 0.06 | 0.53 ± 0.07 | 0.072 ± 0.007 | 0.47 ± 0.07 | 0.087 ± 0.008 | 37/12 ± 3 | 4.55 ± 0.40 | 0.44 ± 0.09 | 0.42 ± 0.09 |
| Oak East | 0.70 ± 0.05 | 0.65 ± 0.06 | 0.067 ± 0.007 | 0.60 ± 0.07 | 0.081 ± 0.007 | 38/11 ± 3 | 5.48 ± 0.54 | 0.59 ± 0.09 | 0.57 ± 0.09 |
Fig. 3 - Observed (black) and predicted (red) ring-width indices (RWI) over the calibration period 1910-2009 with 95% confidence interval (light red bands). (R²): coefficient of determination.
Radial-growth forecast
The predicted chronologies, based on the regional climate model, are in the range of the observed data for the common period 1971-2009 (Fig. 4) and illustrate the good agreement of the climate model with the actual climatic conditions over the past 40 years (see also Fig. 2). Excellent fits were obtained for all pine stands, and for beech and oak at the central site as well. For the western and eastern mixed stands of beech and oak, slightly higher RWIs were predicted for the reference period. Since the simulated chronologies depicted in Fig. 4 are the mean of 10 predicted chronologies constructed from 10 WETTREG2010 simulations, inter-annual dynamics appear much lower as compared with the observed RWIs.
Fig. 4 - Predicted ring-width indices (RWI) for pine, beech, and oak in the regions west, center, and east as mean values of 10 WETTREG2010 simulations (red lines) and standard deviations (light red bands). Observed chronologies for the period 1970-2009 are also shown for comparison.
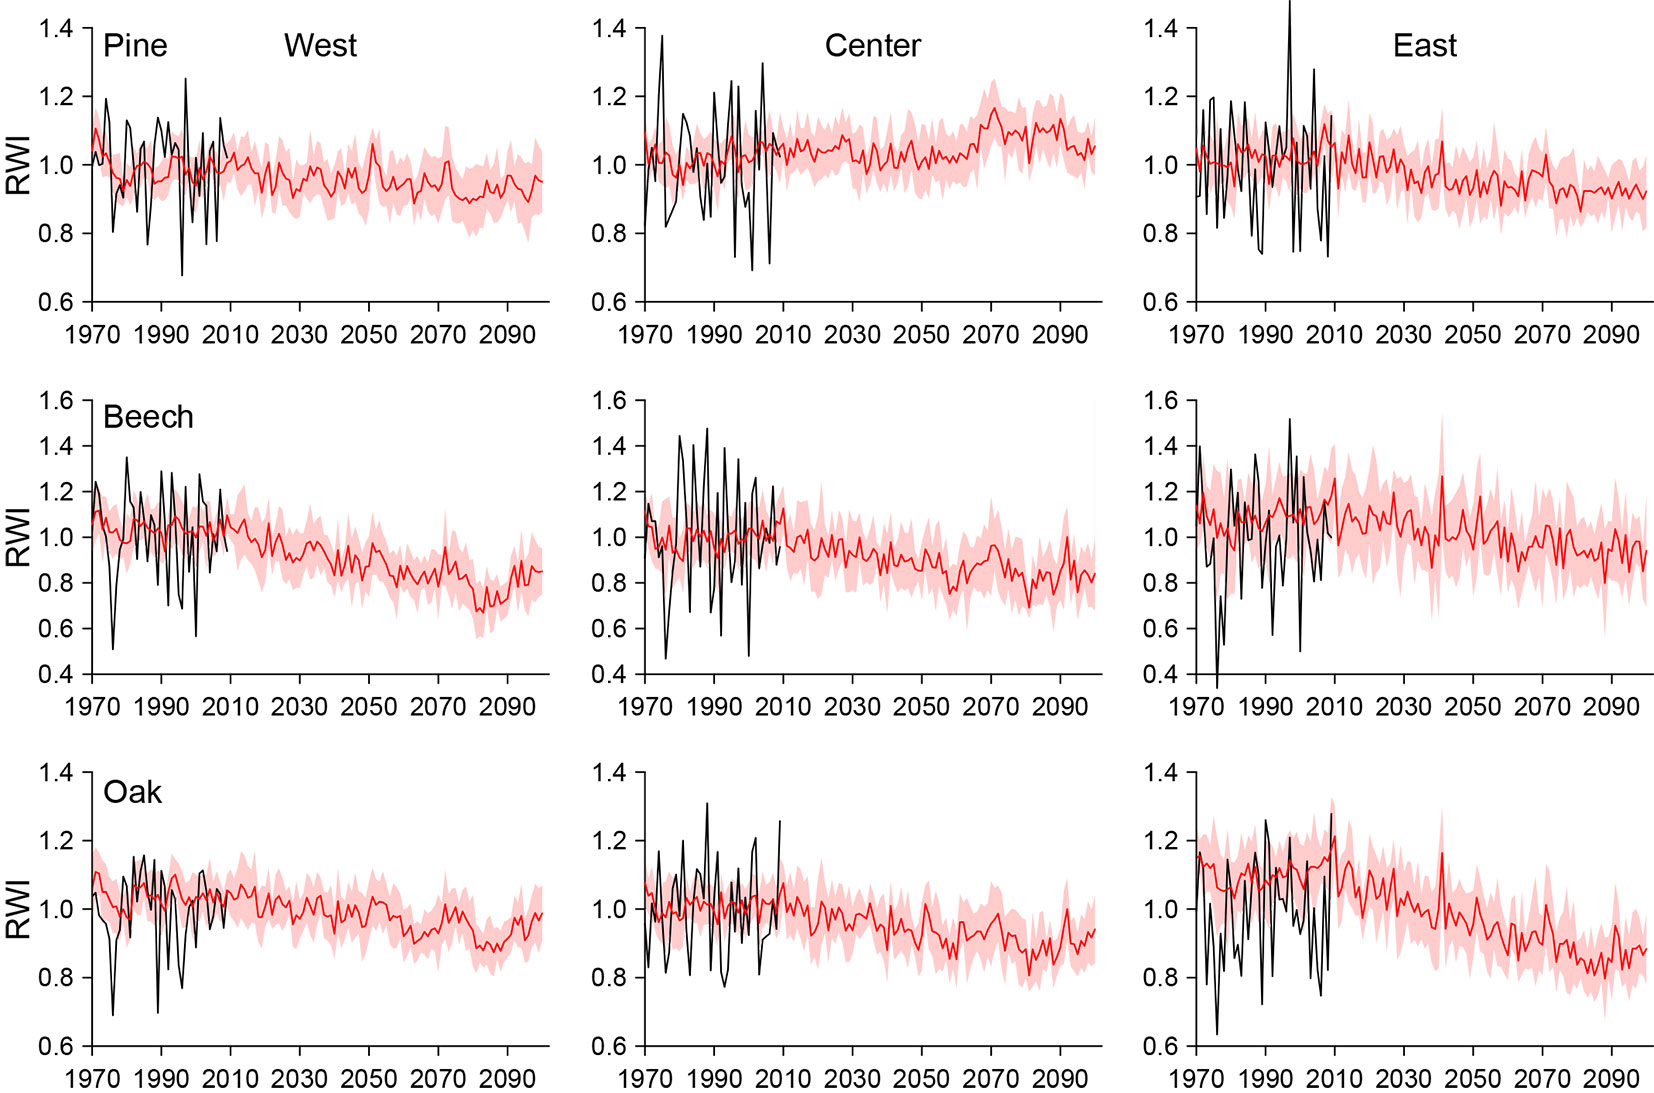
The models yielded different trends in tree-ring indexes under future climate scenarios (Fig. 4). The chronologies illustrate a tendency of decreasing tree-ring widths towards the end of the 21st century (Fig. 4, Fig. 5). The strength of this trend varies both across species and regions. For pine, a weak decrease of RWI is projected for the western (-3.5%) and the eastern stand (-4.5%) in the near future (2021-2050) compared to the reference period (1971-2000). In contrast, the central stand will experience a slight increase of 1.5% over the same period. The tree-ring growth of beech and oak is projected to decrease at all sites in the near future. For these tree-species, the strongest change of RWI was predicted for beech in the West (-11%) and oak in the East (-8%). The predicted trends for the near future will continue for all three tree species up to the year 2100. For the distant future (2071-2100), the most extreme growth depressions were predicted for beech at the western (-23%) and for oak at the eastern site (-20%) compared to the reference period, whereas a slight growth increase is projected for pine at the central site (+7%).
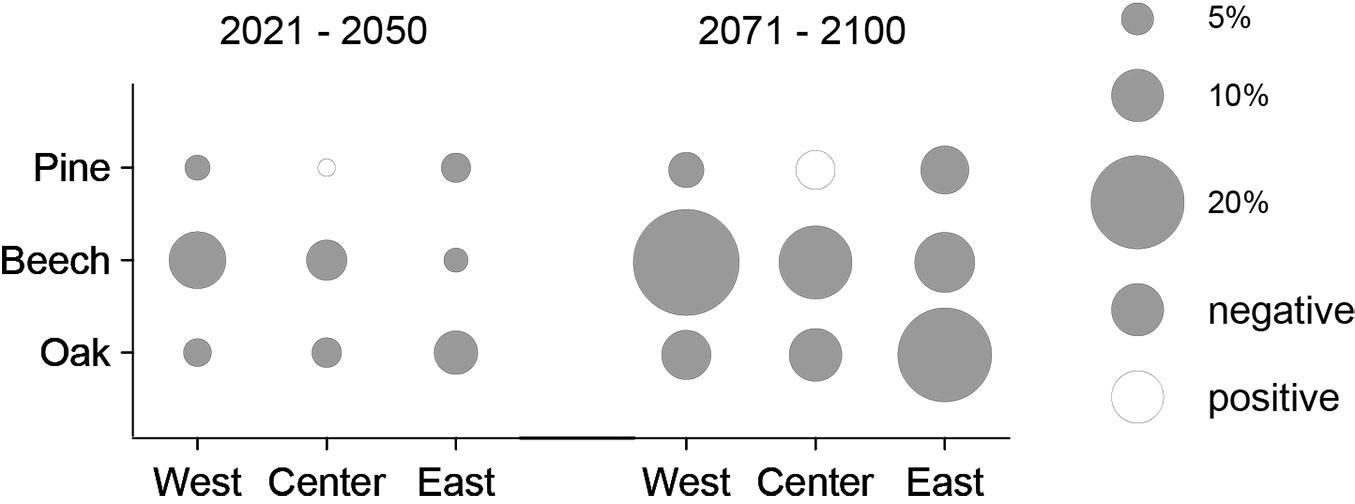
Fig. 5 - Percentage change of ring-width indexes for pine, beech, and oak and the regions west, center, and east between the reference period (1971-2000) and both the near (2021-2050) and the distant future (2071-2100). The size of the circles represents the mean change according to 10 WETTREG2010 simulations.
Discussion
Calibration and verification
The calibration-verification approach that we used had, to our knowledge, not yet been applied before to tree-ring growth forecasts. In contrast to comparable studies that divided the entire data set once into two periods for calibration and verification ([36], [59]), we randomly selected half of the observation years for calibration and the remaining half for verification and repeated this procedure many times. This results in a large number of regression models with the same predictors but different coefficients, depending on the chosen calibration years, and allows a comprehensive evaluation of the robustness of the final model and the quality of the predictors by analyzing the statistical spread across the calibration-verification runs. Two statistics show the high robustness of the regression models: (i) the low standard deviations of the goodness-of-fit parameters indicate that the chosen predictors yielded similar growth estimations for any chosen data subset; and (ii) the values of the verification statistics were only slightly weaker compared to the calibration statistics for all 9 regression models, indicating that all models represent new data very well.
The quality of the resulting models is also supported by the fact that most of the retained predictor variables have an eco-physiological meaning. The dominance of variables representing data of June and July of the growing year illustrates the importance of early summer weather conditions, the period of maximum ring growth, for radial increments of all three tree species ([38], [16], [20]). In addition, the frequent occurrence of previous years’ parameters illustrates the importance of preceding weather conditions such as severe drought periods for tree growth ([55]). Nevertheless, some variables or variable combinations are not easily explained with eco-physiological processes. For example, the inclusion of November precipitation of the previous year for beech at the central site in the final model is difficult to explain, and it may be that a small number of predictors were retained because of statistical mathematics only. To avoid the inclusion of spurious interaction terms, the models could have been constructed with a restricted number of exclusively significant climate variables resulting from foregoing correlation and/or response function analysis ([59]), including the removal of inter-correlations. However, we favored to include all variables into model building to allow for capturing potential lag effects or hidden interactions between environmental factors affecting tree-ring growth.
The large number of SPEI-variables in the final regression models demonstrates that the inclusion of this parameter was beneficial. Moreover, the incorporation of this multiscalar drought index ([64]) across different time scales took into account the fact that the strongest relationships between tree-ring width and drought indexes are usually found for time scales larger than one month. The relevant time scales seem to be species- and site-dependent ([45], [65]). This was also apparent in our models, in which one month SPEIs were often selected as predictors for pine, whereas SPEIs over longer time scales (3-12 months) were frequent in the final models for beech and oak.
Tree growth response to a changing climate
Scots pine
According to our results the direct impact of changing climatic conditions on pine growth in northeastern Germany will be moderate. Divergent growth trends with slight growth reductions in the west and east and a slight growth increase at the central site were predicted. The comparably low predictive power of the final regression models suggests a weak climatic forcing on tree-ring growth of Scots pine. Climatic differences across the study area did not influence growth trends of pine, which may be related to the good climatic adaptation of this species in the northeastern German lowlands ([2]). In line with the findings of Von Lührte ([66]) and Bauwe et al. ([2]), we found an influence of winter temperatures on pine growth for the western and central stand. The growth promoting influence of warmer winters in the climate projections, thus, seems to balance the negative impact of increasing summer drought (inclusion of SPEIs referring to June in the models). Together with the relatively high drought resistance of Scots pine, this might explain the more or less stable future growth trends in our models.
These results confirm that in the temperate lowland forests of north-east Germany Scots pine experiences optimal growth conditions in a physiological sense ([18]). On a broader European scale, increased growth trends for far northern and decreased growth trends for central and southern Europe have been suggested ([52]). Our results with indifferent and weak growth trends match these findings, thus it can be assumed that northeastern Germany is located in the transition zone from the increasing growth trends northwards to the decreasing growth trends southwards. However, although no growth trends were found throughout the 20th century ([49], [33]), a potential growth decline in central Europe is expected for Belgian ([33]) and for northeastern German ([49]) pine stands. Overall, our results suggest that potential future risks for Scots pine trees are not primarily direct effects of changing climatic conditions but may rather be driven by possible biotic disturbances such as needle-feeding and bark-breeding insects ([35]).
Common beech
The regression models predicted a notable decline in growth trends at all investigated sites for beech until 2100. The good predictive power of the models suggests a relatively strong climate signal in the tree rings of beech in northeastern German lowlands. In particular, the large number of variables for temperature and SPEI referring to June and July underlines the importance of early summer weather conditions for tree-ring growth. Soil water availability in early summer has been identified as the main driver for beech growth at different locations and under different site conditions in central Europe ([14], [38], [20], [55], [56]). Rising temperatures and a fall in the amounts of precipitation in spring and summer will trigger more frequent drought periods in the upcoming decades, which presumably will lead to less growth for beech in the northeastern German lowlands. Our model forecasts confirm an ongoing trend during several decades and that is likely to continue. For example, increased drought sensitivity of beech has been observed at low mountain forest sites with different site conditions both in western/central Germany ([20]) and at our study sites ([55]) during the last decades. Moreover, several factors ascribed to global change have already negatively affected the growth of beech at different locations in Europe ([31], [46], [33], [29]).
The larger growth reduction at the wetter western stand (-23%) in comparison to the drier eastern stand (-12%) was surprising. The study plots were selected under the premise of similar properties with respect to soil conditions and stand structures. Because of the similarity of the stands, it seems unlikely that the larger growth reduction at the wetter western stand is driven by site-related attributes. Different site-specific adaptations are a much more likely explanation. An increase in sensitivity together with a higher frequency of negative pointer years at the western compared to the eastern site during the last decades was observed by Scharnweber et al. ([55]). A better adaptation of beech forests to climatic extremes at dry sites have also been observed for forests in Luxemburg ([29]) and in Switzerland ([67]). In the last quarter of the 20th century, Weber et al. ([67]) observed increased drought sensitivity at mesic sites, while drought sensitivity remained nearly constant at dry sites, suggesting a better adaptation of beech forests to climatic extremes at dry sites. Härdtle et al. ([29]) reported of a similar sensitivity to long-term shifts in temperature and precipitation both for stands with sufficient and poor water supply in temperate lowland beech forests in Luxemburg, and state a strong adaptation of trees growing at dryer sites. Taking up our model projections and these recent findings, we conclude that trees at the drier eastern site might be better prepared to projected climate change. Trees growing at the wetter western site might respond with growth depressions due to a higher frequency of drought periods in the future.
It must be noted that the mixed composition of beech and oak trees in our study sites may have affected the climate- growth relationships and consequently the modeling results. The deeper rooting oaks may alter the soil water conditions considerably due to their hydraulic lift. This may lead to a drought-stress release for beech trees ([48]). Consequently, drought reactions of mixed beech forests differ from those in pure stands. This means that in a strict sense our results should only be generalized for mixed forests. However, the general tendency of decreasing future growth will likely be the same in pure stands and, without facilitation by surrounding oaks, even stronger.
Pedunculate oak
The regression models predicted decreasing growth rates for pedunculate oak until 2100 at all investigated sites. The predictive power was slightly lower compared to beech, but still high enough to suggest a strong climate signal in the tree rings. As for beech, tree-ring growth seems to be mainly driven by early summer weather conditions, as indicated by the large number of predictor variables for such months. This is in accordance with a bundle of European studies that identified soil water availability in early summer as the main growth limiting factor for oak ([32], [16], [20], [55]). Due to climate change, drought periods are expected to be more frequent in the future ([39], [25]), probably inducing growth reductions of oak in northeastern Germany.
Our results are in contrast with those from temperate lowland oak forests of Belgium ([33]) and France ([3], [5]) reporting increased growth rates. The first study attributed the increased oak growth to the increase of temperature in the growing season, the latter suggested a number of environmental changes in, inter alia, temperature regime, CO2 concentration, and N deposition as drivers of increased growth rates for both sessile and pedunculate oak in northern and northeastern France. One possible explanation for the projected reductions in growth rates at our study sites could be the poor soils consisting mainly of sand with medium to low water storage capacity ([55]), whereas the oaks analyzed by Kint et al. ([33]) grow on deep loamy soils with excellent water holding capacity. The impact of sufficient water supply on tree-ring growth was reflected in notably higher growth reductions in the east compared to the west. The models showed that different precipitation regimes across the northeastern German lowlands may influence the magnitude of future decrease in growth rates for oak substantially. An increased climate forcing resulting from decreasing precipitation eastwards has been described previously ([55]). Already in the recent past, unfavorable environmental conditions such as summer drought or winter frost combined with biotic disturbances have led to oak decline in central Europe ([61]). However, general estimates of future growth rates for oak in Central Europe are uncertain ([21]). We recommend caution in transferring the predictions made for northeastern Germany to broader regions, because climate is not the only forcing factor here, and the future growth of oak depends on multiple environmental factors.
Uncertainty and limitations
Our predictions are based on average population series instead of individual tree chronologies. This approach may have implications on the overall results. It has been shown by Carrer ([8]) that due to the chronology computation procedure (averaging) the climate responsiveness of single trees is often overestimated. In our case this would mean that the modeled trends of declining growth are possibly slightly overestimating the “real” trend of single trees. However, Carrer ([8]) concludes that the application of average population series, as in our study, is the most effective way to extract the climatic signal from the tree-ring sequences. Due to the inherent age trend of the raw data and possible influences of management and other disturbances, it was necessary to base our models on detrended ring-width indexes. The applied detrending procedure might also have removed potential climatically-induced long-term growth trends. We assume this potential bias is small because the conservative negative exponential detrending - preserving much of the decadal variations - and the rather flexible spline detrending led to very similar index chronologies.
We predicted the response of the tree-ring growth solely on the basis of projected meteorological variables. When interpreting the results one should be aware of the boundary conditions of the modeling approach and the subsequent restrictions. First of all, the climatic variables of the greenhouse gas emission scenario are factors of uncertainty ([30]). Secondly, the growth of trees is a function of multiple abiotic and biotic factors of which many were not considered. For instance, growth trends may be influenced by further CO2-enrichment of the atmosphere ([1], [28], [41]) and the associated possible increase in intrinsic water use efficiency of trees ([19]), changes in nitrogen deposition ([58], [37]) or increasing occurrence of defoliating insects ([40], [61]) due to global warming. Therefore, our predictions should be considered as growth scenarios that may be refined by future analyses of other abiotic and biotic variables affecting tree growth.
Conclusions
We were able to predict future tree-ring growth of Scots pine, common beech, and pedunculate oak based on rigorous variable selection using PLSR and OLSR techniques, and a comprehensive calibration-verification scheme. Our projections are based on a regional climate change scenario with moderate forcing and suggest that climate change will influence tree-ring widths, i.e., radial growth of the three major tree species in northeastern Germany during the 21st century. The impact of regional climate change seems to be species-dependent. Whereas Scots pine has a great potential to remain an important tree species, able to deal with the projected warmer and dryer conditions without any greater impairment, beech and oak are expected to suffer a moderate growth decline in the future. Projected future growth varies across the study area with larger growth reductions for oak towards the drier east. In contrast, site-specific adaptations for beech seem to override the influence of different precipitation regimes.
Forest management should be adapted to mitigate the possible negative effects of climate change in particular for beech and oak. Although the study area is restricted to the northeastern German lowlands, it is likely that the estimated growth trends for Scots pine and common beech can be extended to similar landscapes in central Europe. In the case of pedunculate oak, a general transfer of our results to other regions is not advisable, since this species is currently affected by a complex interplay of biotic and abiotic pathogens, the so called “oak-decline” ([61], [42], [13]). Since our predictions are based on meteorological variables only, the analysis of the impact of other important abiotic or biotic factors potentially affecting the future tree growth may be necessary to obtain a more comprehensive picture of potential future risks on forest vitality due to climate change.
Acknowledgements
AB developed the research idea and wrote the manuscript with input from GJ, TS and BL. AB and GJ performed the statistical analysis. TS and CS collected and prepared the tree-ring data for analysis. BL was involved in the design of the study. All authors were involved in the manuscript revision prior submission. We thank the regional forest management (Landesforstanstalt Mecklenburg-Vorpommern, Germany) for their valuable support during field-work and for the provision of data. The study was financed by the “Exzellenzförderprogramm” of the Ministry of Education, Science and Culture of the Federal State Mecklenburg-Vorpommern - UG 08-035). This study is a contribution to the Virtual Institute of Integrated Climate and Landscape Evolution Analysis -ICLEA- of the Helmholtz Association.
References
Gscholar
Gscholar
CrossRef | Gscholar
Gscholar
Gscholar
Gscholar
Gscholar
Online | Gscholar
Gscholar
Gscholar
Authors’ Info
Authors’ Affiliation
Gerald Jurasinski
Bernd Lennartz
Faculty of Agricultural and Environmental Sciences, University of Rostock, Justus-von-Liebig-Weg 6, D-18059 Rostock (Germany)
Christian Schröder
Institute of Botany and Landscape Ecology, University of Greifswald, Soldmanntr. 15, D-17487 Greifswald (Germany)
Corresponding author
Paper Info
Citation
Bauwe A, Jurasinski G, Scharnweber T, Schröder C, Lennartz B (2015). Impact of climate change on tree-ring growth of Scots pine, common beech and pedunculate oak in northeastern Germany. iForest 9: 1-11. - doi: 10.3832/ifor1421-008
Academic Editor
Andrea Cutini
Paper history
Received: Aug 05, 2014
Accepted: Sep 07, 2015
First online: Oct 13, 2015
Publication Date: Feb 21, 2016
Publication Time: 1.20 months
Copyright Information
© SISEF - The Italian Society of Silviculture and Forest Ecology 2015
Open Access
This article is distributed under the terms of the Creative Commons Attribution-Non Commercial 4.0 International (https://creativecommons.org/licenses/by-nc/4.0/), which permits unrestricted use, distribution, and reproduction in any medium, provided you give appropriate credit to the original author(s) and the source, provide a link to the Creative Commons license, and indicate if changes were made.

Web Metrics
Breakdown by View Type
Article Usage
Total Article Views: 45828
(from publication date up to now)
Breakdown by View Type
HTML Page Views: 36874
Abstract Page Views: 2660
PDF Downloads: 5179
Citation/Reference Downloads: 37
XML Downloads: 1078
Web Metrics
Days since publication: 3112
Overall contacts: 45828
Avg. contacts per week: 103.08
Article Citations
Article citations are based on data periodically collected from the Clarivate Web of Science web site
(last update: Feb 2023)
Total number of cites (since 2016): 22
Average cites per year: 2.75
Publication Metrics
by Dimensions ©
Articles citing this article
List of the papers citing this article based on CrossRef Cited-by.
Related Contents
iForest Similar Articles
Research Articles
Daily prediction modeling of forest fire ignition using meteorological drought indices in the Mexican highlands
vol. 14, pp. 437-446 (online: 28 September 2021)
Research Articles
Comparison of drought stress indices in beech forests: a modelling study
vol. 9, pp. 635-642 (online: 06 May 2016)
Research Articles
Leaf transpiration of drought tolerant plant can be captured by hyperspectral reflectance using PLSR analysis
vol. 9, pp. 30-37 (online: 05 October 2015)
Research Articles
Climatic fluctuations trigger false ring occurrence and radial-growth variation in teak (Tectona grandis L.f.)
vol. 9, pp. 286-293 (online: 28 September 2015)
Research Articles
The effects of fire on Pinus sylvestris L. as determined by dendroecological analysis (Sierra de Gredos, Spain)
vol. 15, pp. 171-178 (online: 09 May 2022)
Research Articles
Growth-climate relations and the enhancement of drought signals in pedunculate oak (Quercus robur L.) tree-ring chronology in Eastern Hungary
vol. 11, pp. 267-274 (online: 29 March 2018)
Research Articles
Variation of major elements and heavy metals occurrence in hybrid aspen (Populus tremuloides Michx. × P. tremula L.) tree rings in marginal land
vol. 13, pp. 24-32 (online: 15 January 2020)
Research Articles
Predicting total and component biomass of Chinese fir using a forecast combination method
vol. 10, pp. 687-691 (online: 17 July 2017)
Review Papers
Climate change impacts on spatial distribution, tree-ring growth, and water use of stone pine (Pinus pinea L.) forests in the Mediterranean region and silvicultural practices to limit those impacts
vol. 14, pp. 104-112 (online: 01 March 2021)
Research Articles
Species-specific responses of wood growth to flooding and climate in floodplain forests in Central Germany
vol. 12, pp. 226-236 (online: 03 May 2019)
iForest Database Search
Google Scholar Search
Citing Articles
Search By Author
Search By Keywords


