Individual tree mortality of silver birch (Betula pendula Roth) in Estonia
iForest - Biogeosciences and Forestry, Volume 9, Issue 4, Pages 643-651 (2016)
doi: https://doi.org/10.3832/ifor1672-008
Published: Apr 04, 2016 - Copyright © 2016 SISEF
Research Articles
Abstract
The functioning of complex forest ecosystems is intimately related to their structural properties. Tree mortality is a major driver of forest stand dynamics and therefore plays an important role in the formation of forest structure. Data from the Estonian Network of Forest Research Plots (ENFRP) was used to estimate the mortality probability of silver birch trees (Betula pendula Roth) by using logistic models. In this study several spatial and non-spatial variables were tested to determine the most important mortality explanatory factors. Additionally, thinning variables were defined and implemented into the mortality models, to examine whether thinning practices could modify the stand structure and density, then leading to a lower mortality rate. The results of this study showed that tree mortality models that included either a five-year diameter growth rate (id5) as a measure of tree vitality, or the tree relative diameter (drel) as a measure of competition, or both these two variables, were substantially better than any models not including these variables. In addition, any measures of spatial aggregation (agg) and species proportion (sp) within the zone of influence markedly improved the model predictions, though the mortality probability of trees declined where there was higher aggregation and species mixture. Our results also suggested that if thinning were conducted around the birch trees, depending on the thinning intensity, the number of neighbors is effectively reduced, and consequently the competition load within the influence zone decreases, leading to healthier growth and lower mortality rates of the shade-intolerant birch trees. We thus recommend to adopt thinning regimes in mixed forest stands to foster tree species diversity, and at the same time provide adequate growing space for birch trees within the stands. This will improve the forest structure and increase the adaptive capacity of forests, which is increasingly important under changing climatic conditions.
Keywords
Betula pendula Roth, Diameter Growth, Species Proportion, Aggregation, Competition
Introduction
Tree mortality is an important driver of forest stand dynamics as it determines the formation of forest structure ([76], [94]). Structural properties of forests are of great importance since they are related to ecosystem functioning and productivity, in its growth and productivity ([6], [37]).
Tree mortality occurs when tree vigor declines due to intolerance of the tree to the negative influence of stress factors, such as drought and competition. These stress factors can lead to a wide variety of causes of tree mortality. To achieve a better understanding of mortality, numerous attempts to categorize its causes have been reported ([93], [76], [99]). As a simplified approach, mortality has been generally considered either as regular, due to competition or ageing, or as irregular, caused by ecological and catastrophic events, such as storm or fire ([67]). The probability of regular mortality is believed to be U-shaped, indicating relatively high mortality rates for small and large trees due to light competition and senescence, respectively ([68], [63], [35]). The probability of irregular mortality is rather fluctuating, and thus quite difficult to predict, since it may be triggered by various biotic and abiotic factors, which change temporally and spatially, e.g., the attack of pests or diseases may cause a comparatively small mortality in one year, or eliminate the host species from the region ([93]).
The ability of a tree to withstand stress factors is affected by a multitude of interacting factors such as tree size, tree viability, competition among trees and stand density ([41]). However, diagnosing these factors as contributors to tree mortality and evaluating their relative importance can be very difficult ([22]); especially in times of global changes it is important to broaden our understanding of tree mortality as a primary driver of changes in the composition and structure of forest communities. Maintaining a forest is essential to provide important services, such as carbon sequestration, water purification, and timber production, as well as future habitats for a large diverse number of species ([25]).
Measurements of tree size can be easily collected (tree diameter and tree height) or computed (tree growth and tree basal area) and to some extent they contain valuable, but not sufficient, information about the probability of tree mortality ([68], [99]). Diameter growth rate ([10]), or as a substitute, crown size ([3], [68]) have proven to be suitable measures of tree vitality in mortality studies.
Competition is the next well-documented contributor to tree mortality. Competition for limited resources (such as water, light and nutrients) is a fundamental ecological process, which has strongly modulated the mortality of suppressed trees ([54], [87]). Competition among individuals can be either asymmetric or symmetric. Under asymmetric competition, larger trees are not affected by smaller trees and can therefore benefit of a greater share of resources, whereas in symmetric competition all trees have an equal share of resources, and therefore impose some competitive influence on their neighbors, regardless of their sizes ([15], [36]). Occasionally, some trees may withstand the competition pressure, but will eventually end up in a “death spiral” ([33]), since trees suffering competition over long periods will weaken and eventually die due to other reasons ([97], [2], [60]).
Theoretically, inclusion of the spatial effects in modeling the competitive environment that surrounds an individual tree is expected to improve the prediction ability of mortality ([5]). An increment in local density is assumed to increase the density-dependent mortality, or self-thinning, since many species are unable to endure deep shading in their dense neighborhood ([42], [39]). In young dense stands where trees are subjected to self-thinning, such assumption was proven to be valid ([75]). Several studies have been conducted to define the limit to the number of trees with a given average size growing in a stand (the so called “limiting density”), depending on the forest type and the environmental conditions ([80], [102], [45], [72], [38]). On the other hand, when stands grow to maturity, generally the size of surviving trees and their spacing increase, and stands become less clumped. In such stands the density-dependent mortality decreases, and trees may die because of other factors, such as pathogen and insect attacks ([55], [34]).
Regarding the fact that any desired tree species may be absent due to self-thinning in a final regular stand, thinning during the early self-thinning years is an acceptable management tool to control stand quality and supports favorable tree species ([83]). Early thinning improves the tree growth by reducing the competition stress for the remaining trees ([75]), while the thinning of suppressed trees at intermediate development stages reduces economical loss from tree deaths ([77]). Thinning to different reduced densities influences the tree mortality rate, and individual trees may react differently to the same treatment. For example, small trees survive better in a less competitive neighborhood ([92]), while the mortality rate of large trees increases due to exposing their crowns to strong winds when neighboring trees are removed ([91]).
We focused our study on the mortality of silver birch trees (Betula pendula Roth), an ecologically essential broadleaf tree species ([46]) and the second most important tree species in Estonia in terms of forest cover (31.2% and this coverage is expanding - [101]). As a pioneer tree species ([31]), silver birch grows naturally in boreal and northern temperate biomes. This species is intolerant to shade and remains vital and vigorous where it occurs as a dominant species in a relatively wide spacing, and under less favorable environmental conditions for other tree species ([46]).
The main objectives of this study were to: (i) filter the variables that are meaningful for the mortality of silver birch trees; (ii) test these variables in an empirical model for their ability to predict mortality of silver birch trees; and (iii) examine whether thinning practices effectively minimize the rate of tree mortality in managed forests.
Materials and methods
Study data
Data from the Estonian Network of Forest Research Plots (ENFRP) was used for this study. This network, consisting of 730 permanent plots, was established during the period 1995-2004, and contains the data for all the main forest types in Estonia ([56]). The Republic of Estonia lies on the eastern shores of the Baltic Sea and along the southern shore of the Gulf of Finland (57.3°-59.5° N, 21.5°-28.1° E). The climate varies from maritime to continental. Average temperature ranges from 16.3 to 18.1 °C in July (the warmest month) and from -3.5 to -7.6 °C in February (the coldest month). Mean annual precipitation is within the range 600-700 mm, and decreases from east to west ([89]).
Clear cutting is the predominant management system in Estonia; consequently overstory trees are mostly even-aged. Most stands have been managed to maintain pure stands, though near-natural situations can occur under good forest growth conditions in any stand after some decades without management. The ENFR permanent plots were circular with a radius ranging from 10 to 30 meters. Depending on the stand age and density, they were delineated so that every plot contained at least 100 trees in the overstory. Within each plot the azimuth, the distance from plot center, the diameter at breast height (d), the tree species identity, and any defects of trees were recorded. For every fifth tree, and also for dominant and rare tree species, the tree height and the height to the live crown base were also measured. The measurements were repeated at intervals of five years.
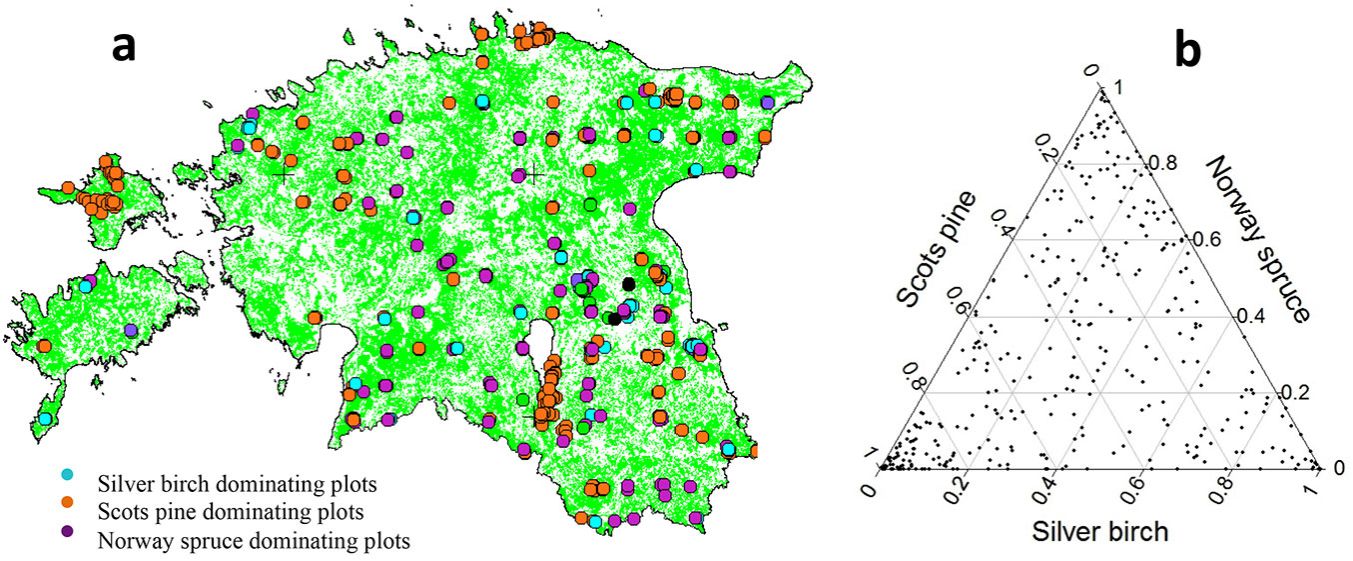
To carry out this study, we selected 422 research plots with three consecutive measurements where silver birch was present. Other plots of the ENFRP network were excluded because either the plots did not include silver birch or at least three measurements taken at five-year intervals were not available. We used the first five-year interval, i.e., the period between the first and second measurements, for the evaluation of growth and thinning rates, and the second five-year interval, i.e., the period between the second and third measurements, for the mortality study. During the first period, trees were harvested within 93 plots with different thinning intensity ranging from 0.1 to 80% of the total number of trees (0.3-60% of the basal area). Seventy-four plots were discarded from the analysis because thinning was practiced within the plots in the second interval, or before the first interval. Overall, 61 685 recorded tree measurements were considered in 348 selected plots. The species composition of the plots was 25.6% Scots pine (Pinus sylvestris L.), 33.9% silver birch, 26.8% Norway spruce (Picea abies L.) and 13.7% of several other species (e.g., Alnus glutinosa L., Alnus incana L. and Populus tremula L.). Fig. 1 shows the distribution of the selected study plots throughout Estonia (a) and the proportion of the three major tree species within those plots (b).
Fig. 1 - (a) The distribution of study plots throughout Estonia, and (b) the proportion of three major tree species within the study plots.
Predictors of tree mortality
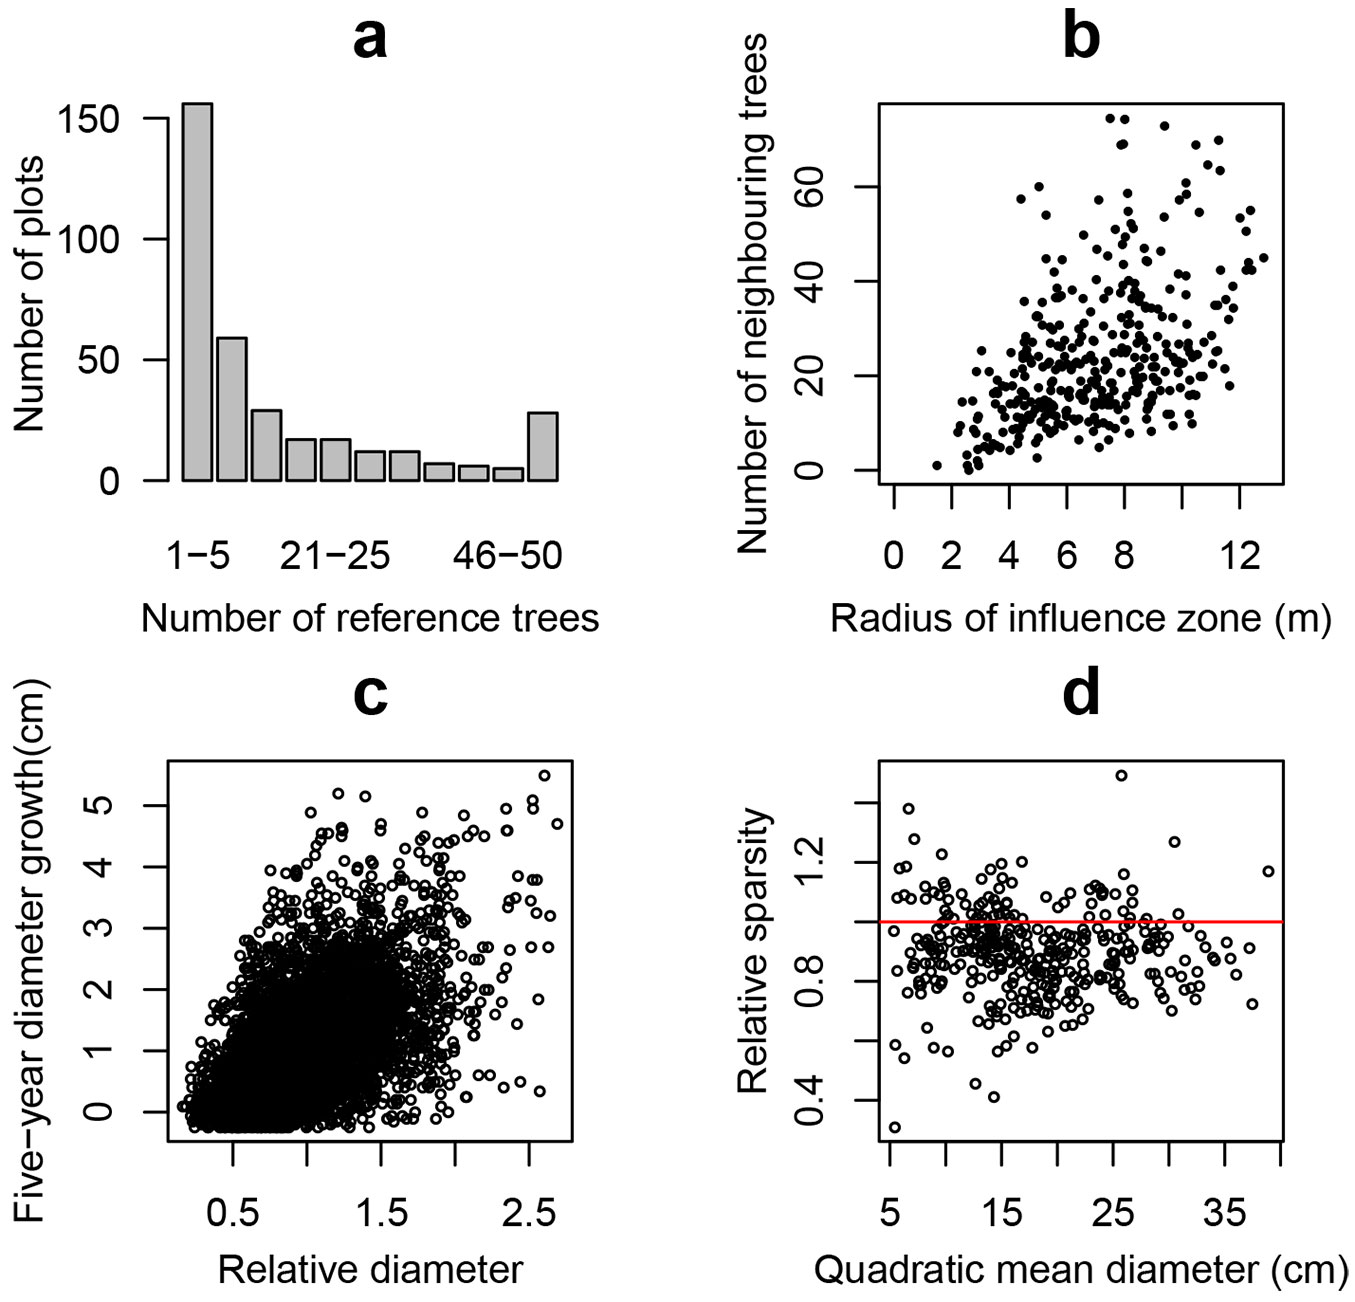
Based on the concept of the influence-zone ([86]) we assumed an imaginary circle in which the center is defined by a tree, and its radius is 40% of the average height of trees in the first storey on each plot ([84], [64]). In order to avoid biased estimations due to the interference from immediate non-measured neighboring trees outside the plot boundary, we established a boundary strip (buffer zone) inside the monitoring plot with a width equal to the radius of the influence zone. The mortality study was performed only for trees inside the reduced plot (reference trees) for which the neighbors’ information was available. The distribution of plots by the number of reference trees, and the plots with an average number of neighbors within the reference trees’ influence zones by the radius of the influence zone are presented in Fig. 2a and Fig. 2b, respectively.
Fig. 2 - (a) Distribution of plots by number of reference trees within the studied plots; (b) relationship between the radius of the influence zone and the average number of neighbors within the reference trees’ influence zones; (c) relationship between the five-year diameter growth and relative diameter in reference tree data set; (d) relationship between quadratic mean diameter and relative sparsity, where plot relative sparsity was calculated as limiting sparsity relative to stand sparsity: Llim / L.
A list of selected variables studied for the contribution in tree death is provided in Tab. S1 of Appendix 1. As we here aimed to investigate the suitability of neighborhood spatial information to predict tree mortality, the variables were classified into spatial (where the neighboring trees’ co-ordinates within the influence zones were required) and non-spatial (where the neighboring trees’ co-ordinates were not used).
Non-spatial variables are simple functions of stand or tree level measurements. In Tab. S1 of Appendix 1 the most common stand variables like density (Nha), basal area (G, m2/ha), site index (SI100, m) and stand age (age, year), were calculated from plot data. Variables Nha and G can be treated as measures of stand density ([29], [11]), while G can be considered as a measurement of symmetric competition ([7]). The site index SI100 was used to measure the site productivity, calculated as the average height of a stand at the reference age of 100 years ([70]).
For non-spatial tree level measurements the following variables were used: tree diameter at breast height (dbh, cm), relative tree diameter (drel) calculated as the ratio of tree and stand diameters, tree five-year diameter growth (id5, cm), tree basal area (g, m2), and the sum of the trees’ basal areas (per plot) larger than the reference tree (BAL, m2 ha-1 - [98]). The tree diameter integrates the past competitive interactions of the reference trees ([85]), while drel shows the dominance of a reference tree related to other trees in the stand. The tree diameter growth rate (id5) is a measure of tree vitality often used in mortality models ([41], [21]). Fig. 2c shows the relationship between the diameter growth and the relative diameter in the reference tree data set. Trees with negative diameter increment were not excluded from the data set in order to avoid bias toward positive growth, because the occurrence of undetectable overestimation of growth is unavoidable. The value of BAL can be used as a measure of asymmetric competition ([68], [99]). When considering the influence of the neighborhood, the alternative estimates of the relative diameter and the sum of the basal area of larger trees (drel.cz and BALcz) were calculated only for trees within the influence zone around each reference tree.
Spatial variables in Tab. S1 of Appendix 1 consisted of the well-known Hegyi ([43]) competition index (CI) as a measure of neighbouring trees’ competition, an aggregation index (agg - [17]) to measure clumping and the different measures of species proportion (sp). Aggregation illustrates the spatial pattern of neighboring trees within the influence zone, where values < 1.0 indicate an aggregated distribution of trees, and values > 1.0 indicate a tendency toward a regular distribution. The species proportion defines the degree of spatial segregation of tree species in the stand. In this study the different values of sp were calculated as follows: (i) the proportion of silver birch trees (spsb); (ii) the proportion of other species that are not silver birch (sp); (iii) the proportion of Norway spruce trees (spns); and (iv) the proportion of Scots pine and other deciduous trees (spT), for all neighboring trees within the influence zone.
An important issue in stand development is the self-thinning, when an increased density-dependent mortality rate is expected due to high competition among individuals. Traditionally, the allometric relationship between stand density (Nha) and diameter (D) has been applied for approximating the self-thinning line ([12]). However, Nilson ([71], [72]) showed the advantage of using stand sparsity (L, m) by a transformation of the stand density (Nha - eqn. 1).
On the basis of normal growth and yield tables used in Estonia (i.e., assuming that they describe the highest possible stand density), sparsity of silver birch stands in a self-thinning situation were calculated as follows ([65] - eqn. 2).
where D and H are stand quadratic mean diameter (cm) and mean height (m), respectively. Fig. 2d presents the relationship between mean square diameter and relative density (Llim/L) where dots with relative sparsity greater than 1.0 (69 studied plots including 17% of reference trees) crossed the self-thinning line.
Finally the thinning variables Ithin and CIred were quantified, where Ithin is the non-spatial measure of the thinning intensity within the plots, and CIred is the spatial measure of the reduced load of competition within the zone of influence, because of the removal of competitors during any thinning practices.
Model fitting and statistical analyses
Mortality is a discrete event that can only take two values (alive or dead), hence logistic functions are widely applied to model probability of tree mortality ([67], [100], [8]). Since data from many plots were used and the number of reference trees were not equal for studied plots, we devised the mortality probability in a generalized linear mixed effects logistic regression for binary mortality data (eqn. 3). The predictors were combinations of different contributors to mortality (see Tab. S1 of Appendix 1) and the plot character was considered as a random effect that estimated the variability in different studied plots. The dependent variable was tree mortality during the second interval (last five-year period). The value of mortality was set equal to 1.0 when a tree was still alive at the time of the third measurement; otherwise the value was set to zero. Given p as the probability of tree survival, 1-p is the probability of tree mortality (eqn. 3):
Assuming that v is the number of predictors, N is the number of observations, and n is the number of plots, then α is the model intercept, X is a N·v matrix of the v predictor variables, β is a v column vector of the fixed effects model coefficients, Z is the N·n design matrix for the random effect (the random complement to the fixed X), γ is a vector of the random effect (the random complement to the fixed β) and ε is a N column vector of the residuals for that part of p that is not explained by the model Xβ+Zγ.
Since the coefficient of determination is not appropriate when discrete variables are modeled ([8]), the goodness-of-fit of the models was assessed using a log-likelihood statistic (loglik), Akaike Information Criteria (AIC), and Akaike weights (AICw). The probability that the model was the best with the lowest expected information loss was determined by the smallest value of AIC and the biggest AICw ([95]). ΔAIC indicates the differences in AIC values between a given model and the model with the lowest AIC value. According to Burnham & Anderson ([13]), we assumed that the models with ΔAIC < 2.0 had a “substantial empirical support” and that these models were almost equal, whereas the models with ΔAIC > 4.0 were considerably different. The accuracy of the models in correctly classifying the trees in dead/alive groups was also tested by the area under the receiver operating characteristic (ROC) curve ([8]). The area under a ROC curve (AUC) quantifies the accuracy of the model, where values > 0.7 indicate good accuracy ([30]). Also, a classification of alive and dead trees for each model was performed using the ideal cut-point, where the sensitivity (true mortality rate) and specificity (true survival rate) curves crossed ([44]). The val.prob function of the rms package in the R statistical software ([81]) was used to assess the accuracy of the models, and to validate the predicted probabilities of the logistic fits against the observed mortality.
Models were developed and selected as follows. Initially, pairwise models were calculated between mortality and each variable presented in Tab. S1 of Appendix 1. The importance of each variable in the pairwise fits was evaluated using the analysis of variances (ANOVA) and the 10 most effective variables were selected based on their AIC values. The significance of thinning variables, Ithin and CIred, on mortality probability of silver birch trees was also tested. About 400 models were fitted with all possible combinations of these selected variables with the restriction that no model could simultaneously include variables representing a similar factor (e.g., one model could only have either CI or BAL as a measure of competition). Models were then compared using AIC values, and the best models, as well as the models with an AICw value greater than zero, were selected.
Finally, the contribution of thinning to the mortality of individual trees was assessed. To this purpose, variables Ithin and CIred were separately added to the selected model as new predictors, and the changes to the quality measure of the full statistical model were investigated. For all models, the glmer function from the lme4 package in the R statistical software was applied. Furthermore, for each combination of variables the variance inflation factor (VIF) was determined to ensure that the models were not strongly biased by multicollinearity.
Results
Over the 348 selected research plots the five-year mortality rate of silver birch trees was 9.67%, i.e., out of 6009 silver birch reference trees 581 died. The mortality rate in pure stands was higher than in mixed stands (Tab. 1). There was a stronger survival probability for a silver birch tree when growing in a neighborhood that consisted of species other than birch, as the mortality rate decreased from 16.67% in a pure silver birch stand to 6.09% for single silver birch trees surrounded by other species, mainly Norway spruce and Scots pine.
Tab. 1 - Mortality rate of silver birch trees depending on silver birch proportion.
| Proportion of birch in influence zone (%) |
Number of reference trees |
Number of plots |
Mortality to survival rate |
Mortality rate (%) |
|---|---|---|---|---|
| 81-100 | 864 | 39 | 0.20 | 16.67 |
| 61-80 | 1606 | 88 | 0.13 | 11.27 |
| 41-60 | 1526 | 138 | 0.08 | 7.55 |
| 21-40 | 1274 | 173 | 0.08 | 7.53 |
| 0- 20 | 739 | 246 | 0.06 | 6.09 |
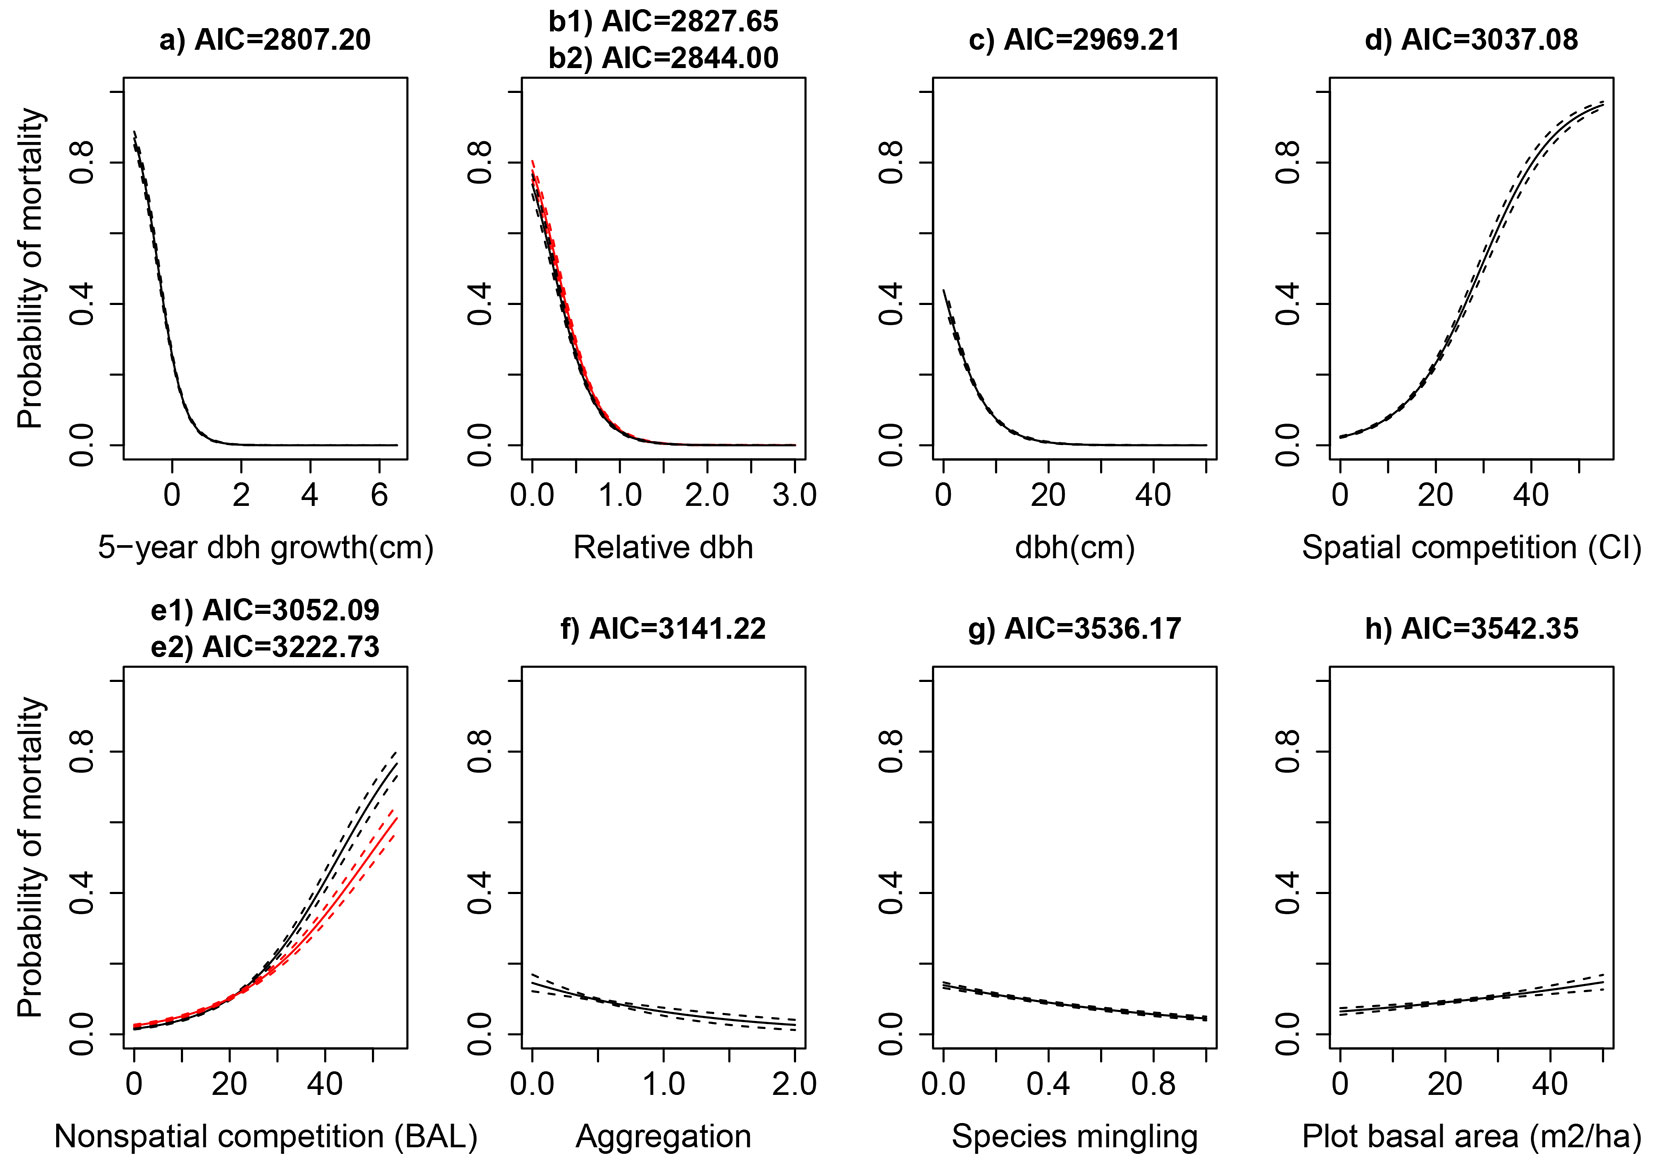
The results from the pairwise analyses indicated that tree growth (id5), tree size (dbh), as well as competition (drel.cz, CI and BALcz), structure (agg and sp), and stand size (G), were the most important predictors of individual tree mortality (Fig. 3). The mortality probability of individual trees was negatively correlated with dbh, id5, sp, and agg, but the correlation was positive for competition and stand size. The other studied variables (see Tab. S1 of Appendix 1) showed non-significant effects in the current mortality study. In an attempt to take the site quality into consideration, the site index at reference age of 50, and the site type as a nominal variable, as alternatives to SI100, were also tested, but they did not provide any improvement to the model performance.
Fig. 3 - Predicted mortality probability of the most important predictors of the tree mortality (solid lines) with 95% confidence (dashed lines) in pairwise relationship between mortality and predictor variables. b1 (black lines) and b2 (red lines) refer to variables drel and drel.cz, while e1 (black lines) and e2 (red lines) refer to the variables BAL and BALcz, respectively.
The highest ranked logistic models with different combinations of variables are presented in Tab. 2 in two categories: some models included only non-spatial mortality predictors, and both spatial and non-spatial variables were fitted into other models. The models consisting of spatial variables far exceeded those with non-spatial measurements in terms of AIC and AICw. The VIF values for all combinations were less than 3.0, indicating a low multicollinearity. Additionally, we tested different transformations of dbh, drel and id5, and found them inferior to the untransformed variables (data not shown).
Tab. 2 - Mortality probability analyses of silver birch using different spatial and non-spatial variables. id5 is the five-year diameter growth of reference trees (cm); dbh is the diameter of reference tree at breast height (cm); drel and drel.cz are the relative dbh of reference trees for each plot and zone of influence, respectively; G is the total basal area of trees within the plot (m2ha-1); BAL and BALcz are the sum of basal area of trees larger than the reference tree within the plot and the influence zone, respectively (m2ha-1); CI is the Hegyi’s competition measure of neighbouring trees inside the zone of influence; agg is the aggregation measure of trees inside the zone of influence and sp is the proportion of other species than silver birch within the influence zone. AIC, ΔAIC, AUC and loglik are the statistical measures of the models. TPR and TNR are the sensitivity and specificity of the models, respectively.
| Variables | AIC | ΔAIC | AUC | TPR | TNR | loglik |
|---|---|---|---|---|---|---|
| Id5, drel, sp, agg | 2583.64 | 0.00 | 0.819 | 0.828 | 0.856 | -1285.8 |
| Id5, drel, sp | 2590.37 | 6.73 | 0.819 | 0.833 | 0.853 | -1290.18 |
| Id5, drel, agg | 2593.54 | 9.90 | 0.820 | 0.812 | 0.866 | -1291.77 |
| Id5, drel.cz, sp | 2593.82 | 10.18 | 0.818 | 0.816 | 0.861 | -1291.91 |
| Id5, drel.cz, sp, agg | 2596.56 | 12.92 | 0.818 | 0.818 | 0.862 | -1294.78 |
| Id5, drel, dbh | 2600.86 | 17.22 | 0.820 | 0.816 | 0.862 | -1295.43 |
| Id5, drel.cz, agg | 2601.25 | 17.61 | 0.817 | 0.809 | 0.864 | -1295.63 |
| Id5, drel | 2603.11 | 19.47 | 0.820 | 0.833 | 0.854 | -1297.55 |
| Id5, drel, G | 2605.08 | 21.44 | 0.820 | 0.831 | 0.854 | -1297.54 |
| Id5, drel.cz, dbh | 2605.17 | 21.53 | 0.818 | 0.831 | 0.851 | -1297.58 |
| Id5, drel.cz, G | 2617.09 | 33.45 | 0.818 | 0.809 | 0.860 | -1303.55 |
| Id5, dbh, CI | 2619.02 | 35.38 | 0.818 | 0.833 | 0.855 | -1304.51 |
| id5, dbh, BAL | 2619.27 | 35.63 | 0.818 | 0.821 | 0.858 | -1304.63 |
| id5, dbh, agg | 2625.64 | 42.00 | 0.818 | 0.833 | 0.852 | -1307.82 |
| id5, dbh, BALcz | 2629.66 | 46.02 | 0.817 | 0.819 | 0.859 | -1309.83 |
| id5, dbh, G | 2633.34 | 49.70 | 0.818 | 0.824 | 0.859 | -1312.67 |
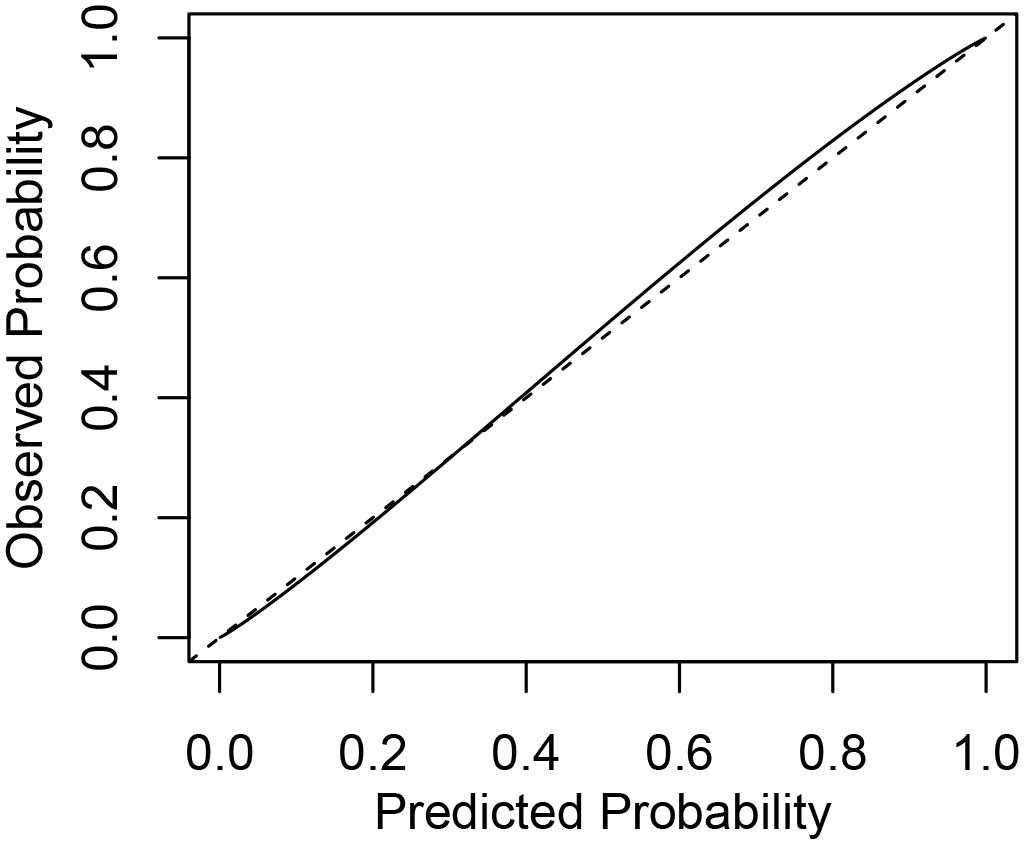
Fig. 4 shows a comparison of the predicted mortality probability of reference trees with their observed mortality probability for the best logistic model. The predictive performance of the best model was good; however, a closer analysis of the estimated mortality probability revealed an evidence of negligible overestimation of the mortality prospects of very small silver birch trees (drel<0.2) with low survival probability, and also a slight underestimation of the mortality probability of the small proportion of large silver birch trees (dbh > 40 cm, see sensitivity and specificity values in Tab. 3). More detailed examinations also revealed that some models had overestimated the likelihood of smaller tree survival. Moreover, a tendency to underestimate the survival likelihood of silver birch trees with small relative diameters in the unthinned plots was detected.
Fig. 4 - The predicted mortality probabilities of the best logistic model against observed mortality. The dashed line represents the ideal probability estimation and the solid line shows how the model fits observed mortality probabilities.
Tab. 3 - The best combinations of variables predicting silver birch mortality when thinning is included as predictor in the model used. (id5): five-year diameter growth of tree (cm); (drel): relative dbh of reference trees for each plot; (Cired): Hegyi’s competition measure of thinned trees inside the zone of influence; (Ithin): thinning intensity of the plot; (agg): aggregation of trees inside the zone of influence; (sp): proportion of other species than silver birch within the influence zone. ΔAIC and AICw are the statistical measures of models. AUC, TPR and FPR are area under curve, true positive rate and false positive rate of dead trees, respectively. Coeffi are coefficients of the models. TPR and TNR are the sensitivity and specificity of the models, respectively.
| Variables | ΔAIC | AICw | AUC | TPR | TNR | Intercept | Coeff1 | Coeff2 | Coeff3 | Coeff4 | Coeff5 |
|---|---|---|---|---|---|---|---|---|---|---|---|
| id5, drel, sp, agg, CIred | 0.00 | 0.655 | 0.819 | 0.833 | 0.856 | 2.324 | -1.977 | -3.263 | -1.1053 | -1.008 | -0.195 |
| id5, drel, sp, agg | 2.49 | 0.189 | 0.819 | 0.828 | 0.856 | 2.327 | -1.985 | -3.232 | -1.103 | -1.054 | - |
| id5, drel, sp, agg, Ithin | 2.86 | 0.157 | 0.819 | 0.811 | 0.863 | 2.303 | -1.981 | -3.262 | -1.098 | -0.993 | -1.273 |
As shown in Tab. 3, the inclusion of the non-spatial variable Ithin in the best model did not seem to improve its performance. However, a significant improvement was observed when the spatial thinning variable Cired was included. Thus, thinning practices in silver birch stands demonstrated that there was a negative influence on the probability of tree mortality (see Coeff5 in Tab. 3) by reducing the competition. Therefore, an excessive decrease in the number of trees due to high thinning intensity, and consequently a reduction in competition, could also decrease the tree mortality rate (from 10.1% in unthinned plots to 6.6% in thinned plots). Additionally, the accuracy estimated by AUC was excellent (AUC>0.8) for all the models in Tab. 3 ([44]). These high values indicated that many of the dead trees (true positives) were correctly classified.
Discussion
Drivers of silver birch mortality
In this study, the silver birch trees with an increasing diameter growth rate clearly indicated an increment in survival. Recent radial growth has been frequently used as an indicator of tree health and vigor ([58], [100]). Accordingly, it is biologically meaningful to assume an improved survival for trees showing higher growth rates, while the opposite is expected for trees showing feeble growth. As a consequence, the probability of any tree to survive can be inferred from its diameter increment ([96]). On the other hand, since radial growth rate varies systematically by tree size after an initial increase, the radial growth rate often decreases as the tree diameter increases, and therefore, diameter growth rate tends to overestimate the mortality probability of bigger trees as compared with smaller trees. It has been proposed that basal area growth rate is a better measure of tree survival than diameter growth rate ([76], [48]). Basal area growth rate represents the tree mass growth more closely, as it increases with tree size ([18], [26]). Similar to Das & Stephenson ([24]), our results did not indicate any better prediction of tree mortality when basal area growth is included in the model (data not shown). On the other hand, we observed a systematic overestimation of the mortality probability of small birch trees.
While the mortality of small birch trees in young and dense stands increased due to self-thinning ([4]), in older stands the high mortality of small trees can be attributed to the suppression by dominating trees- where the non-spatial explanatory variable drel appeared superior to capture this trend. By some means, the hierarchical position of trees within the stand is measured by drel and indirectly indicates their competitive status ([12]). We found that competition is a significant mortality driver, in accordance with the extensive literature corroborating such relationships in the Estonian forests ([59], [84]) and in other forests ([69], [90], [8], [23]). Moreover, the reversed J-shaped (L-shaped) size-dependent mortality pattern of our studied trees (Fig. 3) can be explained by the insufficient number of large trees, and the high mortality rates of young trees within the stands where the competition for resources is high ([20], [74], [25]).
The competition-induced mortality is presumed to decline as local tree density decreases, and the overall plot density showed to be related to the strength of competitive effects ([40], [90]). The variable drel could have served as a simple index of competition, but it did not take the variation of stand density into account. Therefore, equipping the model with spatial measures that represented the neighborhood properties of reference trees did appear unavoidable. Surprisingly, contrary to our assumption, adding the new calculations of BAL (BALcz) and drel (drel.cz) only for immediate neighbors inside the influence zone diminished the predictive power of the model. This can be explained by the expected increasing uniformity in tree spacing with tree age or size, due to mortality from competition ([50], [66], [28]). Therefore, for some small birch trees in old and regular stands, and also for some big birch trees in young and clumped stands, the real values of competition and relative diameter may not be measured by considering the influence zone (here as a ratio of stand height). Finally, the inclusion into the model of the aggregation measure (agg) could take into consideration the horizontal spatial arrangement of tree positions inside the influence zone. The aggregation index has been successfully used to assess the regularity of tree positions ([78], [1], [9]). In our study, agg efficiently proved the negative influence of clumping (agg<1) on the survival prospects of birch trees (see Tab. 3, negative coefficients for agg in the mortality models).
Several studies reported that the competition and growth of silver birch trees, and consequently their survival prospects, are strongly related to the identity of neighboring species ([53], [52], [47]). Their findings are consistent with our results, in that including sp to the best non-spatial mortality model definitely improved its fit. The mortality likelihood of a birch tree was negatively related to the species mixture of its immediate neighbors (decreasing from pure stands to mixed stands - Tab. 2, Tab. 3). According to the Janzen-Connell’s type effect, this may be caused either by the increased risk of attack by species-specific herbivores or diseases, when a silver birch tree grows in close proximity to many other con-specifics ([49], [19]). Also, the inter-specific competition among hetero-specific individuals (mainly Norway spruce and Scots pine) appeared lower than the competition among conspecific individuals (i.e., neighboring silver birch trees). Due to a similar demand for light and resources, the competition among neighboring silver birch individuals increases, and therefore the competition-induced mortality is relatively high. Norway spruce and birch trees have similar site requirements, but when occurring together the formers seem more shade-tolerant than the light-demanding birches, and also show different temporal growth patterns ([88], [47]). Moreover, birch trees easily overwhelm and suppress the shade-intolerant Scots pine trees due to their vigorous early growth ([47]); however, their co-occurrence is relatively infrequent due to different site requirements.
The effect of thinning on silver birch mortality
Thinning to different residual densities produces varying effects on tree mortality, depending on the tree species with different characteristics and site conditions ([42], [14], [92]). Some studies have found a higher mortality risk during the first years after thinning, either due to mechanical damage to the remaining trees ([73], [16]), or by shifting the population towards smaller trees more prone to environmental stresses, or even to windfall for larger residual trees on the margin of cutting areas ([51], [32]). In contrast, some studies have reported that thinning operations may rescue trees from density-dependent mortality ([79]). In our case, the mortality of silver birch trees was affected negatively by thinning operations within the plots (up to 3.5% decline in mortality rate of birch trees in thinned stands). The slight improvement of performance of the mortality model obtained by including CIred indicated that the competition imposed by neighboring trees, which were cut during the thinning operation, partially limited the survival of birch trees. As explained before, density-dependent mortality or self-thinning ([27]) occurs when the stand sparsity is smaller than the limiting sparsity. Thinning operations have successfully increased the stand sparsity, and released the shade-intolerant birch trees that showed a vigorous growth within a less competitive environment.
Data limitation
The areas included in the Estonian Network of Forest Research Plots (ENFRP) were mostly located in managed forests, i.e., only a few old dense stands were measured in this study. The record of the age of individual trees was not available and the age was only determined for tree cohorts. Since regular mortality of a tree could be dependent on its age ([67]), including the exact age of trees may have improved the model’s strength. However, determining the age of individual trees in practical forest management is too laborious. Another factor of uncertainty is the inclusion of small plots when applying spatial variables. As mentioned above, a buffer zone inside the plot (near the plot boundary) was applied to avoid the biased estimations due to edge effects. Consequently, a relatively large number of trees were excluded from mortality analyses, and this loss was more relevant for small plots. However, for the simulation of the neighborhood, a border method ([82]) was used as a means to eliminate this effect, as described by Lilleleht et al. ([61]). This method is simple to implement in comparison with other methods, and guarantees the removal of all edge effects ([57]).
Additionally, one might expect that building the mortality model to include soil descriptors and climate variables will also improve its performances. In this study, mortality was assessed over periods of five years as the exact year of tree death was unknown. Thus, it was difficult to connect extreme events, such as very cold temperatures or hot summers, which can usually cause high tree mortality. Regarding the costly assessment of annual tree mortality and soil analysis around individual trees for large data sets, a dendrochronological analysis seems to be a more effective method for climate studies ([62]). Further studies are needed to investigate the efficiency of the mentioned variables and other possible mortality predictors in defining the live/death status of individuals.
Conclusions
Natural mortality of individual trees is a stochastic and irregular phenomenon for which we attempted to find the most relevant explanatory variables. Although a number of known and unknown factors affecting tree mortality makes its modeling complicated, the fitted models used in this study did produce results that satisfactorily explained mortality of Estonian silver birch trees. Five-year diameter growth, relative diameter, species proportion, and aggregation were the most appropriate explanatory variables in our mortality models. In order to maintain high survival probabilities, forest management plans and practices should pay a special attention to growth performances of trees, species compositions, tree density and forest stand structure. Furthermore, the reduction of stand density would provide more growing space for light-demanding birch trees, as demonstrated by the reduced mortality predicted by our model when thinning was included as predictor. However, root and stem damage caused by heavy machinery used for thinning operations, and the higher wind exposure of trees after thinning should also be considered. Finally, based on our results, silver birch trees should preferably be managed in mixed stands where they occur along with other tree species, and attempts should be made to minimize the clumping (agg>1) within their neighborhoods.
Acknowledgements
Measurement of the Estonian Network of Forest Research Plots has been supported by Estonian Environmental Investment Center. This study was also supported by the Estonian Research Council (ETF8890, IUT21-04).
References
Gscholar
Gscholar
Gscholar
Gscholar
Gscholar
Gscholar
Gscholar
Gscholar
Gscholar
Gscholar
Gscholar
Gscholar
Gscholar
Gscholar
Gscholar
Gscholar
Gscholar
Gscholar
Gscholar
Gscholar
Gscholar
Gscholar
Gscholar
Gscholar
Gscholar
Gscholar
Gscholar
Gscholar
Gscholar
Gscholar
Gscholar
Supplementary Material
Authors’ Info
Authors’ Affiliation
Andres Kiviste
Estonian University of Life Sciences, Institute of Forestry and Rural Engineering, Department of Forest Management, Kreutzwaldi 5-1B18, Tartu 51014 (Estonia)
Corresponding author
Paper Info
Citation
Maleki K, Kiviste A (2016). Individual tree mortality of silver birch (Betula pendula Roth) in Estonia. iForest 9: 643-651. - doi: 10.3832/ifor1672-008
Academic Editor
Rupert Seidl
Paper history
Received: Apr 10, 2015
Accepted: Dec 03, 2015
First online: Apr 04, 2016
Publication Date: Aug 09, 2016
Publication Time: 4.10 months
Copyright Information
© SISEF - The Italian Society of Silviculture and Forest Ecology 2016
Open Access
This article is distributed under the terms of the Creative Commons Attribution-Non Commercial 4.0 International (https://creativecommons.org/licenses/by-nc/4.0/), which permits unrestricted use, distribution, and reproduction in any medium, provided you give appropriate credit to the original author(s) and the source, provide a link to the Creative Commons license, and indicate if changes were made.

Web Metrics
Breakdown by View Type
Article Usage
Total Article Views: 54677
(from publication date up to now)
Breakdown by View Type
HTML Page Views: 45096
Abstract Page Views: 3674
PDF Downloads: 4478
Citation/Reference Downloads: 42
XML Downloads: 1387
Web Metrics
Days since publication: 3750
Overall contacts: 54677
Avg. contacts per week: 102.06
Article Citations
Article citations are based on data periodically collected from the Clarivate Web of Science web site
(last update: Mar 2025)
Total number of cites (since 2016): 5
Average cites per year: 0.50
Publication Metrics
by Dimensions ©
Articles citing this article
List of the papers citing this article based on CrossRef Cited-by.
Related Contents
iForest Similar Articles
Research Articles
Effects of artificial defoliation and simulated insect damage on the growth of Betula pendula saplings
vol. 9, pp. 95-100 (online: 15 July 2015)
Research Articles
Response of artificially defoliated Betula pendula seedlings to additional soil nutrient supply
vol. 10, pp. 281-287 (online: 13 December 2016)
Research Articles
Is there an effect of storage depth on the persistence of silver birch (Betula pendula Roth) and rowan (Sorbus aucuparia L.) seeds? A seed burial experiment
vol. 14, pp. 224-230 (online: 06 May 2021)
Research Articles
Equations for estimating belowground biomass of Silver Birch, Oak and Scots Pine in Germany
vol. 12, pp. 166-172 (online: 15 March 2019)
Research Articles
Applying complex network metrics to individual-tree diameter growth modeling
vol. 18, pp. 176-185 (online: 01 July 2025)
Research Articles
Conservation of Betula oycoviensis, an endangered rare taxon, using vegetative propagation methods
vol. 13, pp. 107-113 (online: 23 March 2020)
Research Articles
Local ecological niche modelling to provide suitability maps for 27 forest tree species in edge conditions
vol. 13, pp. 230-237 (online: 19 June 2020)
Research Articles
Distribution factors of the epiphytic lichen Lobaria pulmonaria (L.) Hoffm. at local and regional spatial scales in the Caucasus: combining species distribution modelling and ecological niche theory
vol. 17, pp. 120-131 (online: 30 April 2024)
Research Articles
Modelling diameter distribution of Tetraclinis articulata in Tunisia using normal and Weibull distributions with parameters depending on stand variables
vol. 9, pp. 702-709 (online: 17 May 2016)
Research Articles
Environmental niche and distribution of six deciduous tree species in the Spanish Atlantic region
vol. 8, pp. 214-221 (online: 28 August 2014)
iForest Database Search
Search By Author
Search By Keyword
Google Scholar Search
Citing Articles
Search By Author
Search By Keywords
PubMed Search
Search By Author
Search By Keyword


