Environmental niche and distribution of six deciduous tree species in the Spanish Atlantic region
iForest - Biogeosciences and Forestry, Volume 8, Issue 2, Pages 214-221 (2015)
doi: https://doi.org/10.3832/ifor1183-008
Published: Aug 28, 2014 - Copyright © 2015 SISEF
Research Articles
Abstract
Understanding the influence of environmental factors on the distribution of tree species is essential for developing management actions at regional level. We computed species distribution models for six European tree species to determine their potential niche in the Spanish Atlantic region, where deciduous forests are relatively well preserved. We used data from the national Forest Inventory and topo-climatic and soil variables to construct distribution models by the Generalized Linear Model procedure. The main factors found to determine the presence of the selected species were minimum winter temperature and mineral fertility of soils. Suitable habitats for Quercus petraea and F. sylvatica were mainly high-altitude areas with low minimum temperatures. In contrast, Q. robur and C. sativa were restricted to low altitudes and warmer conditions. Betula pubescens was not influenced by the elevation, probably because it is adapted to Atlantic conditions, and distribution of this species was associated with low fertility soils. Although the submediterranean Q. pyrenaica was positively influenced by the slope, model performance was poor for this species, possibly because of the truncated environmental range of the species in the study area. The findings suggest that temperature rather than moisture is shaping the distribution of deciduous trees at the southern limit of the Atlantic biogeographic region. We also note that the strong elevational difference between the warm coast and the cold mountains may determine the geographical disjunction between Q. robur and Q. petraea in southern Europe.
Keywords
Species Distribution Models, Topo-climatic Variables, Quercus species, Castanea sativa, Iberian Peninsula, Deciduous Forests
Introduction
The temperate mid-latitude ecozone of the northern hemisphere is mainly distributed in the Atlantic regions of North America and Europe and also in central Europe ([46]). The climax vegetation of this ecozone consists of temperate deciduous forests, which dominate from sea level to the subalpine zone. These ecosystems comprise some of the main components of European landscapes ([32]) and provide the society with important flow of services ([31], [25]). The main ecosystem services provided by forests are regulation processes, such as soil protection, climate, etc., although provision of cultural services is also important.
The distribution of tree species in Europe is mainly determined by climatic factors ([48], [49]), despite the effect of historical factors such as the presence of glacial refuges ([36], [55]) and naturalization of species beyond their former range. The dominant forest tree species in the temperate mid-latitude ecozone are taxonomically related, most belonging to the Fagaceae family. These species require a minimum of 120 days per year with an average temperature above 10 °C, and most of them grow in areas where winter is shorter than 4 months ([54]) and frost damage is a secondary factor. Although it has been suggested that minimum temperature is one of the main determinants for the growth and development of native trees ([51]), other climatic variables and soil factors are also expected to shape the distribution of tree species ([2]).
Several attempts have been made to characterize the ecological niche and spatial distribution of forest tree species in Europe ([51], [7], [8]). However, biogeographical regions differ in terms of historical and climatic factors. A better understanding of species-environment relationships requires data sources spanning over large areas with high spatial resolution (e.g., National Forest Inventories - NFI), to be used for the development of climatic models, with the aim of analyzing particular areas and assessing the influence of environmental conditions. Computing species distribution models (SDMs - [24], [18]) applied on such data may be especially useful for defining the environmental niche of tree species and for assessing their potential distribution at regional scales.
In this study, we applied SDMs on species occurrence data from the Spanish NFI to compare the climatic niche of six European tree species in the Atlantic region, at the southern distribution limit of temperate deciduous forests in Europe. The studied region is characterized by an oceanic and relatively warm climate and representing a unique environmental zone in Europe (the Lusitanian zone, according to [33]). The study area was the Autonomous Community of Asturias, one of the most densely forested areas of the Iberian peninsula, where deciduous forests are relatively well preserved. Asturias is characterized by an elevational gradient ranging from the sea level to altitudes often higher than 2000 m a.s.l., by far the strongest altitudinal gradient found across the entire European Atlantic region. According to local vegetation surveys, the distribution of tree species is determined by strong climatic gradients and soil conditions ([13]), although it is unknown whether local environmental gradients affect the ecological niche of forest trees. Thus, Asturias provides a good study system for investigating the environmental niche of European tree species in oceanic temperate climates with high topographic heterogeneity.
Understanding the ecological determinants that affect the distribution of forest tree species in this region is important for planning appropriate management actions aimed at preventing the potential impacts of climate change in southern Europe ([4]). It is worth noting that native forests from this area are rarely monospecific, including one or more dominant species, and mixtures of different tree structures as well. Niche overlapping is therefore possible for these species, and the analysis of such overlap could help improve our understanding of forest distribution.
The main aims of this study were: (i) to investigate how environmental factors determine the distribution of main tree species in deciduous forests; and (ii) to delineate the potential distribution ranges of these species at high-resolution scale. In addition, we discuss whether the factors driving the forest tree species’ occurrence in the Spanish Atlantic Region are similar to those previously reported for other European regions.
Material and Methods
Study area
The Autonomous Community of Asturias is part of the European Atlantic Region ([17]) at the border with the Mediterranean Region (Fig. 1), and covers about 10 600 km2 of which approximately 40% are forests. The area is one of the most densely forested regions in Spain ([34]).
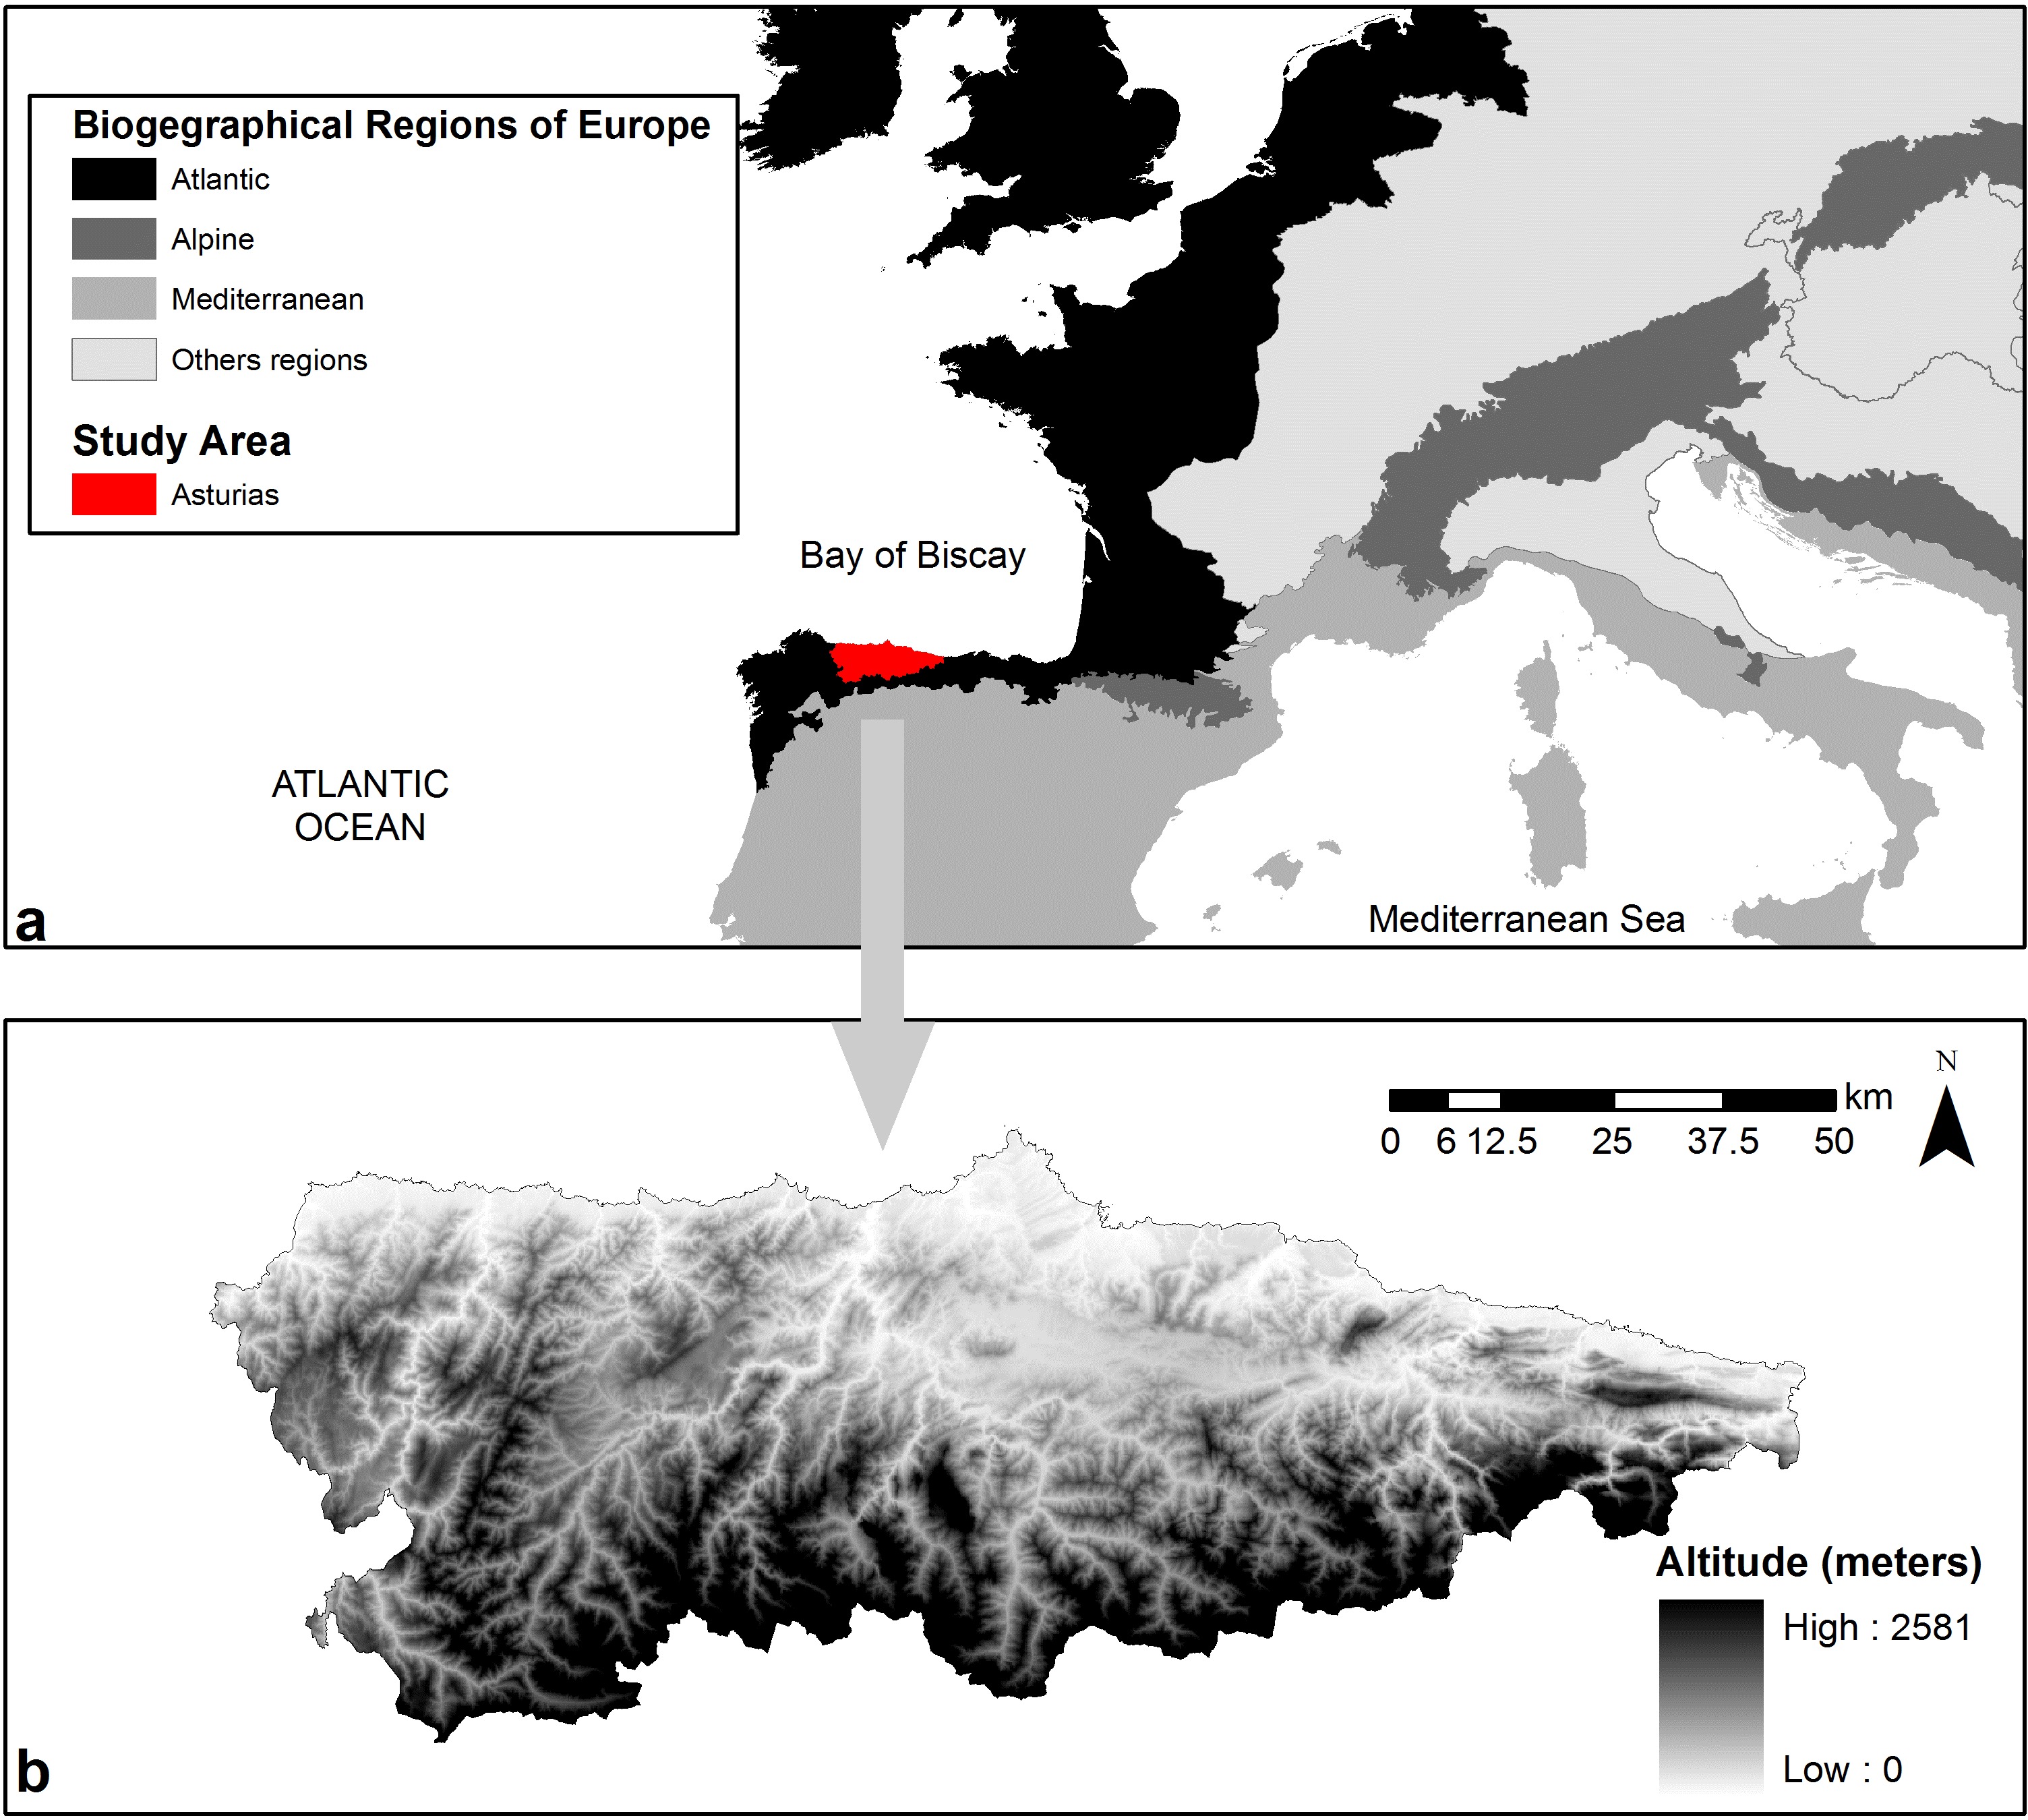
The climate is oceanic, with mean precipitation exceeding 800 mm year-1 and reaching more than 2000 mm year-1 at highest elevations. Precipitation decreases in summer in some areas, but physiological drought does not occur in any part of the study area. Forest wildfires in this region are less intense and affect smaller areas than in the Mediterranenan region ([1]).
Human impacts on woodlands in Asturias began two thousand years ago ([35]), but during the last century human activity has deeply transformed most accessible areas at low and medium altitudes (< 1000 m a.s.l.). Nowadays, timber production using fast growing species such as Eucalyptus spp. and Pinus spp. are widespread at low altitudes, while remnants of natural forests are scattered amongst meadows and heathlands used for livestock. In montane areas, forests are more abundant though fragmented ([22]). Timber line is represented by deciduous forests and rarely exceeds 1700 m a.s.l. ([12]).
In this study, six main native tree species occurring in the study area were chosen (Tab. 1): Quercus robur L., Q. petraea (Matt.) Liebl., Q. pyrenaica Willd., Fagus sylvatica L., Castanea sativa Mill., and Betula pubescens Ehrh (sometimes referred to as B. pubescens subsp. celtiberica or B. celtiberica). These species may be found as dominant trees (except C. sativa) in mixed forests, along with other minor species such as Fraxinus excelsior L., Salix spp., Ilex aquifolium L. and Acer pseudoplatanus L.
Tab. 1 - Mean values (and standard deviation) of the parameters used to describe the structure of forest stands analyzed in this study. Data from plots with more than 50 stems ha-1 and coverage by the dominant species > 60% (source: [34]).
| Dominant species |
Tree density (stems ha-1) |
Basal area (m2 ha-1) |
Quadratic mean diameter (cm) |
Dominant height (m) |
||||
|---|---|---|---|---|---|---|---|---|
| mean | SD | mean | SD | mean | SD | mean | SD | |
| Q. robur | 449.52 | 396.8 | 15.33 | 10.05 | 23.39 | 10.41 | 12.17 | 4.18 |
| Q. petraea | 342.04 | 243.5 | 18.92 | 12.7 | 28.27 | 13.88 | 12.89 | 4.46 |
| Q. pyrenaica | 543.26 | 600.15 | 14.25 | 12.54 | 19.3 | 8.39 | 10.96 | 4.73 |
| F. sylvatica | 526.43 | 420 | 26.13 | 10.64 | 29.77 | 12.48 | 17.18 | 4.21 |
| C. sativa | 785.1 | 668.61 | 24.73 | 17.91 | 23.61 | 14.07 | 13.99 | 3.64 |
| B. pubescens | 645.7 | 560.32 | 15.02 | 10.1 | 17.80 | 6.86 | 12.19 | 4.72 |
Data
Information on species cover was drawn from the Spanish National Forest Inventory (NFI - [34]), based on a regular grid of 1×1 km covering the whole forested territory. For each grid node, data on the presence and cover of tree species in circular plots (radius 25 m) were available. Presence/absence of the six target species for 1877 plots falling within the study area were then imported in a GIS database (ArcGIS 9.3, ESRI, Redlands, CA, USA). The minimum distance of 1 km between plots was chosen to prevent the inclusion of spatially autocorrelated data.
Climatic and topographic data were compiled from the Climatic Digital Atlas of the Iberian Peninsula ([38]), available in grid format with a cell size of 200 m. Climatic data consisted of the following variables (Tab. 2): (i) annual precipitation (PREC); (ii) annual mean temperature (T); (iii) mean temperature of the coldest month (TMIN); (iv) index of continentality (IC), i.e., the difference between the mean temperatures of hottest and coldest months ([53]); and (v) potential evapotranspiration for July (ETP), representing the maximal evaporation in a given area without water limitation in the driest month ([52]). Three topography-related variables were also considered: (vi) altitude (ALT); (vii) slope (SLOPE); and (viii) solar radiation (RAD); and one variable related to soil pH: (viii) fertility (FERTI), determined for the study area by combining geological and lithological digital maps to reflect the amount of carbonates and soil depth ([20]).
Tab. 2 - Description of the variables considered as possible predictors of the geographic distribution of the six target species. (a): Semiquantitative classification from 1 (lowest) to 4 (highest).
| Variable | Description | Unit | Source | Cell size (m) |
|---|---|---|---|---|
| ALT | Altitude based on a Digital Elevation Model | m | [27] | 10 |
| SLOPE | Slope based on a Digital Elevation Model | % | [27] | 10 |
| RAD | Accumulated radiation during one year | kJ m-2 year-1 | [38] | 200 |
| PREC | Accumulated precipitation during one year | mm | [38] | 200 |
| TEMP | Mean annual temperature | °C | [38] | 200 |
| TMIN | Mean temperature of daily minimum during January | °C | [38] | 200 |
| IC | Difference between monthly temperatures of hottest month and coldest month | °C | [38] | 200 |
| PET | Maximum evaporation occurring on ground totally covered by vegetation and without water limitations during the driest month | mm | [38] | 200 |
| FERTI | Soil fertility based on lithological factors | 1 to 4 (a) | [20] | 200 |
Pairwise Pearson’s correlation coefficients (r) were calculated between variables to assess their collinearity, excluding those with r>0.6. FERTI, SLOPE, RAD and PREC were not significantly related to any other variable. ALT and TEMP were closely correlated with several of the other factors and therefore discarded from further analysis. TMIN, IC and ETP were correlated with each other. As TMIN is a meaningful factor related to the winter temperatures and frost probability, it was preserved as a more informative predictor, and the other two factors then discarded.
Distribution models
In order to model the spatial distribution of each of the six target species analyzed, Generalized Linear Models (GLMs) were constructed using a binomial distribution with a logistic link function in SPSS 17.0 for Windows ([47]). The dependent variable was binary and reflects the presence (1) or absence (0) of each species in each plot. The dataset of each species was implemented in ArcGIS 9.3 to built an equal proportion of presences and absences (50%). Using a random selection procedure, we selected 80% of the grid points for model calibration and the remaining 20% for the next validation step. The sample size was 1816 for Q. robur, 508 for Q. petraea, 630 for Q. pyrenaica, 832 for F. sylvatica, 1690 for C. sativa, and 1588 for B. pubescens.
Independent variables in GLMs were selected using the Wald’s backward stepwise procedure. The performance of each model was assessed by a confusion or error matrix that crosstabulates the observed and predicted presence/absence patterns ([21]). Model validation was performed using the Area Under the ROC Curve (AUC - [21]). AUC values can range from 0.5 (performance equal to random) to 1.0 (perfect fit). For assessing distribution models, AUC values in the range 0.5-0.7 were considered low, 0.7-0.9 were moderate and >0.9 were high, suggesting poor, good and very good model performances, respectively ([50]). For each of the six models considered, Moran’s I statistic was also computed to evaluate the spatial autocorrelation of residuals after accounting for the effect of the environmental variables, using the Spatial Analyst tool in ArcGIS ([18]).
The coefficients from the GLMs obtained were used to predict the probability of occurrence of the target species in the whole study area at a grid size of 200×200 m. Predicted values ranging from 0 to 1 were interpreted in terms of habitat suitability, i.e., the probability of finding suitable environmental conditions for each species according to the set of variables included in the models. Finally, Pearson’s correlation coefficients between predicted and observed data were calculated for each species using a random selection of 1000 grid points over the study area.
Results
The results from the GLM analysis revealed differences among those environmental variables that determine the occurrence of the analyzed species (Tab. 3). The model for Q. robur, which included all the variables considered, revealed that the presence of this species was positively related to TMIN, RAD and PREC, and negatively related to FERTI and SLOPE. The AUC value for this model (0.760) indicates a good performance. The Q. petraea model provided a similar accuracy (AUC = 0.753), although in this case the only variable included was TMIN and its effect was negative. Although the Q. pyrenaica model was the least accurate (AUC = 0.569), it revealed that the presence of this species was positively related to SLOPE and PREC. The F. sylvatica model was the most accurate (AUC = 0.861), showing that the presence of this species was positively related to FERTI and negatively related to TMIN and RAD. For C. sativa, model performance was similar to that obtained for Q. robur and Q. petraea (0.758), revealing that the species presence was positively related to TMIN. Finally, for B. pubescens model performed rather poorly (AUC = 0.627), showing that the presence of this species was negatively correlated with FERTI and SLOPE.
Tab. 3 - Results of the GLM modeling for each of the six target species. (B): coefficients of the model; (Wald): statistics used in the variable selection process; (AUC): accuracy parameter used for validation.
| Model | Variable | B | Range | Mean | Wald | AUC |
|---|---|---|---|---|---|---|
| Quercus robur | TMIN | 0.039 | 4-13.2 | 9.6 | 98.232 | 0.76 |
| FERTI | -0.182 | 1-4 | 2.64 | 13.568 | ||
| SLOPE | -0.021 | 0.5-40.6 | 15.2 | 6.505 | ||
| RADI | 0.001 | 1134-2369 | 1920 | 16.403 | ||
| PREC | 0 | 714-2034 | 1273 | 2.91 | ||
| constant | -6.101 | - | - | 38.029 | ||
| Quercus petraea | TMIN | -0.035 | 4.6-13.2 | 9.2 | 34.088 | 0.753 |
| constant | 3.243 | - | - | 33.314 | ||
| Quercus pyrenaica | SLOPE | 0.042 | 0.4-37.9 | 15.8 | 11.755 | 0.569 |
| PREC | 0 | 755-1767 | 1258 | 5.524 | ||
| constant | 0.746 | - | - | 1.647 | ||
| Fagus sylvatica | TMIN | -0.084 | 4.0-13.1 | 9.1 | 133.138 | 0.861 |
| FERTI | 0.707 | 1-4 | 2.93 | 52.607 | ||
| RADI | -0.003 | 1145-2369 | 1874 | 37.96 | ||
| constant | 11.783 | - | - | 98.443 | ||
| Castanea sativa | TMIN | 0.07 | 4.0-13.2 | 9.6 | 262.284 | 0.758 |
| PREC | 0 | 636-2034 | 1276 | 7.49 | ||
| constant | -5.474 | - | - | 69.797 | ||
| Betula pubescens | FERTI | -0.424 | 1-4 | 2.61 | 68.993 | 0.627 |
| SLOPE | -0.037 | 0.1-39.8 | 15 | 20.94 | ||
| RADI | 0 | 1134-2360 | 1919 | 5.689 | ||
| PREC | 0 | 636-2034 | 1272 | 8.7 | ||
| constant | 4.345 | - | - | 77.087 |
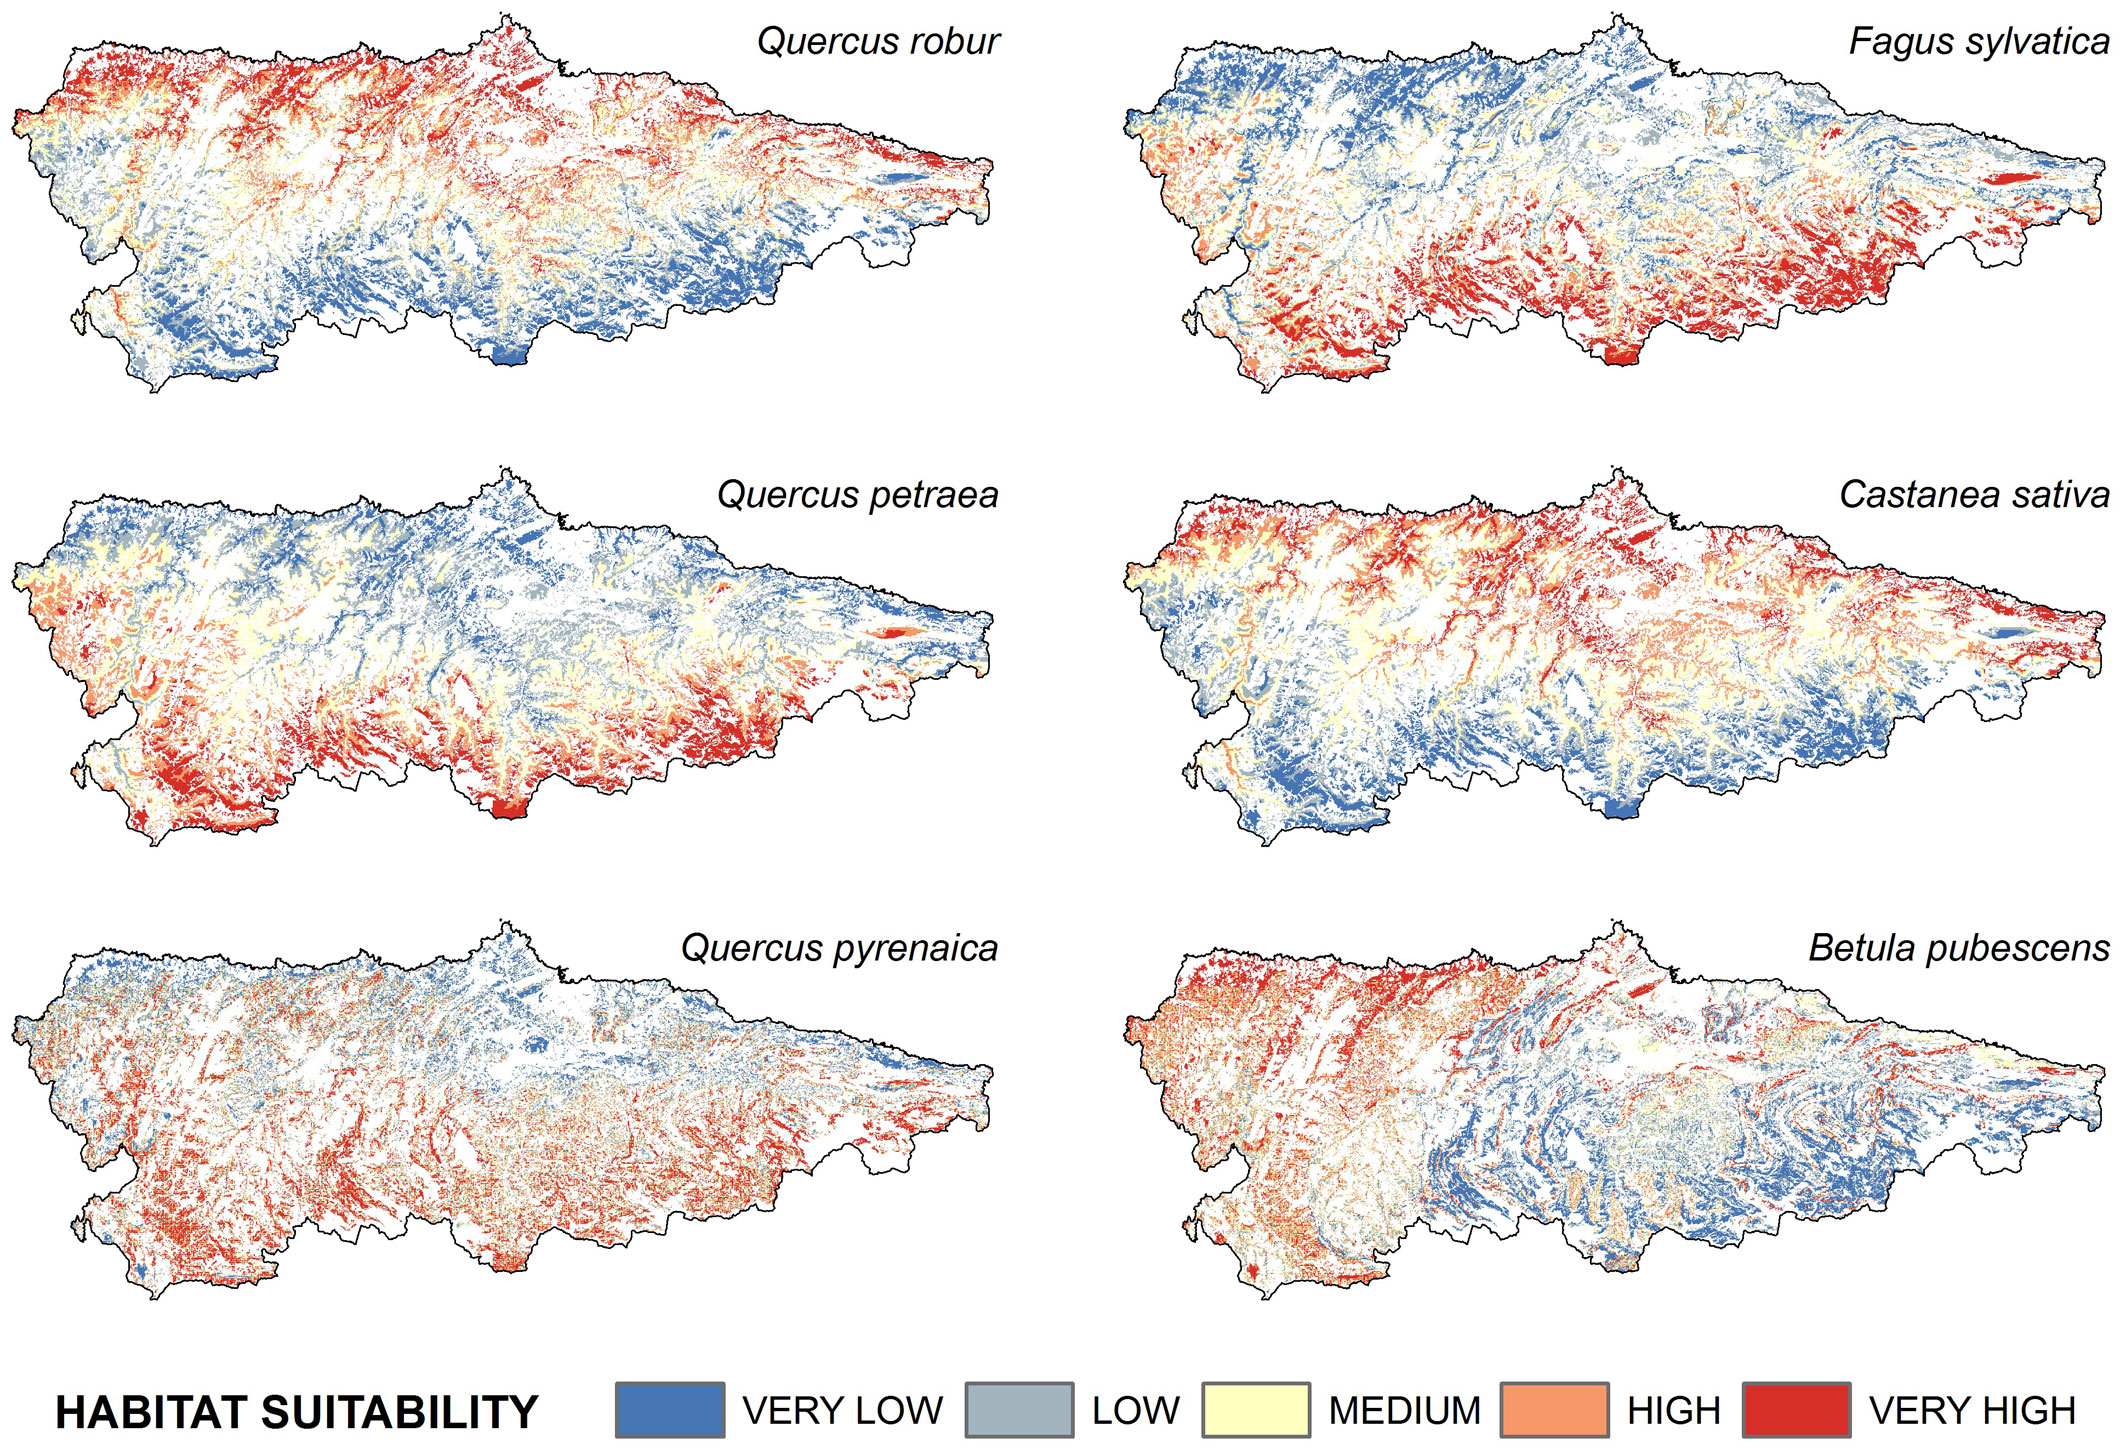
The predicted spatial pattern of habitat suitability clearly differed among species, although some similarities were observed (Fig. 2 and Tab. 4). Habitat suitability of C. sativa and B. pubescens was “high” to “very high” over more than 50% of the area, with a wide range of variation, while for the other species the range was narrower (10 to 28%). Calculations of Moran’s I detected positive values of spatial autocorrelation of residuals for Quercus petraea (I = 0.543, P = 0.00) and Betula pubescens (I = 0.51, P = 0.03) models, and a stronger clustering for Castanea sativa (I = 0.81, P = 0.00). The remaining species were randomly distributed.
Fig. 2 - Results of the modeling of habitat suitability for the six species analyzed. Non-forest areas were excluded from the analysis (displayed in white in the maps).
Tab. 4 - Probability thresholds for the five habitat suitability classes.
| Model | Suitability classes | ||||
|---|---|---|---|---|---|
| Very Low | Low | Medium | High | Very High | |
| Q. robur | <0.10 | 0.10-0.19 | 0.19-0.29 | 0.29-0.41 | 0.41-0.79 |
| Q. petraea | <0.31 | 0.31-0.39 | 0.39-0.51 | 0.51-0.65 | 0.65-0.96 |
| Q. pyrenaica | <0.75 | 0.75-0.79 | 0.79-0.83 | 0.83-0.87 | 0.87-0.98 |
| F. sylvatica | <0.13 | 0.13-0.26 | 0.26-0.51 | 0.51-0.83 | 0.83-0.99 |
| C. sativa | <0.46 | 0.46-0.74 | 0.74-0.88 | 0.88-0.93 | 0.93-0.99 |
| B. pubescens | <0.88 | 0.88-0.92 | 0.92-0.94 | 0.94-0.96 | 0.96-0.99 |
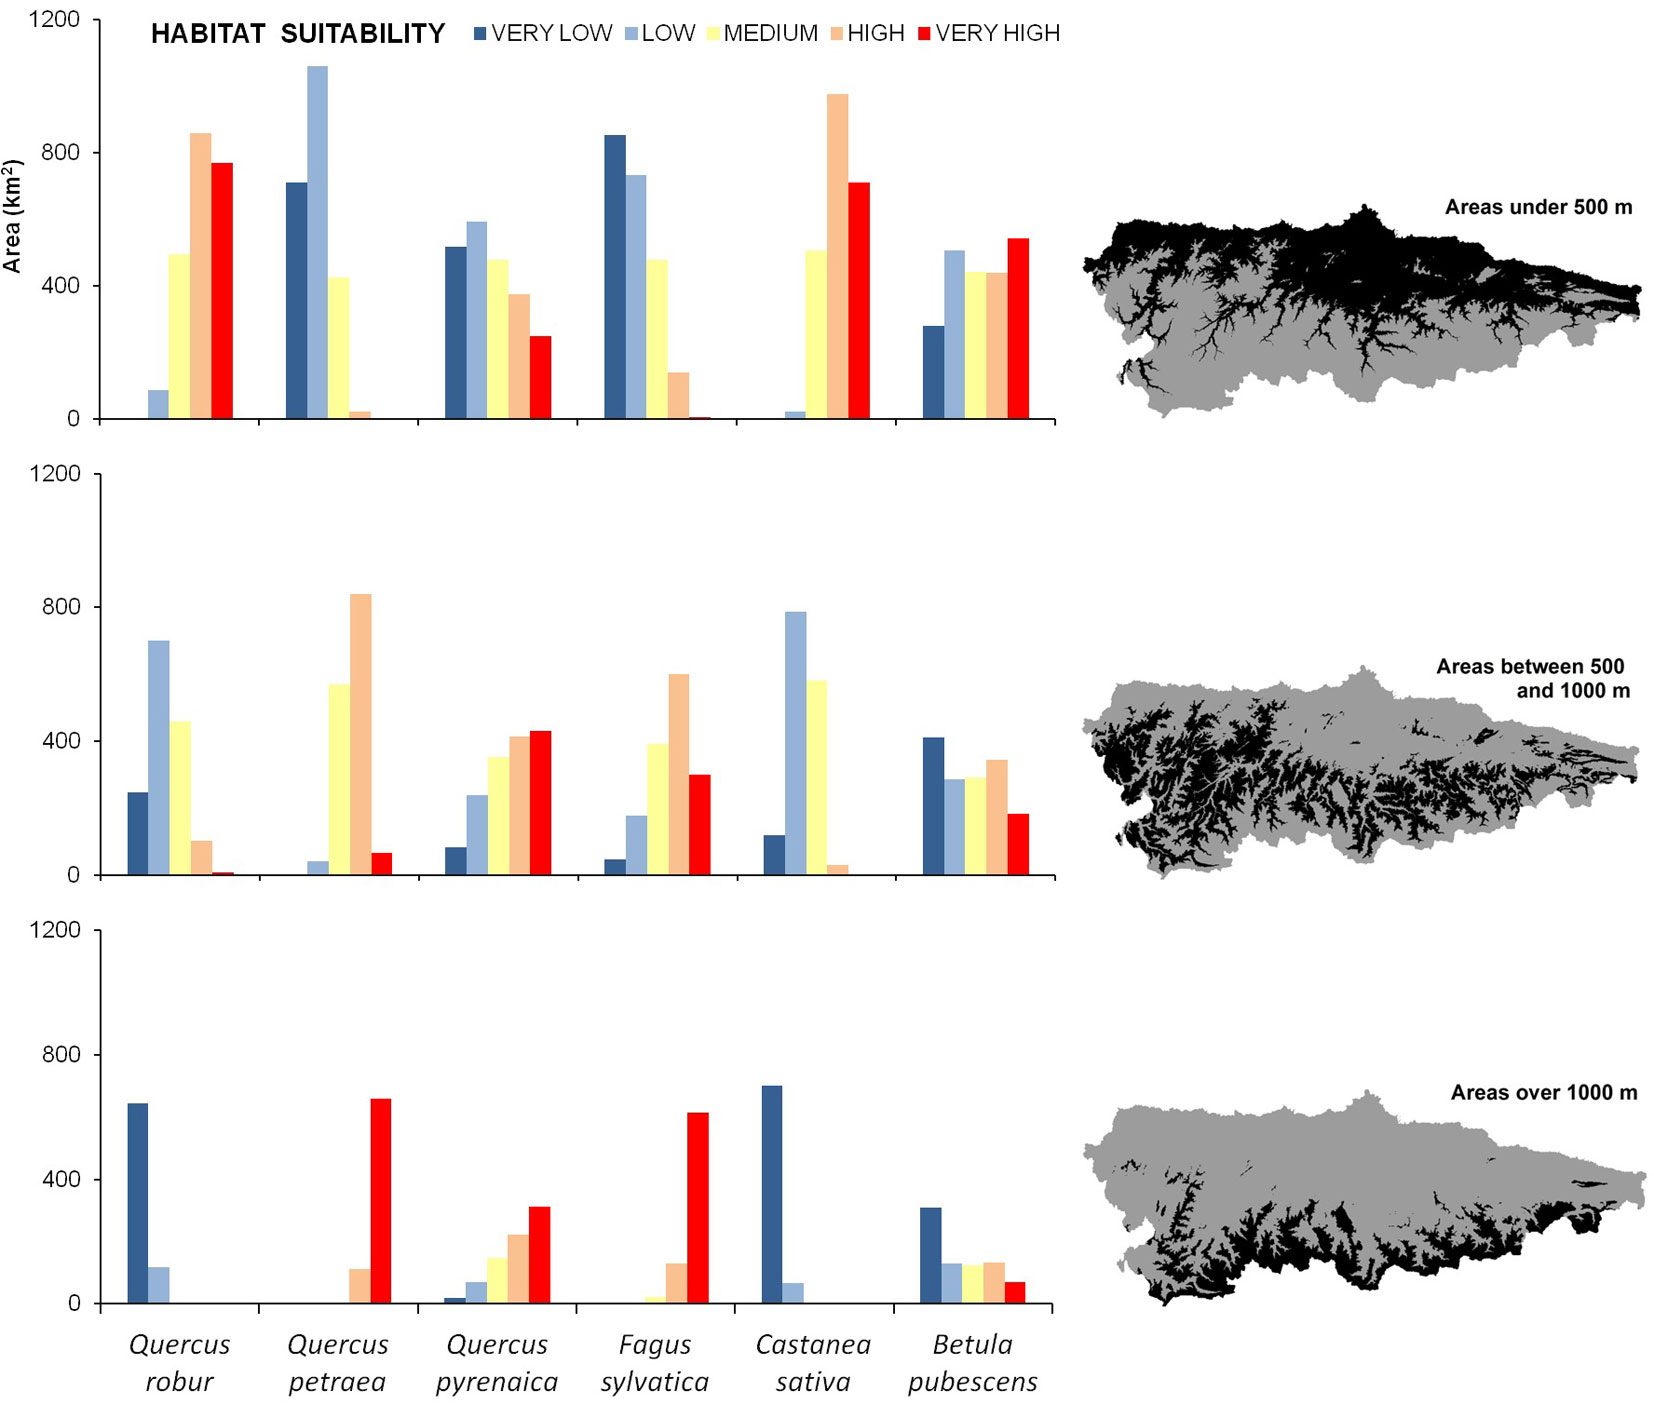
Highest suitability values for Q. robur and C. sativa were observed in the northern half of the study area, mainly at low altitudes (Fig. 3). Analogously, the least suitable areas for both species were the elevated mountain slopes at the southern limit of the study area (Fig. 3). By contrast, the highest suitability values for F. sylvatica and Q. petraea ranged from intermediate altitudes to approximately 1300 m a.s.l. The suitability values for Q. pyrenaica were quite similar to those obtained for F. sylvatica and Q. petraea, as they showed a certain preference for intermediate altitudes (Fig. 3). However, suitable areas for Q. pyrenaica were less continuous than for other species.
Fig. 3 - Area (km2) of the five habitat suitability classes for each species based on three different altitudinal ranges: <500 m; 500-1000 m; >1000m.
The correlations between habitat suitability for the different species analyzed clearly revealed two main groups of species: those associated with low altitudes (Q. robur and C. sativa) and those preferring mountainous areas (F. sylvativa and Q. petraea - Tab. 5). Correlation coefficients between suitability of Q. pyrenaica and B. pubescens and suitability for any of the other species were always < 0.5, suggesting the presence of different ecological niches across the study area.
Tab. 5 - Results of the Pearson’s correlation analysis between habitat suitability for the different species analyzed. (**): p< 0.01.
| Pearson r | Q. petraea | Q. pyrenaica | F. sylvatica | C. sativa | B. pubescens |
|---|---|---|---|---|---|
| Q. robur | -0.839 ** | -0.44 ** | -0.876 ** | 0.81 ** | 0.35 ** |
| Q. petraea | - | 0.404 ** | 0.87 ** | -0.938 ** | 0.057 ** |
| Q. pyrenaica | - | - | 0.38 ** | -0.283 ** | 0.14 ** |
| F. sylvatica | - | - | - | -0.834 ** | -0.11 ** |
| C. sativa | - | - | - | - | 0.102 ** |
Discussion
The findings of this study reveal the main environmental factors driving the distribution of six European tree species in Asturias, a region characterized by a temperate oceanic climate and a unique elevational gradient in the context of the Atlantic biogeographic region in Europe. The study area represents the southern margin of the distribution for Fagus sylvatica, Quercus petraea, Quercus robur and Betula pubescens, which are common in the Atlantic region but not in the Mediterranean region.
We found that the minimum temperature (TMIN) had a strong influence on species distribution. Such factor has been considered critical in shaping the geographical distributions of plants ([2]). Indeed, minimum temperature can be used as a surrogate for winter conditions, reflecting the ability of some species to resist frost damage. Given the Atlantic influence in the study area, it is not surprising that precipitation (PREC) had scant influence on the distribution of the analyzed species, unlike other studies carried out in the Mediterranean region, where this is critical factor affecting the transitions between forest types (e.g., Quercus ilex and Quercus faginea forests - [39]). Soil fertility (FERTI) was also found to be an important predictor of the spatial distribution of species, according to previous studies that used soil properties as predictors in species distribution models ([23]).
Model performances were generally satisfactory, except for Quercus pyreanica and, to a lesser extent, Betula pubescens. As we discuss below, the poor model performance of Q. pyrenaica can be explained by the scarce representation of the species in the study area, which generates a truncated niche. In contrast, the poor model performance for B. pubescens may be explained by the common occurrence of such species in the whole study area, regardless the changes in the factors analyzed along the enviromental gradients considered. We also detected spatial autocorrelation of model residuals for few species, in particular for Castanea sativa. However, spatial effects in species distribution models has been shown not to influence results in large datasets ([42]). In our study, spatial autocorrelation in the C. sativa dataset suggests that the distribution of this species is closely related to factors not included in the current analysis. Considering that our sampling was based on well-separated spatial units (1 km), this effect is possibly related to human activities favoring the development of chestnut in particular areas.
Fagus sylvatica and Quercus petraea showed a strong preference for montane areas. These species are widely distributed and predominant in cool regions of central Europe ([51]), where they often share environmental niches. Recent distribution models based on different climatic scenarios have predicted in the next few decades an enlargement of their range in northern Europe ([29]), as a consequence of the expected increase in minimum winter temperatures. Our results confirm that winter temperature affects the distribution of both species in the Spanish Atlantic region, and therefore similar shifts to higher altitudes (rather than higher latitudes) are expected in the future.
The geographic distribution of F. sylvatica has traditionally been related to a relatively long vegetative period, high moisture and high degree of continentality ([19]), variables that are negatively related to TMIN. Sánchez et al. ([45]) reported an optimal distribution for this species (in an area close to the present study area) on northern slopes above 600 m a.s.l. with mean annual temperature ranging between 6.1 and 10.5 °C. The optimal conditions described for beech by these authors imply annual rainfall higher than 950 mm with no drought and an upper altitudinal limit of approximately 1500 m a.s.l., i.e., similar to the maximum altitude of forests in the Spanish Atlantic region ([12]). At northern latitudes, the species shows a preference for temperate areas where extremely low winter temperatures are rarely occurring. However, it is also one of the few tree species that resists the most severe winter conditions in northern Spain. The distribution of F. sylvatica was also positively correlated with soil fertility, suggesting that the species prefers basic substrates. As F. sylvatica is known to grow in basic and acid soils in the study area, this distribution probably reflects the location of remnant beech forests in rich (calcareous) substrates.
Muñoz-Sobrino et al. ([37]) identified an increase in the niche of F. sylvatica from the late Medium Holocene in the northwest of the Iberian Peninsula, which they attributed to the progressive warming in the area and the increased elevation of the tree line in the Cantabrian mountains. Our results are consistent with these previous findings, as F. sylvatica shows a clear preference for montane sites. Under such conditions (mountain climate at mid latitudes), F. sylvatica is highly competitive and is one of the main forest species in the Atlantic Region. The distribution of Q. petraea was established about 7000 years ago, as a result of the long-range recolonization after the last glaciation, according to fossil pollen data ([26]). Similar to other deciduous oaks, during the Last Glacial Maximum this species was limited to small refugia in the Mediterranean region ([5]), from where its spread northbound began. It is possible that similar shifts towards cool areas affected the distribution of this species in northern Spain, thus explaining its current distribution range at high elevations.
The geographic distribution of Quercus robur and Castanea sativa is mainly correlated with low-altitude areas and high minimum temperatures. Although Q. robur extends to high latitudes (up to 60° N - [41]), it is often limited by short vegetative periods and cold damage ([28]). Our findings are consistent with those of Attorre et al. ([3]) who reported that the presence of Q. robur was correlated with the warm temperatures occurring in temperate areas of Italy, which suggests a preference of the species for relatively low altitudes. In our study, this results in a geographical disjunction between Q. petraea (restricted to cold sites) and Q. robur (dominating warm areas at low and medium altitude). Such disjunction is fairly uncommon in other European regions, where both species have similar distribution ranges, and their environmental niches are differentiated by soil moisture ([16]). We also found that Q. robur was negatively correlated with fertility and positively correlated with the presence of acid soils.
Castanea sativa is less common in oceanic regions than Q. robur, mainly occurring in permanent forests of the Mediterranean region. The distribution of chestnut has been closely associated with human activity over the last 2000 years, as it has been intensively planted and harvested in the Iberian peninsula since Roman times, and its fruit was an important food in Medieval Ages as well ([10]). Interestingly, the distribution of C. sativa has been related to low altitudes with annual rainfall between 700 and 1100 mm in both Mediterranean ([43]) and Atlantic regions ([6]). Our findings suggest that this species formed refugia in warm areas of temperate regions, which are probably more similar to the wettest areas of the Mediterranean regions. Indeed, the study area is considered a refuge for this species during several glacial events ([30]) and pollen evidence demonstrates its presence prior to human impacts. In addition, we also detected spatial aggregation of such species, suggesting that its spread may have been locally favored to some extent by human intervention.
Although B. pubescens was positively correlated with the presence of acid soils, we did not find any clear geographical pattern in relation to the distribution of this species. These findings confirm the acidophilous nature of B. pubescens in the Atlantic region, unlike other biogeographical regions where birch can grow in different conditions along a soil mineralization gradient ([16]). Betula species have been studied from different perspectives in botanical studies ([40], [11]), but no studies have focused on the ecological niche of these species in the Iberian peninsula. The relatively poor performance of the distribution models indicates that there are no clear climatic constraints to the local distribution of this species, which occurs on acid soils at any altitude in the study area. Betula pubescens is widely distributed in the Atlantic Region ([51]), and its historical importance in northern Spain is often emphasized as it played a role as a colonizer after the Last Glacial Maximum ([36]).
Finally, the model performed very poorly for Q. pyrenaica in the study area. In biogeographical terms, this species occupies intermediate zones between Atlantic forests of Q. robur and Mediterranean xerophytic forest dominated by Quercus ilex L. ([9]), and this species may not be sufficiently well represented in the study area for a good characterization of its niche. Such specific conditions - commonly referred as submediterranean climate - are not frequent in the study area, where Q. pyrenaica shows a scattered distribution on acid and dry soils in both mountain and coastal areas. This species also occupies a wide altitudinal range in Galicia (which is also part of the Spanish Atlantic region) in between 300 and 1300 m a.s.l., and in areas with low precipitation (750 mm year-1 - [15], [14]). According to these authors, Q. pyrenaica requires lower summer precipitation (115 mm from June to August) than Q. robur (165 mm) and it is located in colder areas further from the sea. This is consistent with the location of the optimal area for this species in the Mediterranean region of the Iberian peninsula ([44]).
Conclusions
This study analyzed the strong altitudinal gradient of the Spanish Atlantic region and identified the minimum annual temperature as the main factor affecting the geographic distribution of tree species. Soil fertility was also an important predictor, as suggested by the good performance of distribution models for other forest species ([23]).
Although landscapes in the Iberian peninsula have been greatly modified by human activities, the study area still comprises important portions of the remnant Atlantic deciduous forests ([22]). Forest ecosystems are well represented, and the sampling carried out was larger enough to ensure the environmental niche assessed to be sufficiently representative of the species requirements. Nonetheless, we also recognize that in some cases historical reasons may underlie the current species distribution, especially at low altitudes (e.g., Quercus robur) and for those species most influenced by human activities (e.g., Castanea sativa), therefore puzzling the interpretation of the model outputs. In particular, the distribution of C. sativa appears to be spatially clustered, possibly due to the effect of past human influence ([10]). On the other hand, we found meaningful explanations for the observed distributional patterns of the other species, in most cases fully consistent with their autoecological requirements. In addition, we also detected divergent niches for Q. petraea and Q. robur that have not previously been reported in Europe. Suitability of oceanic and humid-cool conditions was also confirmed for Betula pubescens and Fagus sylvatica, respectively. Overall, the information provided contributes to a better understanding of the distribution of deciduous forests in the European Atlantic biogeographical region.
Acknowledgements
JVRD is in receipt of a “Severo Ochoa” PhD Grant provided by FICYT-Government of Principado de Asturias (BP 12-093). BJA is grateful for financial support from the European Social Fund and the Government of the Czech Republic (Postdoc II, CZ.1.07/2. 3.00/30.0037). Funding of this work was provided by the project UNOV-13-EMERG-13 (Universidad de Oviedo). We are grateful to an anonymous reviewer for her/his constructive comments on an earlier version of the manuscript.
References
Gscholar
Gscholar
Gscholar
Gscholar
Gscholar
Gscholar
Gscholar
Gscholar
CrossRef | Gscholar
Gscholar
Gscholar
Gscholar
Gscholar
Gscholar
Gscholar
Gscholar
Gscholar
Gscholar
Gscholar
Authors’ Info
Authors’ Affiliation
Pedro Álvarez-Álvarez
GIS-Forest Group, Department of Organisms and Systems Biology, University of Oviedo, E-33993 Mieres (Spain)
Department of Botany and Zoology, Masaryk University, CZ-61137 Brno (Czech Republic)
INDUROT, Department of Organisms and Systems Biology, University of Oviedo , E-33993 Mieres (Spain)
Corresponding author
Paper Info
Citation
Roces-Díaz JV, Jiménez-Alfaro B, Álvarez-Álvarez P, Álvarez-García MA (2015). Environmental niche and distribution of six deciduous tree species in the Spanish Atlantic region. iForest 8: 214-221. - doi: 10.3832/ifor1183-008
Academic Editor
Emanuele Lingua
Paper history
Received: Nov 18, 2013
Accepted: May 31, 2014
First online: Aug 28, 2014
Publication Date: Apr 01, 2015
Publication Time: 2.97 months
Copyright Information
© SISEF - The Italian Society of Silviculture and Forest Ecology 2015
Open Access
This article is distributed under the terms of the Creative Commons Attribution-Non Commercial 4.0 International (https://creativecommons.org/licenses/by-nc/4.0/), which permits unrestricted use, distribution, and reproduction in any medium, provided you give appropriate credit to the original author(s) and the source, provide a link to the Creative Commons license, and indicate if changes were made.

Web Metrics
Breakdown by View Type
Article Usage
Total Article Views: 56969
(from publication date up to now)
Breakdown by View Type
HTML Page Views: 46488
Abstract Page Views: 4286
PDF Downloads: 4644
Citation/Reference Downloads: 26
XML Downloads: 1525
Web Metrics
Days since publication: 4260
Overall contacts: 56969
Avg. contacts per week: 93.61
Article Citations
Article citations are based on data periodically collected from the Clarivate Web of Science web site
(last update: Mar 2025)
Total number of cites (since 2015): 12
Average cites per year: 1.09
Publication Metrics
by Dimensions ©
Articles citing this article
List of the papers citing this article based on CrossRef Cited-by.
Related Contents
iForest Similar Articles
Research Articles
Growth, spring phenology and stem quality of four broadleaved species assessed in provenance trials in the Netherlands - Implications for seed sourcing
vol. 18, pp. 242-251 (online: 22 September 2025)
Research Articles
Suitability of Fagus orientalis Lipsky at marginal Fagus sylvatica L. forest sites in Southern Germany
vol. 15, pp. 417-423 (online: 19 October 2022)
Review Papers
Ulmus laevis in the Iberian Peninsula: a review of its ecology and conservation
vol. 8, pp. 135-142 (online: 07 August 2014)
Research Articles
Effects of drought and nutrient deficiency on grafts originating from sound and shaken sweet chestnut trees (Castanea sativa Mill.)
vol. 9, pp. 109-114 (online: 19 July 2015)
Research Articles
Shrub facilitation of Quercus ilex and Quercus pubescens regeneration in a wooded pasture in central Sardinia (Italy)
vol. 3, pp. 16-22 (online: 22 January 2010)
Research Articles
Distribution factors of the epiphytic lichen Lobaria pulmonaria (L.) Hoffm. at local and regional spatial scales in the Caucasus: combining species distribution modelling and ecological niche theory
vol. 17, pp. 120-131 (online: 30 April 2024)
Research Articles
Does management improve the state of chestnut (Castanea sativa L.) on Belasitsa Mountain, southwest Bulgaria?
vol. 8, pp. 860-865 (online: 27 April 2015)
Research Articles
Individual tree mortality of silver birch (Betula pendula Roth) in Estonia
vol. 9, pp. 643-651 (online: 04 April 2016)
Research Articles
Evaluation of estimation methods for fitting the three-parameter Weibull distribution to European beech forests
vol. 15, pp. 484-490 (online: 01 December 2022)
Research Articles
The missing part of the past, current, and future distribution model of Quercus ilex L.: the eastern edge
vol. 17, pp. 90-99 (online: 22 March 2024)
iForest Database Search
Google Scholar Search
Citing Articles
Search By Author
Search By Keywords


