Outcome of Ceratocystis platani inoculations in Platanus × acerifolia in relation to season and inoculum dose
iForest - Biogeosciences and Forestry, Volume 9, Issue 4, Pages 608-617 (2016)
doi: https://doi.org/10.3832/ifor1594-008
Published: Mar 17, 2016 - Copyright © 2016 SISEF
Research Articles
Abstract
Ceratocystis platani is the causal agent of canker stain, the most destructive disease of Platanus spp. The selection of resistant tree genotypes should be an effective method of controlling the disease. Although breeding programs for resistance have been developed, there is no validated protocol for an in depth evaluation of the resistance phenotype. Testing the variables to identify the conditions that fully challenge the genetic potential of the host is crucial not to overestimate labile resistant phenotypes. Here we report results of testing different inoculum doses and inoculation times - early and late spring, summer and autumn - on the response of susceptible plane genotypes. Late spring inoculation gave rise to the quickest death pattern occurred, followed by early spring inoculation. Nevertheless Ceratocystis platani was aggressive also in the hottest period of the summer. The capacity of C. platani to initiate canker stain in the hottest period of the year underlines its capacity to be virulent in a wide range of temperatures. Although autumnal inoculation enabled fungus entry, its progression was precociously halted as effective and stable resistance reactions were opposed by the majority of the trees. An in vitro study of mycelial growth and conidial germination confirmed the capacity of the fungus to be active or to keep the viability in a wide range of temperatures such as in the three seasons that were taken into consideration. Thus we hypothesize that the failure of symptom expression after autumnal inoculation might be due to a combination of a temperature-linked reduction in pathogen virulence, and a season-linked resistant reaction of the host. Overall our data suggest that, in the context of legal sanitary measures, only the coldest and driest periods of the year should be considered for pruning and the removal of infected trees. The different inoculum doses did not condition the death pattern. Comparing germination in suspensions at 1.000 and 10.000 conidia per µl, self-inhibition germination occurred, as the germination rate was inversely correlated with the conidia concentration. This is a first step in the definition of a resistance-testing protocol for an in depth evaluation of resistance to canker stain.
Keywords
Inoculum Dose, Inoculation Time, Resistance Reaction, Self-inhibition Conidia Germination, Thermal Niche, Resistance Testing Protocol
Introduction
Ceratocystis platani (J. M. Walter) Engelbr. & T. C. Harr. is a quarantine fungal pathogen species, agent of canker stain, which is the most destructive disease of Platanus spp. In north America, where the fungus is considered to be native, severe disease outbreaks have been repeatedly reported on ornamental and natural stands of P. × acerifolia (Ait.) Willd. and P. occidentalis L. ([32], [11]). Since its introduction into southern Europe, C. platani has destroyed many plantations, both urban plantings of P. × acerifolia and natural stands of P. orientalis ([18], [14], [28]). Due to its aggressiveness, C. platani has been included in the EPPO A2 list of quarantine organisms ([15], [16], [17]).
In Italy, ministerial decrees established mandatory monitoring, prophylaxis and eradication measures, in order to safeguard the plantations, many of which are an integral part of historical sites ([12]). These measures, for example setting up sites for the removal of infected trees according to sanitary rules, proved to be highly expensive. Recently, media attention has focused on the destruction by canker stain of tree stands lining the Canal du Midi, a world heritage site in France. The death of thousands trees is very costly due to tree removal and replanting, and involves the complete loss of a historical landscape ([5]). In general, the application of control measures has not halted the unavoidable spread of the disease and has raised concerns for the biodiversity of Platanus in Europe ([14]).
Breeding for resistance to C. platani should be an effective method to control the disease. Currently, only one patented resistant variety is commercially available (a French clone selected by INRA - [31]). However, large-scale diffusion of a unique clone would be detrimental for at least two reasons: (i) it exerts selection pressure on the pathogen population with the risk of selecting new pathogen races able to overcome host resistance; (ii) host species biodiversity would likely significantly decrease over time, with an extinction risk particularly for P. × acerifolia which mainly exists as ornamental stands.
For several years we have been developing a selection program for canker stain resistance. Thousands of seedlings were screened for their capacity to survive to C. platani inoculation ([21], Pilotti, unpublished data). Promising genotypes were then propagated in order to have a high number of ramets, which were planted in containers and in the open field. The genotypes are now awaiting an in depth evaluation of their resistance phenotype.
This in depth evaluation is expected to proceed along two main ways: (i) artificial infection; and (ii) the exposure of trees to natural infections by being planted within infection foci. In the latter testing, the evaluation time is difficult to predict as it is not known when the pathogen comes into contact with fresh wounds in the roots or the stem, and is thus potentially able to infect the tree. Evaluation based on the artificial infection is an appropriate method for resistance testing in plant pathology, especially if it mimics the range of conditions occurring in nature. However, the selection of tree genotypes that are resistant to artificial inoculation which then turn out to be susceptible to natural infections is a real risk and should be avoided. A validated protocol for an in depth evaluation of the resistance to C. platani has not yet been clearly outlined. Important variables are the method of inoculation, the age at which the tree is inoculated, the inoculum dose, and the season when inoculation is performed.
Regarding the inoculation technique, the tooth pick method, which requires a minimum wound, has been successful in that it enabled survivors to be selected in experiments in which thousands of trees were killed ([31], [21]). In general, other inoculation methods might be more severe as they require bark and wood to be heavily cut or removed ([25]), although these methods have not yet been tested in resistance selection of Platanus. In natural conditions, C. platani can take advantage of large wounds, and it is thus conceivable that a large-wound-based method could also be used to test resistance of promising genotypes. As C. platani infection is highly aggressive, testing the different inoculation methods on susceptible trees is not discriminating and a “resistant” genotype should be used. Similarly, testing different ages of inoculation should require a “resistant” genotype (Pilotti, unpublished data).
With regard to the inoculum dose, few as twenty conidia in water are able to infect and kill susceptible plane trees, through a syringe-injection-based inoculation or a wound made with a blade on thin stems ([30], [9]). However, no information is available with regard to the effect of different inoculum doses under the following conditions: (i) inoculation in different seasons (which to date has not been investigated, and nor has it been investigated independently of the effect due to the inoculum dose); (ii) use of the pick method (i.e., the method used to date for resistance selection in Platanus); (iii) inoculating stems larger than those reported by Vigouroux ([30]) and Luchi et al. ([9]), i.e., those that are large enough to show potential resistance ([31], [21]).
In this paper we report the results of the evaluation of different inoculum doses and inoculation times on the response of plane tree to C. platani. Specifically, our aim was to understand which doses and times are the most appropriate to promote the full onset of disease symptoms, and thus to highlight how the host response may vary in relation to these parameters. In addition, to find a match with the outcome of artificial infections, we studied the thermal niche of C. platani by analysing in detail mycelial growth, conidia germination and their viability in relation to temperature.
Materials and methods
Plant materials, growing conditions, inoculation trials and Ceratocystis platani detection
Canker stain-susceptible genotypes of P. × acerifolia (coded A, B, C, D and E) were micro-propagated (A and B) and cutting propagated (C, D, E) as previously described ([20], [7]) in order to produce the required number of ramets (see Tab. 1 for the experimental design). After rooting, micropropagated plantlets were acclimated and transplanted into 2-liter pots and cuttings were transplanted into 23-liter pots. The substrate was Zeoliter® (Agricola2000, Italy), containing blonde and black pit, fermented bark-derived humus, humic and fulvic acids and natural zeolites, with a water pH 6.0. All the potted trees were located in the nursery under field conditions. At the age of two, trees were permanently transplanted into 65-liter pots at 1.0 × 0.5 m spacing (nursery trials) or were planted in the field at a spacing of 2 × 3.5 m (field trials). All plants were watered daily, from April to mid-October, with the greatest amount of water supplied in the summer.
Tab. 1 - Time to death of Platanus × acerifolia trees and survivors after Ceratocystis platani inoculation in different times and with different inoculum doses. The number of dead ramets in each date interval is reported. Standard error (SE) refers to the median. (n/a): not available.
| Trials | Clones | Inoculum dose (conidia) |
Inoculation date |
Ramets | Apr 09 Jul 09 |
Aug 09 Nov 09 |
Dec 09 Mar 10 |
Apr 10 Jul 10 |
Aug 10 Nov 10 |
Dec 10 Mar 11 |
Apr 11 Jul 11 |
Aug 11 Nov 11 |
Dec 11 Mar 12 |
Aug 12 | Survivors | Median (Mean) |
SE |
|---|---|---|---|---|---|---|---|---|---|---|---|---|---|---|---|---|---|
| Potted trees grown in the nursery |
A | 1000 | Apr 2 | 20 | 1 | 14 | 4 | 1 | - | - | - | - | - | - | 0 | 165 (206) | 4.4 |
| May 25 | 10 | - | 8 | 1 | 1 | - | - | - | - | - | - | 0 | 125 (173) | 8.9 | |||
| Jul 23 | 10 | - | - | - | 1 | 7 | 2 | - | - | - | - | 0 | 430 (435) | 8.2 | |||
| Oct 30 | 10 | - | - | - | - | - | 1 | - | - | 1 | - | 8 | n/a | - | |||
| 5000 | Apr 2 | 20 | - | 11 | 4 | 1 | 2 | 1 | - | - | 1 | - | 0 | 216 (312) | 11.2 | ||
| May 25 | 10 | - | 8 | 1 | 1 | - | - | - | - | - | - | 0 | 123 (167) | 9.7 | |||
| Jul 23 | 10 | - | - | - | 2 | 5 | 2 | 1 | - | - | - | 0 | 421 (471) | 13.1 | |||
| Oct 30 | 10 | - | - | - | - | - | - | 1 | - | 1 | 1 | 7 | n/a | - | |||
| Field planting | A | 500 | Apr 3 | 17 | - | 16 | 1 | - | - | - | - | - | - | - | 0 | 164 (172) | 3.0 |
| 2500 | Apr 3 | 17 | - | 16 | - | 1 | - | - | - | - | - | - | 0 | 139 (156) | 1.5 | ||
| B | 500 | Apr 3 | 10 | - | 10 | - | - | - | - | - | - | - | - | 0 | 163 (175) | 2.3 | |
| 2500 | Apr 3 | 10 | - | 9 | - | 1 | - | - | - | - | - | - | 0 | 180 (200) | 7.2 | ||
| C | 500 | Apr 3 | 2 | - | 2 | - | - | - | - | - | - | - | - | 0 | - | - | |
| 2500 | Apr 3 | 2 | - | 2 | - | - | - | - | - | - | - | - | 0 | - | - | ||
| D | 500 | Apr 3 | 2 | - | 2 | - | - | - | - | - | - | - | - | 0 | - | - | |
| 2500 | Apr 3 | 2 | - | 2 | - | - | - | - | - | - | - | - | 0 | - | - | ||
| E | 500 | Apr 3 | 2 | - | 2 | - | - | - | - | - | - | - | - | 0 | - | - | |
| 2500 | Apr 3 | 2 | - | 2 | - | - | - | - | - | - | - | - | 0 | - | - |
Inoculations were performed on 5-year old plants using an isolate of C. platani coded NM and obtained in Rome (Italy). Cylindrical and barrel-shaped endoconidia were used as the inoculum (for details on the preparation of the inoculum see the Appendix 1 in Supplementary Material - [20]). The concentration of the conidial suspension was determined with a Burker hemocytometer chamber, and was adjusted to obtain a total of 1000 and 5000 conidia (inoculation trials in the nursery) and 500 and 2500 conidia (inoculation trials in the field) in a volume of 3 μl, which represented the inoculum dose/aliquot. This aliquot was then deposited on the end of dehydrated sterile toothpicks, where it was subsequently adsorbed. The trees were inoculated by inserting the toothpick 3 mm through the bark into the stem at a height of about 15-25 cm, where the diameter of the stem was 40-45 mm.
Potted trees in the nursery were inoculated in four different periods. Field trees were inoculated at the beginning of April. All inoculation trials started in 2009 (Tab. 1). All trees were monitored for symptom expression until death or throughout the observation period (April 2009 - August 2012). Death dates were recorded.
Lesions at the inoculation point were ranked according to a previously described rating scale ([21]). In those trees that were still surviving at the end of the observation period, internal lesions were evaluated by sectioning the trunks longitudinally in proximity to the inoculation point in order to visually explore the inside of the wood. The discoloured wood was used to detect C. platani by isolation assay and EvaGreen-based Real-Time PCR. These methods are detailed in the Appendix 2 of Supplementary Material), ([22], [23], [17]).
Daily temperature datasets were obtained from the web repository meteo.it (⇒ http://www.ilmeteo.it/portale/archivio-meteo).
Survival analyses: Kaplan-Meyer estimate, log-rank test and Cox’s proportional hazard model
We recorded death dates of inoculated trees and calculated the survival time (i.e., time starting from the inoculation to the occurrence of death) expressed in days. Treatment group data were then used to perform survival analyses according to Kaplan-Meyer estimate ([8], [2], [6]). Central to survival analysis are the survival function S(t) and the hazard function h(t). S(t) is the cumulative probability that an individual will survive until a given point in time throughout a number of periods (i.e., periods in which other trees die) from the moment that the tree in question becomes party of the study. h(t) estimates the instantaneous risk of dying at a particular instant given that the individual has survived until that time. The estimator of S(t) is (eqn. 1):
where ni is the number of survivors just before the time ti, and di the number of death events at ti. We thus inferred stepped survival curves for each treatment group (estimating and graphing cumulative survival probabilities as a function of time).
We compared the survival pattern of each group data by the log-rank test and the Cox proportional hazard test, in order to evaluate statistically significant differences. The log rank test was calculated as follows (eqn. 2):
where the O1 and O2 are the total numbers of observed events in groups 1 and 2, respectively, and E1 and E2 the total numbers of expected events ([10], [19], [2], [6]). Cox’s model describes and predicts the effects of covariates (independent variables) on the survival time. The response dependent variable is the cumulative hazard. The cumulative hazard function is related to the cumulative survival function as follows ([4], [2], [6] - eqn. 3):
Right-censored trees were those still surviving at the end of the observation period. Analyses were conducted using the R programme version 3.0.2 ([24]). We used the package for survival analysis by Therneau ([26]), based on Therneau & Grambsch ([27]).
In vitro evaluation of fungal growth and conidia germination
To measure the growth rate of the C. platani isolate used for the inoculation trials, we inoculated 90 mm-PDA plates with fungal plugs collected from the edge of an actively growing colony (9 mm in diameter). The plates were incubated at temperatures in the range of 5-40 °C (5 °C of interval up to 35 °C, and 2.5 °C up to 40 °C) in the dark for 7 days (five replications for each temperature). For each colony, two diameters, at right angles to each other, were measured and the mean was used for statistical analysis. A one-way analysis of variance (ANOVA) was performed, using the Student-Newman-Keuls multiple range test to assess growth differences between temperatures.
In the case of no growth at high temperatures, viability of the fungal plugs was verified by incubating at 25 °C.
Time-course experiments were also performed in order to evaluate viability/death of the mycelium at 40 and 42.5 °C. Plates were inoculated with five fungal plugs each, incubated at 25 °C in the dark for 18 hrs and soon after at the extreme temperatures for periods ranging from 4 to 72 hrs. Three plates were used to test each incubation time (15 replication-plugs). Viability was checked as described above. In general, the time-course was based on two diurnal four-hour intervals followed by a night sixteen-hour interval. Each experiment was repeated twice.
Conidia germination of isolate NM was studied as a function of temperature (5 to 40 °C, in 5 °C intervals in the range of 5-35 °C, and in 2.5 °C intervals in the range of 35 to 40 °C) and inoculum concentration (1000 and 10 000 conidia µl-1). Conidial suspensions were prepared as described in the Appendix 1 of the Supplementary Material ([20]) and quantified with a Burker hemocytometer. The hemocytometers charged with the conidial suspensions (whose germination was analyzed later) were incubated in a moist chamber for 24 hrs in the dark, at a constant temperature. Subsequently, a total of five hundred germinating/non-germinating conidia were counted under a microscope. Conidia germination was expressed as a percentage and derived by subtracting the values obtained before from those obtained after incubation. The experiment was repeated twice, at each temperature and concentration, except for 15 and 20 °C (with 1000 conidia µl-1) for which the experiment was repeated four times and with two additional isolates coded Si and Ve. Statistical significance was assessed according to Student’s t-test.
Time-course experiments were also performed in order to evaluate conidia germination at 25 °C after an incubation at 37.5 and 40 °C. We used a conidia suspension at 1000 conidia µl-1 and tested 3, 6 and 24 hrs at the extreme temperatures, followed by a 24 hrs incubation at 25 °C. We then evaluated the germination rate as described above. As a control, we included in the experiment an incubation test at 25 °C for 24 hrs. Each experiment was repeated three times. Statistical significance was assessed according to Student’s t-test.
Results and discussion
Outcome of the inoculation trials and the survival analysis
Twenty to 30 days after inoculation, a dark-violet necrotic halo appeared in the bark surrounding the inoculation point, in nearly all the trees involved in the experimental treatments. Bark discolouration (i.e., bark necrosis) rapidly spread longitudinally, with a tendency to girdle the stem. In the trees that had died by August/September of the inoculation year, there was generally no callus reaction between necrotic and healthy zones. In the trees that died later, a slight callus reaction in some cases surrounded the necrosis. Death occurred as a quick wilting during the vegetative season (from April to August). A decline - leaf yellowing and fall - preceded the death occurring in late summer/autumn.
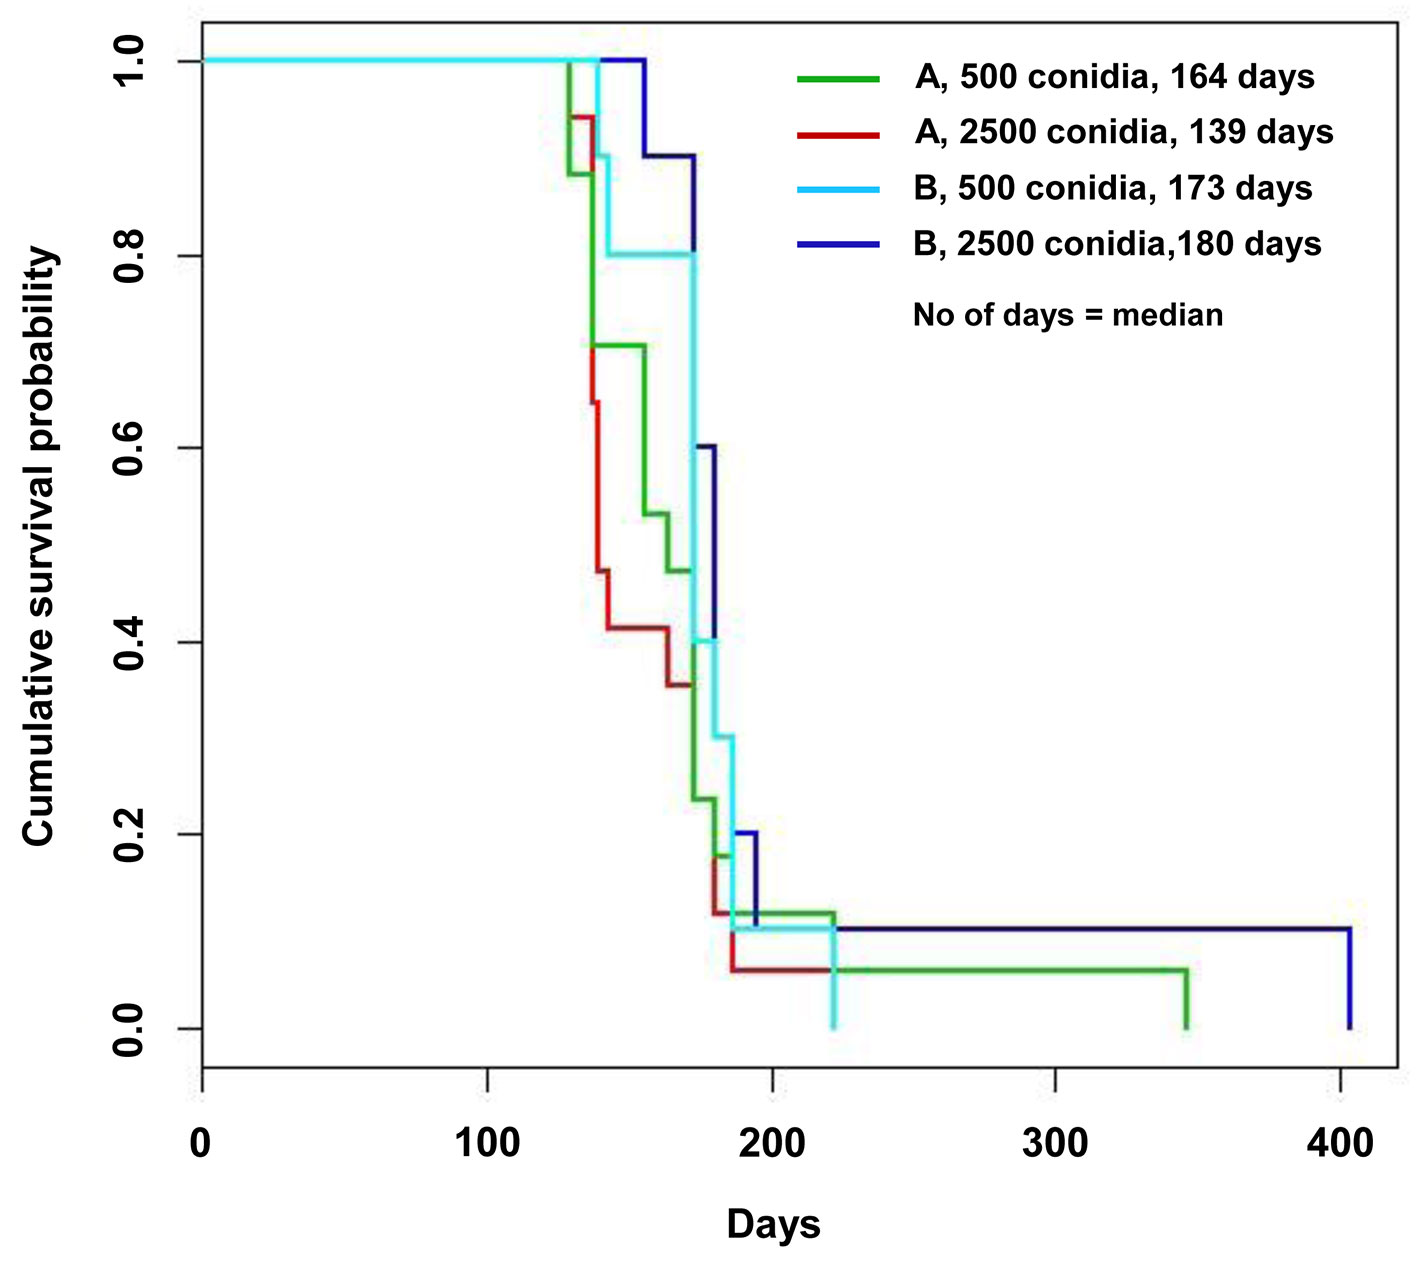
With regard to the time to death, loss of viability occurred from July 2009 onward (Tab. 1). Additional details on the month-by-month time of death from July to November 2009 are reported in the Appendix 3 of Supplementary Material. The different inoculum doses did not significantly affect the time of death either in the nursery or in the field trials, or in all the inoculation time-based treatments. An exception was a slight difference, bordering the lowest level of statistical significance in the log rank test, between the two inoculum dose treatments in the potted trees inoculated in April: in fact the 5000 conidia-inoculum dose increased the survival pattern compared with the 1000 conidia-inoculum dose (Tab. 1, Tab. 2). April, May and July inoculations were highly effective in causing tree death. Mean and median values of the time of death were the lowest in May inoculations and the highest in July, suggesting a progressive increase in survival pattern (i.e., a delay of death pattern) from May to April and July inoculations (Tab. 1). The survival curves clearly display the differences in the death pattern of the trials (Fig. 1, Fig. 2). In the survival analysis, the log rank test applied to pairwise comparisons confirmed that the differences among death patterns of the three inoculation times described above were all highly significant (Fig. 1, Tab. 2). The delayed effect of July inoculation was probably due to the fact that summer was closer to the following winter than the previous spring, in that a shorter time period with suitable temperatures for fungal growth was available before low winter temperatures occurred. This might have slowed down the progress of the disease.
Tab. 2 - Results of the log rank test with a pairwise comparison of the two inoculum doses for each inoculation time, and of the different inoculation times.
| Trials | Treatments | Pairwise comparisons |
χ2 | P-value |
|---|---|---|---|---|
| Nursery | April | 1000 vs. 5000 | 4.0 | 0.0449 |
| May | 1000 vs. 5000 | 0.1 | 0.726 | |
| July | 1000 vs. 5000 | 0.3 | 0.572 | |
| October | 1000 vs. 5000 | 0.2 | 0.668 | |
| All the seasons | 1000 vs. 5000 | 0.2 | 0.665 | |
| 1000 + 5000 | April vs. May | 10.6 | 0.00111 | |
| 1000 + 5000 | April vs. July | 12.5 | 0.000399 | |
| 1000 + 5000 | April vs. October | 49.5 | 1.99e-12 | |
| 1000 + 5000 | May vs. July | 35.8 | 2.14e-9 | |
| 1000 + 5000 | May vs. October | 47.0 | 7.24e-12 | |
| 1000 + 5000 | July vs. October | 39.5 | 3.35e-10 | |
| Field planting |
Clone A | 500 vs. 2500 | 0.6 | 0.42 |
| Clone B | 500 vs. 2500 | 0.5 | 0.463 | |
| 500 | Clone A vs. Clone B | 0.6 | 0.442 | |
| 2500 | Clone A vs. Clone B | 4.6 | 0.0319 |
Fig. 1 - Survival curves of the nursery trial obtained according to the Kaplan-Meyer estimate. Each curve displays the survival pattern for each inoculation time.
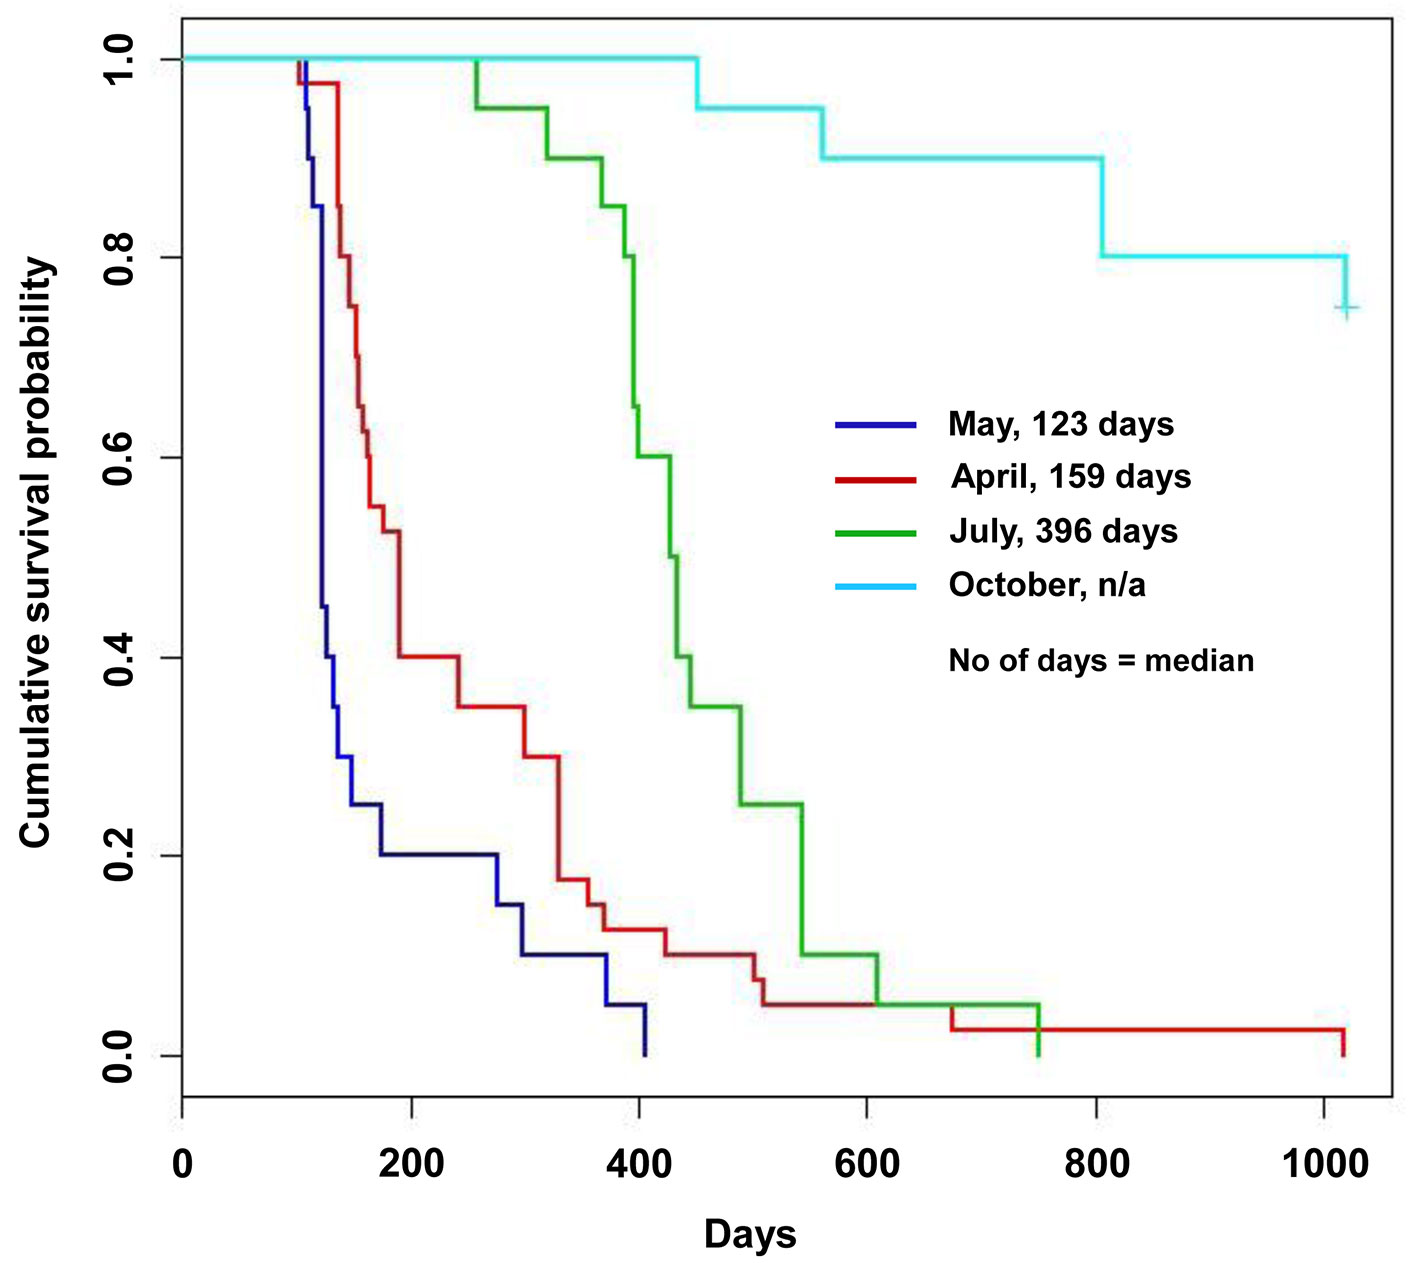
Fig. 2 - Survival curves of the field trial obtained according to the Kaplan-Meyer estimate. The curves are differentiated according to the tree genotype and the inoculum dose.
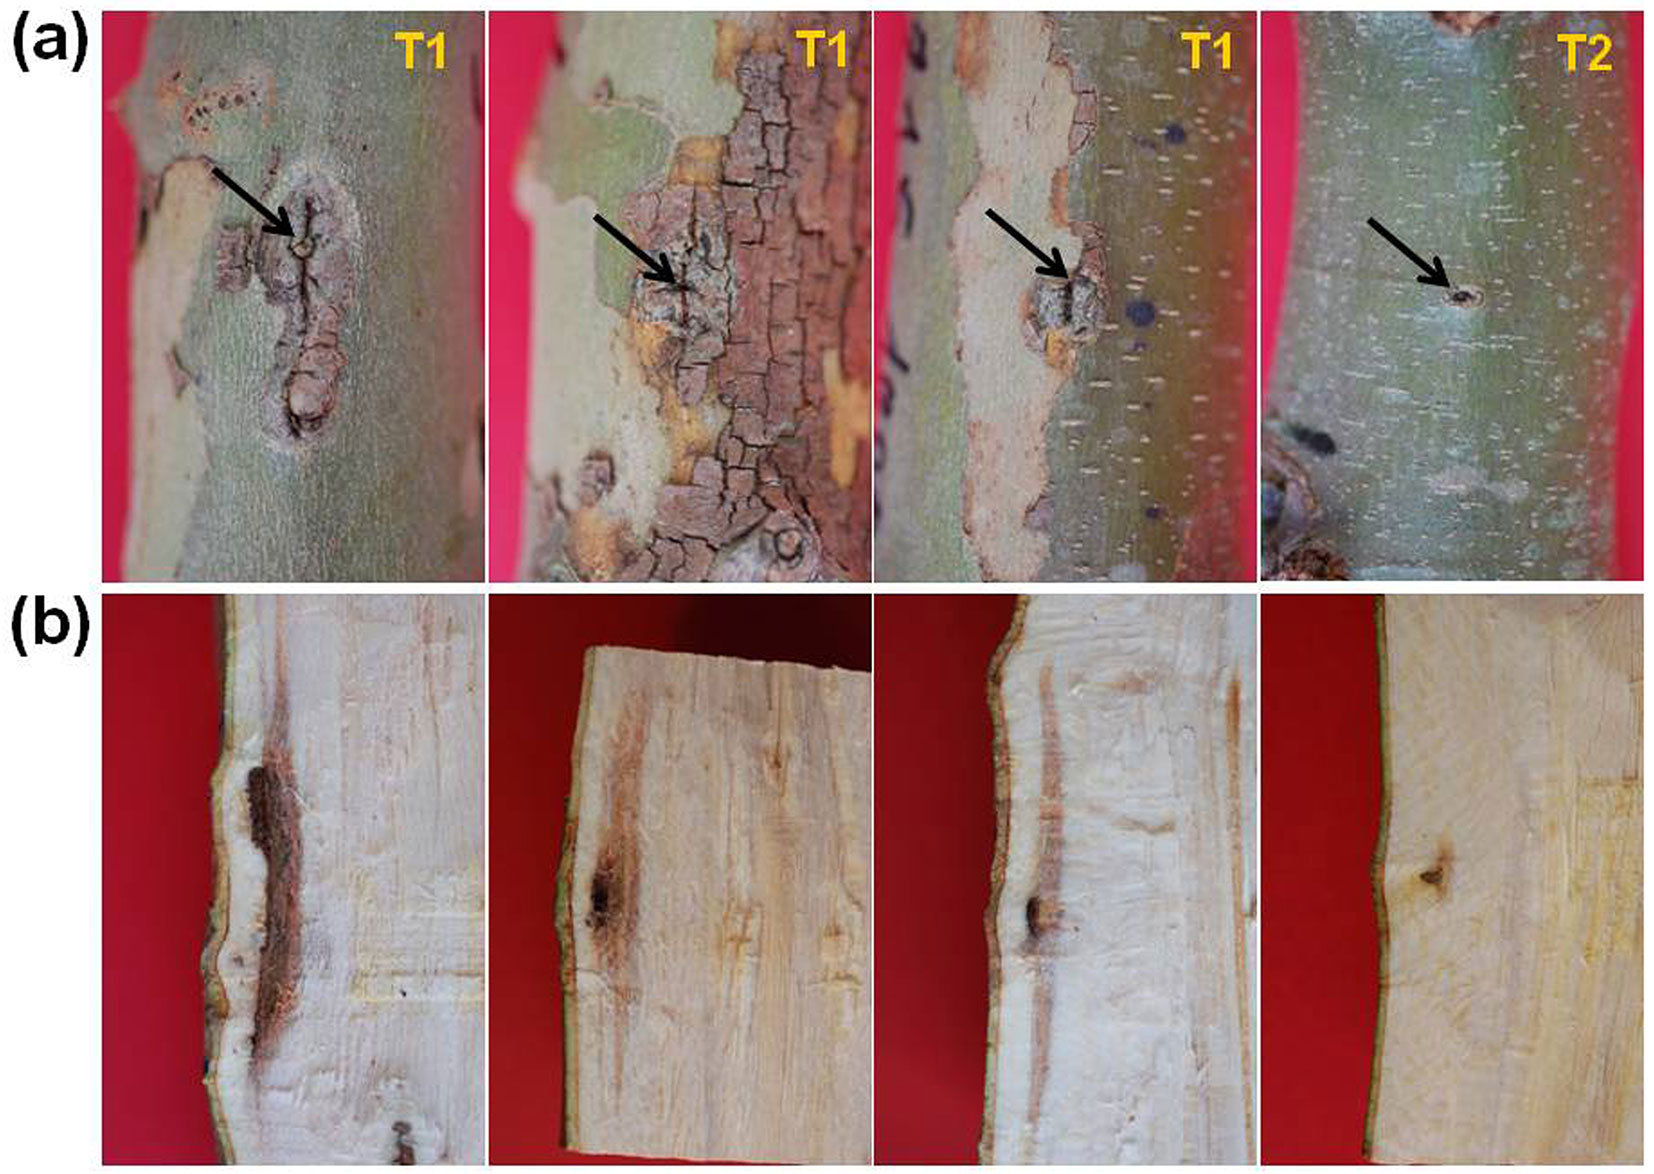
With regard to the October inoculation, 8 and 7 trees out of 10 (which were inoculated with 1000 and 5000 conidia, respectively) survived throughout the observation period (right-censored trees - Fig. 1) and showed the highest-ranking resistance reactions of our rating scale. Of these, 8 trees (equally distributed between 1000 and 5000 conidia treatments) showed thin violet necrotic halos that were first visible in April 2010 (five months after the inoculation) and were soon surrounded and scarred with a callus reaction, enabling the pathogen compartmentalization. This type of response was ranked as T1 (i.e., “callus reaction completely or almost completely covering canker lesion” - Fig. 3a). Bark necrosis and the subsequent scars were all in the range of 7-15 mm in length, with one of 35 mm. In 7 trees (4 and 3 trees inoculated respectively with 1000 and 5000 conidia) no bark necrosis was observed, and these trees were ranked as T2 (i.e., “absence of any visible bark alteration” - Fig. 3a). In the wood beneath the inoculation points of T1 and T2-ranked trees, some slight yellow/ orange/brownish streaks were present (8-83 mm, in longitudinal section; 2-5 mm in radial section - Fig. 3b). For details on the rating scale see Pilotti et al. ([21]). Five trees out of 20 died. Interestingly, despite these trees were affected by wide non-healing cankers, death occurred after a long time, i.e., from 15 to 34 months after inoculation (Tab. 1).
Fig. 3 - Resistance reactions of the trees inoculated with Ceratocysti platani in autumn. Bark healing and scarring reactions (a). Compartmentation in the wood (b). T1 and T2 are the ratings of resistance reaction (see the text for meaning). Black arrows indicate the inoculation point.
We tested the discoloured wood of survivors of the autumnal inoculations for C. platani presence by Real-Time PCR and isolation assay. As the low quantity of discolored wood was a constraint, we were able to analyse 11 out of 15 survivors (Tab. 3). All these survivors were tested by Real-Time PCR, and only in 7 survivors the quantity of discolored wood was sufficient to perform the isolation assay (i.e., plating from 30 to 60 wood fragments for each sample). Real-Time PCR detected the presence of C. platani DNA in all the tested samples (Tab. 3). All negative control reactions (no template and healthy plane wood genomic DNA controls) responded negatively, thus confirming the accuracy of the PCR run.
Tab. 3 - Detection of Ceratocystis platani in wood samples from trees surviving autumn inoculation. (1): A total of twenty trees were inoculated in the autumn, fifteen survived of which eleven were analyzed, as the quantity of discolored wood was constraining; (2): see the text for the ranking of the resistance response; (3): positive detection was obtained with threshold cycles from 22.1 to 35.4 (mean of two technical replicates); (4): n/a = not available; (5): the positive control was a tree showing a non-healing Ceratocystis platani canker, obtained from our resistance selection programme.
| Trees1 | Inoculum dose |
Response to inoculation2 |
Detection by Real-Time PCR3 |
Detection by isolation assay4 |
|---|---|---|---|---|
| 1 | 1000 | T1 | + | - |
| 2 | 1000 | T1 | + | - |
| 3 | 1000 | T1 | + | - |
| 4 | 1000 | T1 | + | - |
| 5 | 1000 | T2 | + | n/a |
| 6 | 1000 | T2 | + | n/a |
| 7 | 1000 | T2 | + | n/a |
| 8 | 1000 | T2 | + | n/a |
| 11 | 5000 | T1 | + | - |
| 12 | 5000 | T1 | + | - |
| 13 | 5000 | T1 | + | - |
| Positive control5 | 1000 | Non-healing canker | + | + |
Regarding the isolation assay, we plated from 30 to 60 wood fragments for each sample, and all samples were negative. As a positive control, we included a necrotic wood sample from a tree showing a typical canker stain symptom. In this sample, C. platani was positively detected in 53 wood fragments out of 60 (Tab. 3). Taken together, these result rules out the theory that the lack of symptoms in the trees inoculated in October was due to a defect in the inoculation process. On the contrary, the violet halos around the inoculation points, the discoloration streaks in the wood and the presence of C. platani DNA, clearly showed that the pathogen infected and colonized the wood around the inoculation point. Thus it is conceivable that, in the case of the survivors from the autumnal inoculation, a basal resistance reaction by the host impeded the expression of typical canker stain symptoms ([1]).
The survival curves confirmed a dramatic difference between the October inoculation and the other time-based inoculations (Fig. 1). This difference had a high significance in a broad sense. In fact the majority of the October-inoculated trees were still surviving stably at the end of the trials and showed high-ranking resistance reactions. This was in contrast with all the other trees, which died and were affected by non-healing cankers. The log rank test confirmed that the survival pattern of October inoculation was higher in all the comparisons, with a high level of significance (Tab. 1, Tab. 2).
The result of the Cox regression model was in line with that of the log rank test, confirming that the inoculation time is a covariate that affects the death hazard (and thus the survival time) with a high level of significance (Tab. 4). On the other hand, the effects of inoculum dose were not significant as they were almost at the lowest level of statistical significance in the nursery trial (P value = 0.0559 - Tab. 4), probably due to the slight contribution of May inoculation - 1000 vs. 5000 conidia (see also Tab. 2) and no differences were detected in the field trials (Tab. 4).
Tab. 4 - Estimation of the effects of independent variables (covariates) on the survival time of Ceratocystis platani-inoculated trees, inferred with the Cox regression model. Importantly, with regard to the inoculation time, the confidence interval for eb does not contain 1, confirming the statistical significance of the effect of this covariate on the survival time. The coefficient (b) is the logarithm of the hazard ratio regarding each covariate for the trees given a certain value (which inoculum dose - which inoculation time) compared with other trees given a different value. “e” is the base of the natural logarithm and is approximately equal to 2.71828. eb is the antilog of b and is the hazard ratio, i.e., it indicates how many times the trees given a certain covariate value are as likely to die at any time as the trees receiving another covariate value. (SE): standard error.
| Covariates | Regression coefficient (b) |
SE | P value | eb | 95% confidence interval for eb |
|---|---|---|---|---|---|
| Inoculum dose (nursery) | -0.4409 | 0.2306 | 0.0559 | 0.6435 | 0.4095 - 1.0111 |
| Inoculation time (nursery) | -0.7998 | 0.1050 | 2.63E-14 | 0.4494 | 0.3658 - 0.5522 |
| Inoculum dose (field planting) |
0.06447 | 0.2777 | 0.8164 | 1.06659 | 0.6189 - 1.8381 |
| Clone (field planting) | -0.58656 | 0.29028 | 0.0433 | 0.55624 | 0.3149 - 0.9825 |
Overall, our data prove that inoculation time impacts heavily on the progress of the disease not only in terms of conditioning the time to death, but also tipping the balance between survival and death.
In vitro mycelium growth and conidial germination of Ceratocystis platani
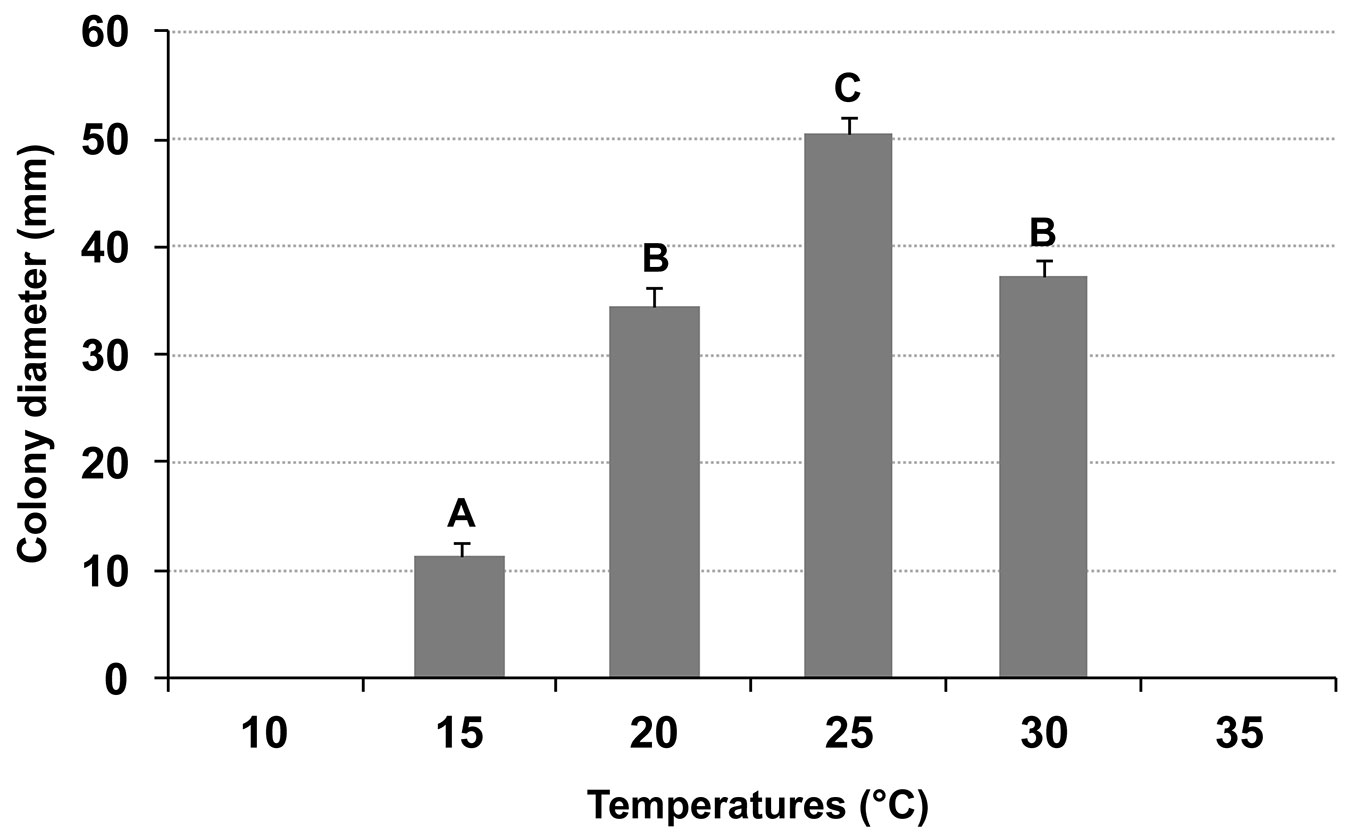
C. platani showed the highest growth at 25 °C. The differences between the different temperatures were always significant except between 20 and 30 °C. The minimum and maximum temperatures at which no growth was recorded were 10 and 35 °C, respectively (Fig. 4). Exposure of the fungus to 35 °C, for seven days, did not affect its viability. Loss of viability occurred after incubation at 37.5 °C.
Fig. 4 - Average diameter growth of Ceratocystis platani, on PDA after 7 days at different temperatures in the dark. Growth rates marked by different letters (top of bars) are significantly different from each other (p < 0.01). Vertical bars indicate the standard deviation of the means.
We also explored the effects of time-dependent exposure of mycelium at 40 and 42.5 °C. In the test conducted at 40 °C, fungal plugs maintained their viability even after 24-hr exposure, whereas all plugs lost viability after 48 hrs. At 28 and 32 hrs respectively 4/5 and 1/5 fungal plugs out of 15 were still viable. The time-window between 32 and 48 hrs remained unexplored. In the test conducted at 42.5 °C fungal plugs were all still viable after 8 hrs, whereas a complete devitalization occurred after 24 hrs. The time-window between 8 and 24 hrs remained unexplored. These results highlight the wide range of the thermal ecological niche of C. platani.
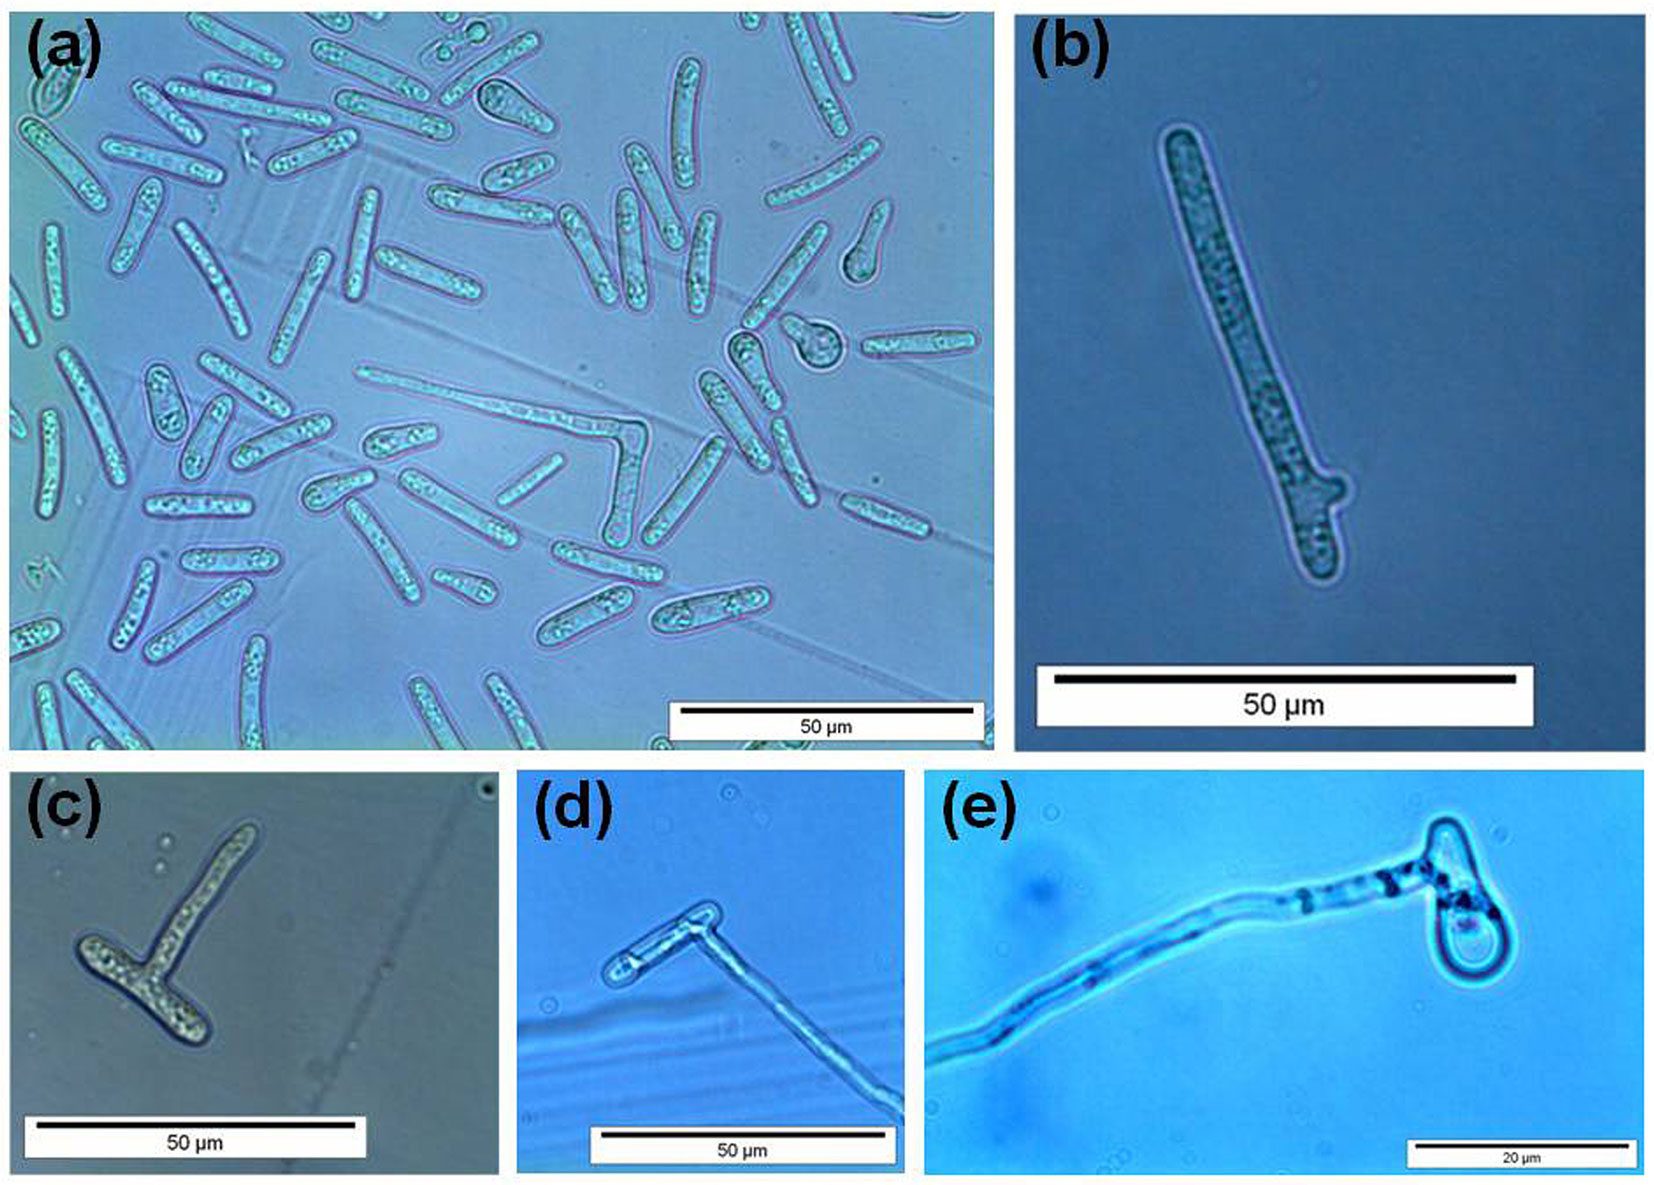
In the germination tests, we established that a germination event occurred successfully when the germ tube appeared as an actively growing hypha roughly as long as the conidium from which it emerged (Fig. 5). Conidia generally produced one/two germ tubes from the lateral to apical ends (Fig. 5a, b, d, e). A germ tube was produced less frequently along the conidium sides (Fig. 5c). We also observed that germ tube formation was preceded by the migration of cellular content at the germination site. Germination rate in the freshly obtained suspensions (i.e., before incubation) ranged from 2 to 4%.
Fig. 5 - Germination of Ceratocystis platani conidia. In general, germ tubes emerged from the lateral to apical ends (a, b, d, e) or along the conidium sides (c).
The analyses showed that both temperature and conidial concentration significantly conditioned the process (Fig. 6). The germination rates were significantly different between the two tested concentrations at all temperatures (0.000193 < P < 0.03775). Specifically, in the range 5-35 °C, the germination rate at 10 000 conidia µl-1 was lower than that at 1000 conidia µl-1 (Fig. 6). This strongly suggests that a germination-self-inhibition occurs in C. platani. In high-density suspensions of other fungal species, germination self-inhibition is well known and is triggered by chemical compounds produced by the fungus itself ([29], [3], [13]). Interestingly, the trend was inverted at 37.5 and 40 °C, although at these temperatures the germination rates were very low (Fig. 6). This inversion cannot be explained with our data. However, it is important to note that after incubation at these temperatures, which are lethal for C. platani mycelium, the concentration of viable conidia was probably much lower than that used in the experimental set up. In fact at 37.5 and 40 °C, many conidia appeared as if they had lost their cellular content, totally or in part. The real viable conidia concentration was thus probably below the minimum threshold at which self-inhibition is triggered, with the 10 000-conidia-treatment keeping a higher number of viable and germinating conidia, as compared with the 1000-conidia-treatment.
Fig. 6 - Germination rate of Ceratocystis platani conidia as a function of temperature and concentration. Vertical bars indicate the standard deviation of the means from two distinct experiments. In the case of 15 and 20 °C, experiments were repeated four and six times respectively with very similar results, and confirmed the unexpected biphasic nature of the germination curve (data not shown). The box reports the P-values of various pairwise comparisons (Student’s t-test).
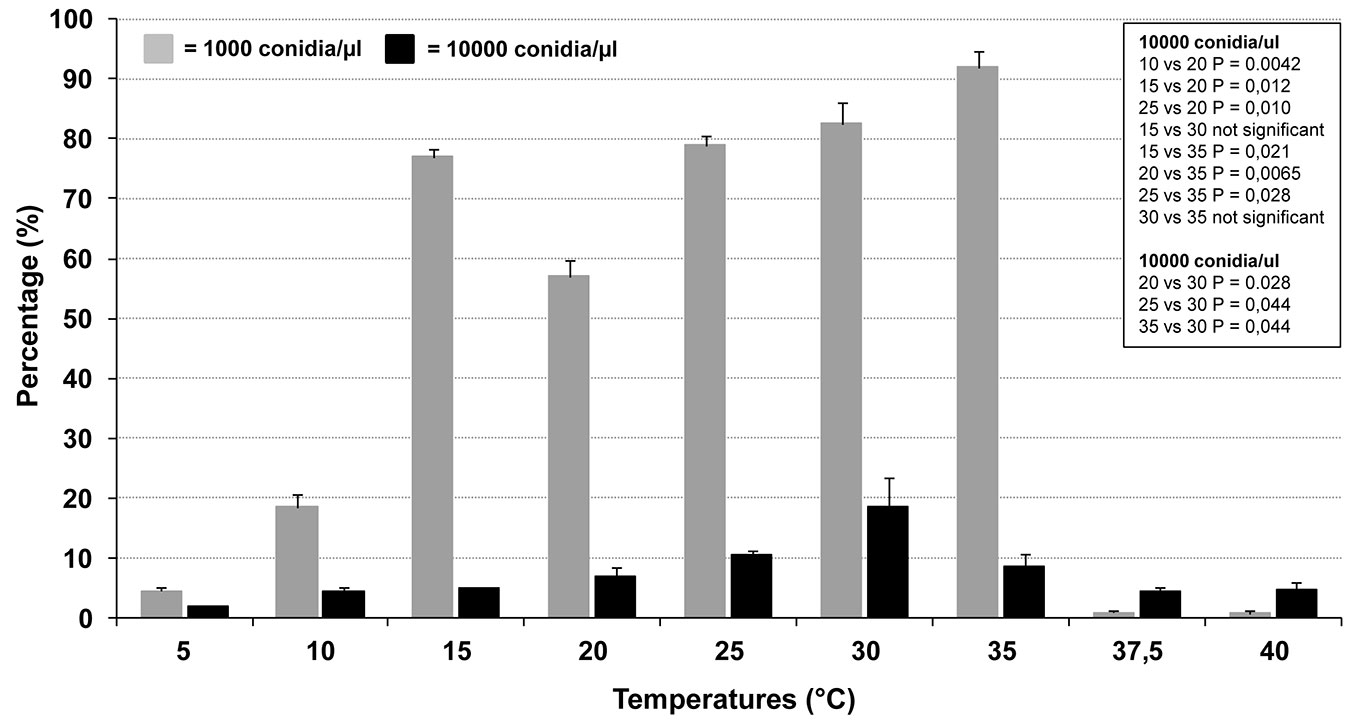
Unexpectedly, at 1000 conidia µl-1 the germination trend was biphasic: a germination peak occurred at 15 °C and was significantly higher than at 20 °C. For increasingly high temperatures, in both 1000 and 10 000 conidia µl-1, the germination rate increased up to a maximum which occurred respectively at 35 and 30 °C (Fig. 6). At higher temperatures (37.5 and 40 °C), no germination occurred at 1000 conidia µl-1 and only a very few conidia showed hypha-like germ tubes at 10 000 conidia µl-1, which however were no longer able to grow even after an incubation of 72 hr. In addition, at these extreme temperatures and at both concentrations, many conidia showed minute warts, which did not produce actively growing germ tubes. Conidia also showed a germination rate, albeit minimal, at the lowest temperature tested (5 and 10 °C).
The germination rate at 15 and 20 °C was also tested in additional two strains, Si and Ve, from southern and northern Italy, respectively. Each temperature-experiment was repeated four times with similar results. The unexpected trend found for isolate NM was fully confirmed, as the germination rates at 15 °C for isolates Si and Ve (mean ± SD: 50.4% ± 2.5 and 56.2% ± 2.2, respectively) were significantly higher than at 20 °C (33.6% ± 2.6 and 46% ± 4.1 - P < 0.0005 and 0.004 for Si and Ve, respectively). The biphasic nature of the germination curve, at 1000 conidia µl-1, though unexpected, highlights the high adaptability of C. platani to a wide range of thermal conditions.
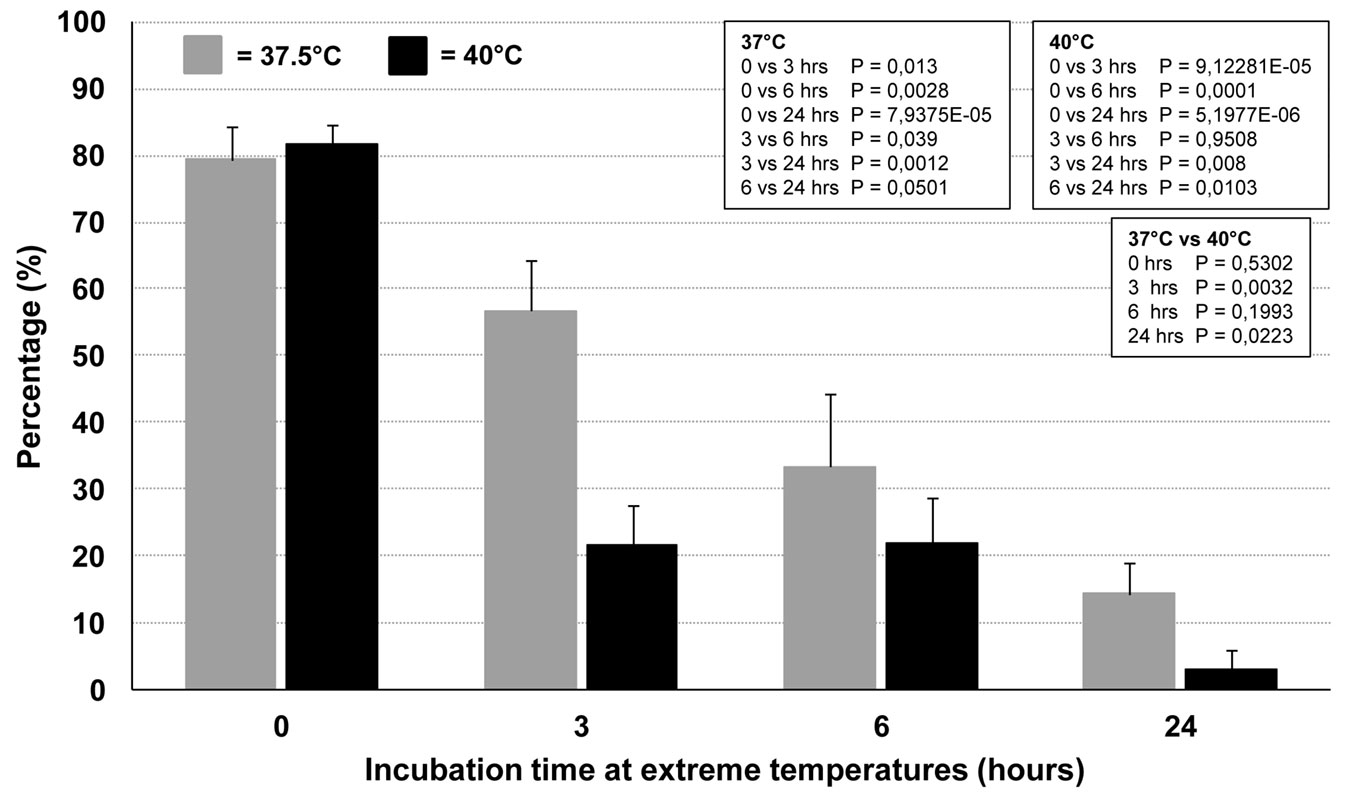
Time course experiments were performed in order to further explore the effects of the extreme temperatures on conidia germination. Incubation at 37.5 and 40 °C significantly and dramatically decreased the capacity of the conidia to germinate at 25 °C, compared with the control (incubation only at 25 °C). The longer the incubation time at extreme temperatures, the stronger the germination inhibition, which indicated loss of viability (Fig. 7). The germination inhibition was significantly higher at 40 °C compared with 37.5 °C. Interestingly, 24-hour incubation at both temperatures still enabled a residual, although very low, germination at 25 °C (mean ± SD: 14.3% ± 4.5 and 3% ± 3 at 37 and 40°C, respectively - Fig. 7). Unlike the time-course experiments conducted on mycelial plugs, temperatures higher than 40 °C did not give reliable results. In fact, at these temperatures, the hemocytometer chamber lost its water content and thus was not suitable for studying conidia germination in such conditions.
Fig. 7 - Effect of time-dependent incubation at 37.5 and 40°C on conidia germination. Germination was evaluated soon after exposure at the extreme temperatures by incubating the conidia-containing hemocytometers at 25 °C for 24 hrs, and then counting the germinating conidia. In the boxes are reported the P-values of pairwise comparisons within each temperature and between temperatures (Student’s t-test).
All results from analyses on conidia germination highlight that the fungus is fully active in a wide range of temperatures and also tolerates the upper thermal limits for prolonged times.
Comparing the results obtained with mycelium growth and conidia germination revealed that the upper thermal limits are shifted by a few degrees (mycelium: 35 °C, block of growth; and 37.5 °C, begin of a time-dependent loss of viability; conidia: 37.5-40 °C, extremely limited or annihilation of germination and begin of a time-dependent loss of viability). This is not surprising as the hypha and the endoconidium are two distinct morphological structures. Thus it is also reasonable to infer that they react differently to environmental stimuli. Our data clearly suggests that the physiological trait that we studied - mycelium growth and conidia germination - have different thermal demands (Fig. 4, Fig. 6). The evolutionary advantage in terms of virulence and environmental adaptability remains to be elucidated.
The match between temperature trends during the inoculation trials and C. platani in vitro thermal niche
Fig. 8 presents the temperature variation in a period of 10 days before and after the inoculation date for each inoculation time. Overall, there seems to be a close match between aggressiveness of season-based inoculations and the capacity of the fungus to be active in vitro as a function of the temperature (Fig. 4, Fig. 6, Fig. 7, Fig. 8).
Fig. 8 - For each season-related inoculation trial, daily minimum and maximum temperatures are shown which cover a period of 10 days before and after the inoculation day, which is framed.
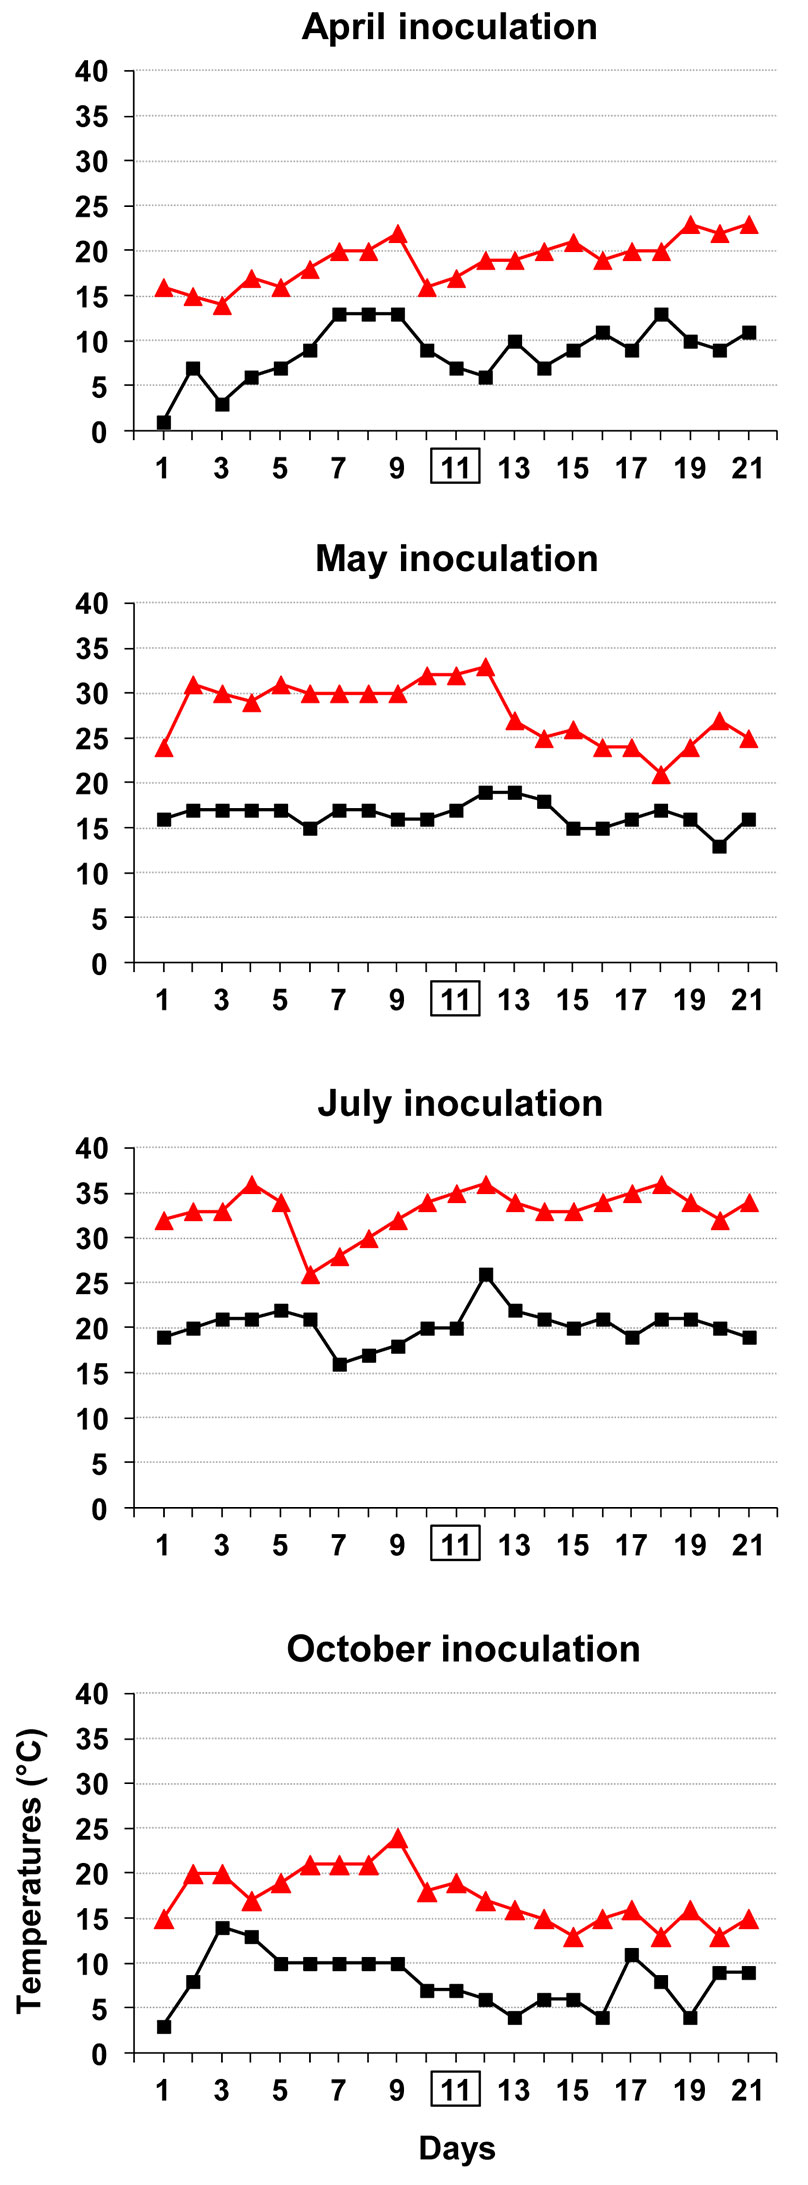
The fact that May inoculations were the most aggressive is in full agreement with the climate temperature pattern, which falls into the range of the optimal temperatures for both in vitro growth and conidia germination of the fungus (Fig. 4, Fig. 6, Fig. 8).
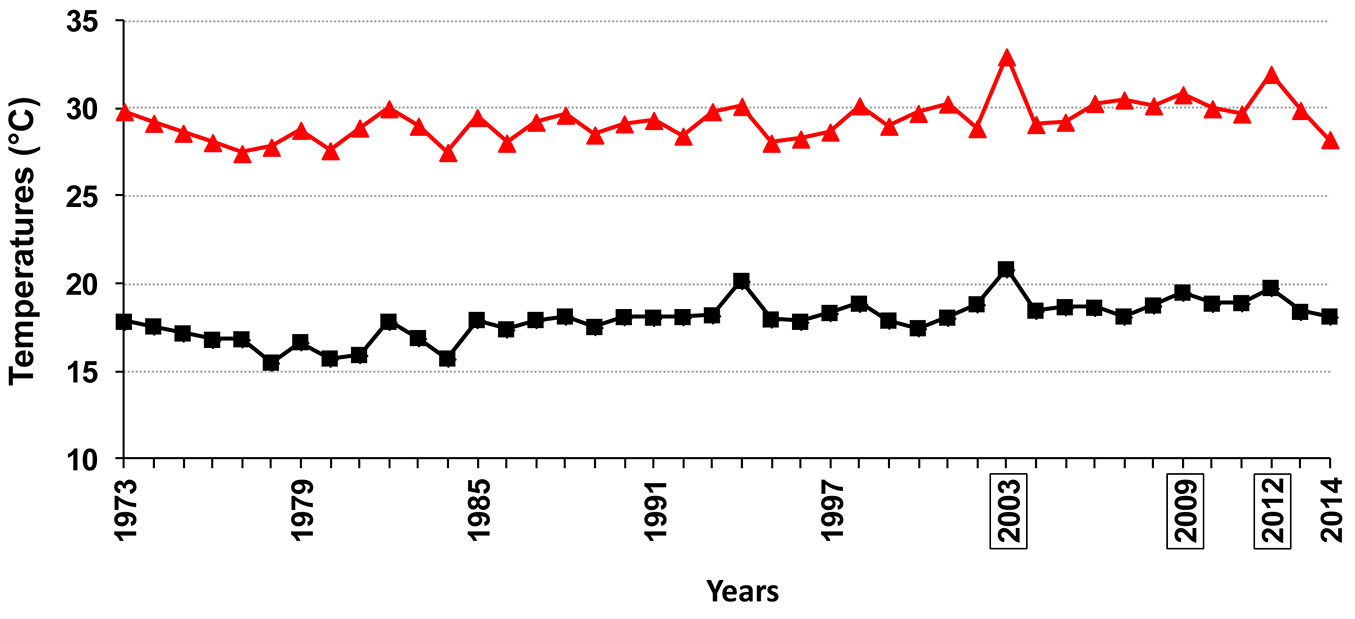
The high temperatures throughout the summer inoculation period clearly show that the pathogen successfully infects plane trees even in the hottest period of the year in Rome. Interestingly, based on the yearly average values of minimum and maximum temperatures in Rome, referring to June / July / August, the inoculation year (2009) turned out to be the third warmest year from 1974 to 2014 (Fig. 9). The high aggressiveness of the summer inoculation concurs with results of C. platani in vitro analyses. In fact, daily minimum and intermediate temperatures during the summer inoculation period were highly favorable for both conidia germination and mycelial growth (Fig. 4, Fig. 6, Fig. 8). Despite maximum daily temperatures being near the upper limit of the thermal in vitro niche of the fungus, this did not prevent C. platani from causing tree death (Tab. 1, Fig. 1). This is also in line with the results of our in vitro tests. In fact, C. platani was able to keep its viability and the potential for growth and germination even when the upper thermal limits were reached or exceeded, provided that this is only for a limited period of time, which in any case is more than sufficient to span the duration of daily temperature peaks (see Fig. 7 and the results of time course experiments on mycelium viability).
Fig. 9 - Summer temperature trend in Rome, from 1973 to 2014. The curve is based on the yearly average values of minimum and maximum temperatures referring to June/ July/August. The framed years were the warmest of the analyzed period.
The temperatures occurring during autumnal inoculations, which failed to express disease symptoms, are in agreement with a high in vitro conidial germination and a low in vitro mycelial growth or a block of both functions (Fig. 4, Fig. 6, Fig. 8). Thus this temperature pattern does not reject the hypothesis that the fungus is still active. In fact C. platani did infect the trees, though without causing canker stain (Fig. 3). It can thus be speculated that a combination of a season-linked resistant reaction of the host and a temperature-linked reduction in pathogen virulence might have determined the outcome of the autumnal inoculation. This unexpected result was verified on just one clone, and we cannot rule out that there may have been some genotype-specific contribution. In the context of outlining a suitable protocol for resistance testing, autumnal inoculation appears to be misleading and we believe it should be avoided.
Conclusions
All inoculum doses caused lethal canker stain, both in the nursery and field trials. Both late and early spring inoculation led to a more rapid death, the most rapid being with late spring inoculation. This confirms the appropriateness of the selection protocols carried out thus far, with regard to these parameters. On the contrary, the failure of disease development in the autumnal trial shows that susceptible trees also respond in a resistant way, probably by activating a basal resistance ([1]). Understanding the basis of this resistance might help genetic selection programs. The aggressiveness of summer inoculations is important in the context of legal sanitary measures for canker stain control, namely prophylaxis and eradication. In fact, regarding the removal period of diseased trees, the Italian Ministerial Decree is vague as it recommends the driest periods of the year ([12]), yet our results clearly suggest that felling infected trees should be avoided also during the hottest periods. Nor is autumn suitable for tree removal. In fact during this period disease failure was not complete as it was observed in 15 trees out of 20, and we did not identify how wide the time-frame is in which a non-virulent infection can occur. Thus, on the basis of our results only the coldest and driest periods of the year should be considered as less risky in terms of facilitating new infections and are the most suitable times of the year for removing infected trees. Similarly, with regard to pruning, the Ministerial Decree recommends a dry period during tree dormancy. We think that also in this case special attention should be given to the occurrence of low temperatures, which should not be taken for granted at any time during the dormancy period of the tree.
Inoculation trials were not performed in winter due to the lack of ramets. In vitro tests showed that conidial germination can also occur at temperatures as low as 5 °C, though at very low rates. This raises the question as to whether a successful infection process can start in winter, which is the dormant season. Testing winter to verify the capacity of C. platani to infect plane trees, would require at least two trials, differentiated according to temperature conditions that can vary greatly in winter, and performed on both susceptible and potentially resistant trees.
We believe that another important contribution of this work has been the development of a rapid and repeatable hemocytometer-chamber-based technique, suitable for studying conidia germination. This technique proved to be repeatable and highlighted for the first time that a conidia-germination-self-inhibition phenomenon characterizes C. platani, in addition to the biphasic nature of the germination curve.
Acknowledgements
GDL, MP, and AB performed cutting propagation and carried out the nursery and field surveys; MP, AB, VL, and GDL performed the inoculations; VL and GDL carried out Ceratocystis platani detection; VM, GDL and MP analysed conidia germination and the mycelium growth; GDL collected and analysed meteorological data; VM and MP performed basic statistical analyses; AB performed the survival analyses and the related tests of significance; MP conceived the study and drafted the manuscript. All the authors were responsible for drafting the manuscript.
We are grateful to Prof. Stefano Morini (University of Pisa) who generously provided a large number of micropropagated ramets. Thanks also to Olindo Marani who took care of the plants in the nursery. We would also like to express our thanks to Francesco Messina and to all the staff at Servizio Giardini of Rome for making the experimental field available, for tree planting and for cutting weeds and shrubs.
References
Gscholar
Gscholar
Gscholar
Gscholar
Gscholar
Gscholar
Gscholar
Gscholar
Gscholar
Supplementary Material
Authors’ Info
Authors’ Affiliation
Giovanni Di Lernia
Vanessa Modesti
Valentina Lumia
Angela Brunetti
Consiglio per la ricerca in agricoltura e l’analisi dell’economia agraria, Centro di Ricerca per la Patologia Vegetale - CREA-PAV, v. Carlo Giuseppe Bertero 22, I-00156 Roma (Italy)
Corresponding author
Paper Info
Citation
Pilotti M, Di Lernia G, Modesti V, Lumia V, Brunetti A (2016). Outcome of Ceratocystis platani inoculations in Platanus × acerifolia in relation to season and inoculum dose. iForest 9: 608-617. - doi: 10.3832/ifor1594-008
Academic Editor
Alberto Santini
Paper history
Received: Feb 11, 2015
Accepted: Dec 01, 2015
First online: Mar 17, 2016
Publication Date: Aug 09, 2016
Publication Time: 3.57 months
Copyright Information
© SISEF - The Italian Society of Silviculture and Forest Ecology 2016
Open Access
This article is distributed under the terms of the Creative Commons Attribution-Non Commercial 4.0 International (https://creativecommons.org/licenses/by-nc/4.0/), which permits unrestricted use, distribution, and reproduction in any medium, provided you give appropriate credit to the original author(s) and the source, provide a link to the Creative Commons license, and indicate if changes were made.

Web Metrics
Breakdown by View Type
Article Usage
Total Article Views: 56336
(from publication date up to now)
Breakdown by View Type
HTML Page Views: 46100
Abstract Page Views: 4070
PDF Downloads: 4720
Citation/Reference Downloads: 62
XML Downloads: 1384
Web Metrics
Days since publication: 3772
Overall contacts: 56336
Avg. contacts per week: 104.55
Article Citations
Article citations are based on data periodically collected from the Clarivate Web of Science web site
(last update: Mar 2025)
Total number of cites (since 2016): 11
Average cites per year: 1.10
Publication Metrics
by Dimensions ©
Articles citing this article
List of the papers citing this article based on CrossRef Cited-by.
Related Contents
iForest Similar Articles
Research Articles
Comparison of commercial elm cultivars and promising unreleased Dutch clones for resistance to Ophiostoma novo-ulmi
vol. 8, pp. 158-164 (online: 07 August 2014)
Research Articles
Effects of substrate and ectomycorrhizal inoculation on the development of two-years-old container-grown Norway spruce (Picea abies Karst.) seedlings
vol. 8, pp. 487-496 (online: 10 November 2014)
Research Articles
Maximizing growth of Acacia confusa through native plant growth-promoting bacterial inoculation and seed pelleting for revegetation in landslide areas
vol. 19, pp. 28-37 (online: 11 January 2026)
Research Articles
Variation in resistance to the rust fungus Melampsora larici-populina Kleb. in Populus nigra L. in the Czech Republic
vol. 9, pp. 146-153 (online: 26 October 2015)
Research Articles
Real-Time PCR for Ceratocystis platani detection: in-depth validation to assess the diagnostic potential and include additional technical options
vol. 11, pp. 499-509 (online: 18 July 2018)
Research Articles
Adaptive response of Pinus monticola driven by positive selection upon resistance gene analogs (RGAs) of the TIR-NBS-LRR subfamily
vol. 10, pp. 237-241 (online: 02 February 2017)
Research Articles
Exploring the reliability of CAN-bus data in assessing forwarder rolling resistance under real working conditions
vol. 17, pp. 360-369 (online: 13 November 2024)
Research Articles
Seven Ulmus minor clones tolerant to Ophiostoma novo-ulmi registered as forest reproductive material in Spain
vol. 8, pp. 172-180 (online: 13 August 2014)
Research Articles
Role of serotiny on Pinus pinaster Aiton germination and its relation to mother plant age and fire severity
vol. 12, pp. 491-497 (online: 02 November 2019)
Review Papers
Dutch elm disease and elm bark beetles: a century of association
vol. 8, pp. 126-134 (online: 07 August 2014)
iForest Database Search
Search By Author
Search By Keyword
Google Scholar Search
Citing Articles
Search By Author
Search By Keywords
PubMed Search
Search By Author
Search By Keyword


