Predicting tree crown defoliation using color-infrared orthophoto maps
iForest - Biogeosciences and Forestry, Volume 6, Issue 1, Pages 23-29 (2013)
doi: https://doi.org/10.3832/ifor0721-006
Published: Jan 14, 2013 - Copyright © 2013 SISEF
Research Articles
Collection/Special Issue: IUFRO 7.01.00 - COST Action FP0903, Kaunas (Lithuania - 2012)
Biological Reactions of Forest to Climate Change and Air Pollution
Guest Editors: Elena Paoletti, Andrzej Bytnerowicz, Algirdas Augustaitis
Abstract
Orthophoto maps based on color-infrared aerial photography have been used by the Lithuanian forest inventory since 2001. This study aimed to investigate the opportunities for using these orthophoto maps to predict tree crown defoliation at the single tree and sample plot levels. The test area was located in the Aukstaitija National Park, eastern Lithuania, and it was photographed in the summer of 2008 using a Vexcel UltraCam D digital frame aerial camera to produce digital orthophoto maps with a 0.5 x 0.5 m ground sampling density. Some 1721 tree crowns (mainly pine, spruce and birch), located in 166 permanent sample plots, were identified and delineated on the orthophoto maps. Crown defoliation and other dendrometric characteristics were field-estimated for all of these trees in summer 2008. Judgments on the suitability of using color-infrared aerial photography based orthophotos to estimate tree crown defoliation were based on the accuracy of the defoliation prediction. Defoliation for each crown was predicted using the non-parametric k-Nearest Neighbor (k-NN) method and characteristics extracted from the digital orthophoto maps as the auxiliary variables for prediction. Prediction accuracies were validated using the “Leave One Out” technique by comparing the predicted data with data from field-assessed crown defoliations. The lowest root mean square errors for the predicted tree crown defoliation values were 7.564 for pine trees, 9.166 for spruce and 7.712 for birch and the highest coefficients of correlation between field-estimated and predicted crown defoliations were 0.576, 0.600 and 0.386, respectively. However, there was no best performing solution for using the k-NN prediction found, as the best results were achieved using different approaches. Next, predicted and field estimated tree crown defoliation values were aggregated up to the sample plot level by taking an averaging of trees in the same sample plot. The root mean square error at the sample plot level was around 3.7 %, the bias was statistically not significant and the correlation coefficients between plot-wise average values of field-estimated and predicted defoliations were around 0.8. The achieved results suggested that color-infrared orthophoto maps could be a potential data source of forest health characteristics for use in stand-wise forest inventories.
Keywords
Color-infrared Aerial Image, Orthophoto Map, Non-parametric k-Nearest Neighbor Method, Tree Crown Defoliation
Introduction
Lithuania has a long history of using airborne remote sensing in forest inventories ([4], [19]). Since 1950, the inventory has been based on a combination of aerial photograph interpretation and conventional fieldwork. In the 1980s and 1990s, aerial photographs were available for 85 % of the inventoried area ([5]). The introduction of Geographic Information Systems (GIS) to the stand-wise forest inventory in 1995 required new solutions so that the geometrical quality of spatial databases could be improved. This meant that, starting from 1996, panchromatic orthophotographic maps were introduced into the stand-wise forest inventory to replace the aerial photographs ([19]). Since 2002, orthophotos, based on color-infrared (CIR) aerial photography, have been produced every year for approximately 15 % of the country’s area ([20]). Technical specifications for the orthophotos were strictly followed and have changed little during the last decade, which makes the orthophoto material taken in different years and for different areas easily compatible.
The following technological approaches have been used: color-infrared aerial photography in the summer season, based on a ground sampling density of 0.5 m and radiometric enhancement to facilitate tree species separation ability. However, (i) film aerial photography (Kodak Aerochrome III Infrared 1443 aerial films) and development of the films into negatives using the Kodak AN5 processing technique was used up to 2007 and (ii) since 2007 it was replaced by the digital Vexcel aerial cameras. There have been many studies carried out in the country dealing with the usability of orthophotos for interpreting forest characteristics in conventional stand-wise inventories and they have mainly focused on the use of the visual analytical interpretation method ([8], [10], [18]). The potential to detect crown defoliation classes corresponding to the ones used in the European International Co-operative Program on Assessment and Monitoring of Air Pollution Effects on Forests (ICP Forests - [28]) was tested in Lithuania using specially acquired test aerial images ([7], [2]. However, the potential use of standardized color-infrared aerial photography based orthophotos produced for Lithuanian forest inventories has not been tested so far. This study aimed to fill this gap.
There are many examples of the successful use of airborne remote sensing to evaluate forest or tree health conditions ([14], [29], [9]). However, most of the research or operational applications have been based on human or visual interpretation. Tree crown defoliation is considered to be a key indicator of forest health ([23]. Visual comparison of tree crown density with the density of a conditionally healthy tree remains the main method used to estimate tree crown defoliation. However, such an approach in the assessments is affected by subjectivity to some extent ([12], [2], [11]) and it is costly and time consuming, particularly if the aim is the full spatial sampling ([17]).
Automated assessment of individual tree crown characteristics appeared on the research agenda only with the introduction of very high resolution digital airborne or satellite images. Today, the state-of-the-art of laser scanning and hyperspectral imaging in forest health assessment has become important ([25], [16], [24], [3]). Automated or semi-automated assessments of forest inventories oriented towards individual tree or forest stand characteristics already exist at the operational level, so it is important to test whether it is possible to provide forest health statistics using similar methodology. Detection and mapping of forest health is important when creating treatment plans and correcting growth estimates. There are also more general ecological benefits.
The non-parametric k-Nearest Neighbor (kNN) method ([26]), which originated from studies on the remote sensing based assessment of tree and forest stand dendrometric characteristics, was investigated in this study as a potential method for predicting tree crown defoliation. The idea behind kNN is that “field measurements in a certain area can also be made use of in neighboring areas by employing a relevant extrapolating, or “information borrowing” technique” ([27]). In this study, the “area” is the tree crown, with unknown and field-estimated defoliations. Conventional Lithuanian forest inventory color-infrared aerial photography based orthophotos were used as the source of the remotely sensed information.
Material and methods
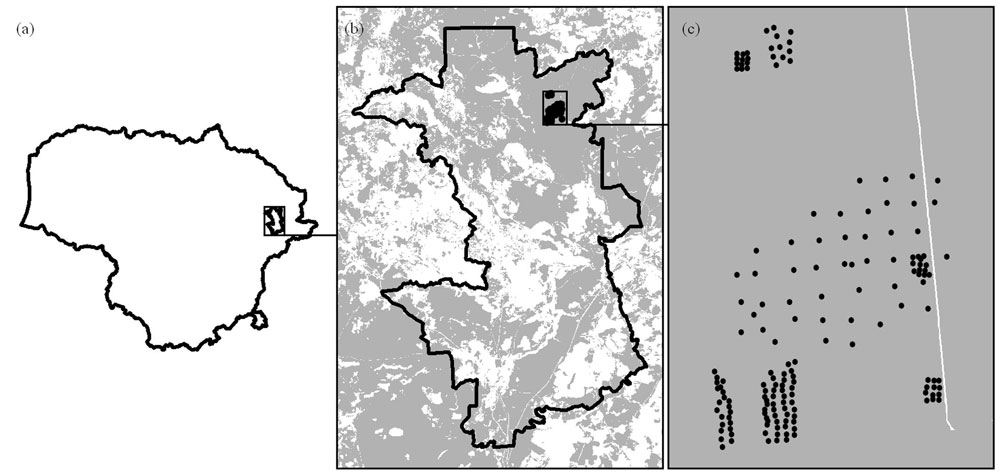
The study was carried-out in Aukštaitija National Park (ANP), located in eastern Lithuania. Coniferous forests prevail in ANP (79 %) and the average age is around 60 years. However, there are some stands present that are over 200 years old. Tree crown defoliation was assessed in 119 permanent sample plots distributed in forest compartments in the northern part of ANP and 47 sample plots located at the Aukštaitija Integrated Monitoring Station (AIMS - Fig. 1).
Fig. 1 - Location of the study area: (a) whole country; (b) Aukštaitija National Park; (c) sample plots.
A field survey of the sample plots was carried out in the summer of 2008 following the methodology of ICP Forests ([28]), which was modified to meet the aims of the current study. First, the coordinates of the sample plot were determined using a Trimble Pathfinder ProXR GPS and the location of each tree was calculated based on measurements of the azimuth and the distance of the tree to the sample plot center. Basic dendrometric tree characteristics were determined along with the tree development class and tree crown defoliation. The defoliation was assessed visually using a 5% gradation by two experienced specialists that have evaluated defoliation annually for the same trees for over 10 years. Historical records on the defoliation estimates for all trees under investigation were made available.
Orthophotos, based on color-infrared aerial photography, were also made available for the study. The whole study area was displayed on map sheet 8649, according to the mapsheet division of the Lithuanian coordinate system, LKS94. Aerial photography was carried out in the summer of 2008 using a frame Vexcel UltraCam D camera with image format of 11500 x 7500 pixels. Even the camera was capturing RGB and CIR images simultaneously, only near-infrared, red and green bands were used to produce the orthophotos. A Rockwell Turbo Commander 690A aircraft was used to carry out the flight, at an altitude of approximately 5800 m. Flight were done following the north-south direction. The camera unit was equipped with an Applanix POS/AV 510 GPS/INS system. All six exterior orientation parameters were calculated using GPS/INS data and POSPAC® software from Applanix. Raw image data from the camera were processed into final TIFF images using the Office Processing Centre® software from Vexcel Imaging by Blom Kartta Oy, Finland. The aerial triangulation was carried out as an automatic digital aerial triangulation using MATCH-AT® software. The digital terrain model (DTM) was produced using MATCH-T software and autocorrelation technique with additional break lines. The autocorrelation model was later edited photogrammetrically. Ortho-rectification was done using the ORTHOMASTER® software. The rectified images were mosaicked into the 5 x 5 km map sheets using the ORTHO VISTA® software. The ground sampling density of the images was 0.5 m.
The crown projections of field surveyed trees were identified on the orthophotos, manually digitized on a computer screen and stored in a GIS database. The identification of all tree crowns was checked in the field in 2010. In total, 1793 tree crowns were identified on the orthophotos, of which 70% of the trees were pine and 23 % were spruce. Not all field-surveyed trees were identified on the orthophotos.
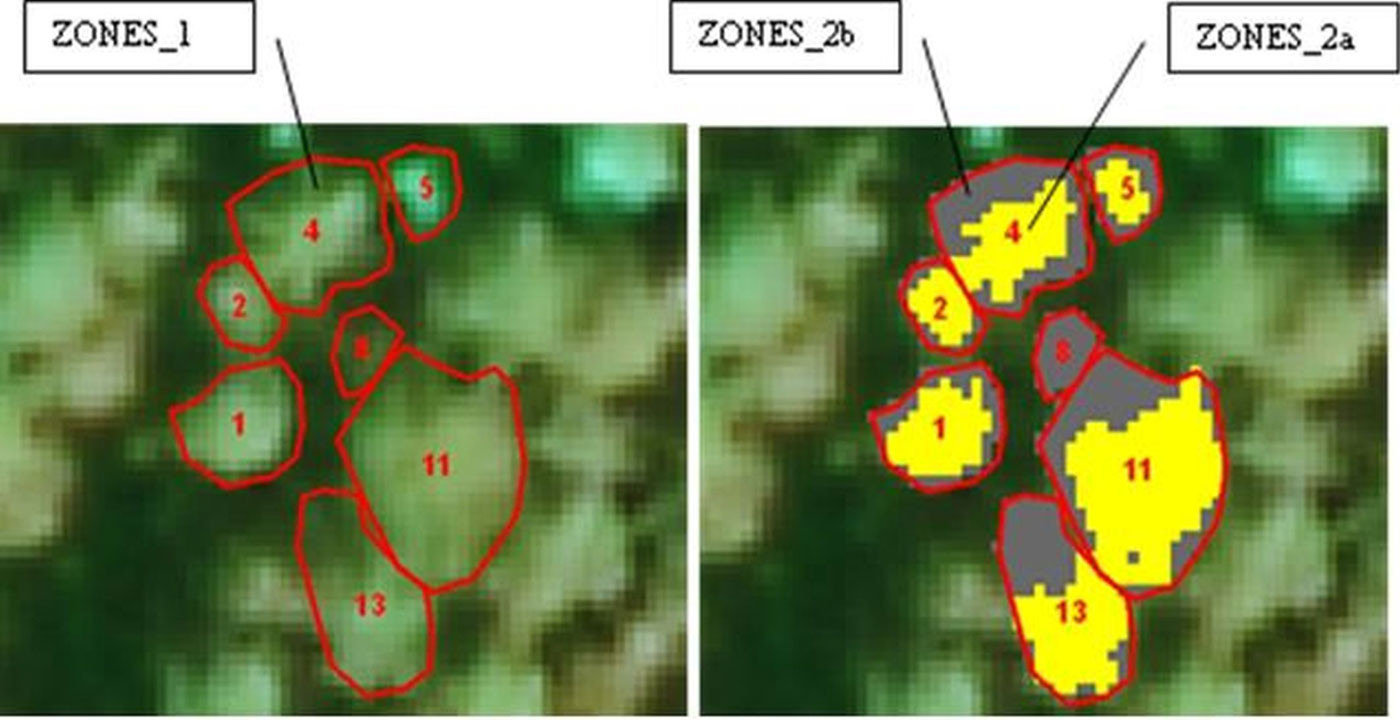
The following radiometric characteristics of the orthophotos corresponding to the digital values of each image band were extracted for the polygons corresponding to each crown projection using the standard ArcGIS Spatial Analyst tool Zonal Statistics: mean (the average of all cells in the value raster that belong to the same zone as the output cell), majority (the value that occurs most often of all cells in the value raster that belong to the same zone as the output cell), minimum (the smallest value of all cells in the value raster that belong to the same zone as the output cell), maximum (the largest value of all cells in the value raster that belong to the same zone as the output cell), median (the median value of all cells in the value raster that belong to the same zone as the output cell), minority (the value that occurs least often of all cells in the value raster that belong to the same zone as the output cell), range (the difference between the largest and smallest value of all cells in the value raster that belong to the same zone as the output cell), standard deviation (the standard deviation of all cells in the value raster that belong to the same zone as the output cell), sum (the total value of all cells in the value raster that belong to the same zone as the output cell) and variety (the number of unique values for all cells in the value raster that belong to the same zone as the output cell). Image bands referring to near infrared radiation were denoted as NIR, red as R and green as G. In addition to the original versions of the orthophotos, stored as 8-bit geographic matrices of digital numbers, Principal Component transformation (PC) and the creation of a Normalized Difference Vegetation Index (NDVI) were undertaken in order to reduce the dimensionality of the orthophoto images. Two types of zones were used in the study to separate sun illuminated parts from the shade parts of the crown: (i) zones corresponding to the delineated crown projection polygons (ZONES_1); and (ii) the interior area of the tree crown polygons were divided into two parts, corresponding to sun illuminated parts of the crown and (ZONES_2a) and parts that were in shadow (ZONES_2b) using unsupervised Iso Cluster classification (Fig. 2). Thus, each of the trees had its corresponding defoliation characteristic surveyed in the field and an array of characteristics extracted from the orthophoto.
Fig. 2 - The types of zones used to extract image characteristics.
Judgments on the suitability of using color-infrared aerial photography based orthophotos to estimate tree crown defoliation were based on the accuracy of the defoliation prediction. Defoliation was predicted at an individual crown level using the data available from orthophoto images and compared with the true, ground estimated data. The “Leave One Out” technique was used to compute the following validation statistics: prediction bias, root mean square errors (RMSE) and the correlation coefficient between the field assessed and predicted tree crown defoliation (R).
The non-parametric two-phase sampling based k-Nearest Neighbor method ([26]) was used to predict tree crown defoliation. The k-nearest neighbor method, or multi-dimensional version of the inverse distance weighted interpolation technique, can be briefly described as follows: Euclidean distance in a n-dimensional feature space of auxiliary information, di,p, is calculated between each A-observation sampling unit p (the tree crown in this case) and each B-observation unit, i. The field measured forest characteristic (tree crown defoliation) is known for each B-observation unit. Here, n refers to the total number of layers of auxiliary information, i.e., characteristics extracted from the orthophoto images - all proper image characteristics for all image bands or principal components or NDVI grid, corresponding to each crown. The k distances di,p - d(1),p, ... d(k),p, (d(1),p ≤ ... ≤ d(k),p) are found and the weight is calculated as (eqn. 1):
The tree crown defoliation value (M) for a tree crown, p, of A-observations equals (eqn. 2):
where m(j),p, j=1,...k are the values for tree crown defoliation, M, of k nearest B-observation trees to p in n dimensional feature space.
Three variants of k-NN prediction method were tested:
- k-NN1: each tree was assigned the defoliation value of the nearest tree in the n-dimensional feature space of orthophoto image characteristics, actually, the value of the 2nd nearest neighbor, as the 1st neighbor was always the tree crown that was being inspected, i.e., k=1 was used;
- k-NN2: each tree was assigned the average defoliation value of the 10 nearest trees in the n-dimensional feature space of orthophoto image characteristics, actually, the 2nd-11th nearest neighbors, i.e., k=10 and no distance weights were used. The value of k equal to 10 was chosen as keeping both the prediction bias and root mean square error at their lowest levels based on series of tests with the same image characteristics and changing the value of k up to 20;
- k-NN3: each tree was assigned the weighted average defoliation value of the 10 nearest trees in the n-dimensional feature space of orthophoto image characteristics, i.e., k=10 and t=1 were used. Other t values did not result in prediction accuracy improvement, thus they were not discussed in this paper.
Predicted and field estimated tree crown defoliation values were aggregated up to the sample plot level by taking an averaging of trees in the same sample plot. Bias, root mean square error and correlation coefficients between plot-wise average values of field estimated and predicted defoliations were used to discuss the accuracies at the sample plot level.
The Most Similar Neighbor program ([6]) was used to calculate the Euclidean distances and standard GIS and statistical processing packages (ArcGIS®, STATISTICA®, MS Excel®) were used to further process and analyze the data.
Results and discussion
Assigning the defoliation value of the nearest tree in the n-dimensional feature space by orthophoto image-based characteristics using the k-NN predictions produced root mean square errors that were larger by some 5-35 % compared to the other estimation methods (Tab. 1). The differences in correlation coefficients between field-estimated and predicted crown defoliations were even larger. This is in line with the general findings on the use of the k-NN method to predict basic forest characteristics at a sample plot level where satellite images are used as the auxiliary data source and where, on average, the 10 nearest neighbors are required to minimize the prediction root mean square error ([22], [26]). However, the fewer neighbors used, the better the variance in the original data is sustained ([13]). This is essential, especially when predicting extreme defoliation values, as there are usually only a few trees with no or very large defoliations. There is always some tendency to level the values predicted. The negative bias values indicated that the predicted crown defoliation values were practically always lower than the field observed values. This negative bias was mainly introduced by trees with relatively large defoliations receiving predicted values from nearest neighbors that had lower observed defoliations. There were practically no differences observed in the biases and root mean square errors when using the two different approaches to calculate the predicted defoliation on the basis of the values from the 10 nearest neighbors. The bias was statistically significant for pine trees and when original and transformed data from the principal components images were used as the auxiliary data sets. Also, the correlation coefficients between field estimated and predicted crown defoliations had practically always been statistically significant.
Tab. 1 - Accuracy of crown defoliation predictions at the single tree level. (*): statistically significant bias and correlations (p ≤ 0.05).
| Type of image transf. |
Tree species |
Method | Types of zones used to extract image characteristics | |||||||||||
|---|---|---|---|---|---|---|---|---|---|---|---|---|---|---|
| ZONES_1 | ZONES_2a | ZONES_2b | ZONES_2ab | |||||||||||
| Bias | RMSE | R | Bias | RMSE | R | Bias | RMSE | R | Bias | RMSE | R | |||
| Original image |
Pine | k-NN1 | -0.703* | 10.414 | 0.107* | -0.662* | 9.942 | 0.136* | -0.741* | 10.975 | 0.008 | -0.971* | 9.677 | 0.137* |
| k-NN2 | -0.581* | 7.728 | 0.571* | -0.606* | 7.748 | 0.500* | -0.427 | 7.957 | 0.453* | -0.693* | 7.574 | 0.575* | ||
| k-NN3 | -0.576* | 7.720 | 0.509* | -0.609* | 7.751 | 0.500* | -0.419 | 7.974 | 0.450* | -0.694* | 7.564 | 0.576* | ||
| Spruce | k-NN1 | -0.473 | 11.490 | 0.143* | -0.909 | 11.706 | 0.137* | -0.286 | 11.100 | 0.132* | -1.091 | 12.211 | 0.132* | |
| k-NN2 | -0.789 | 10.791 | 0.450* | -0.440 | 10.544 | 0.516* | -0.472 | 10.772 | 0.520* | -0.916 | 9.652 | 0.556* | ||
| k-NN3 | -0.830 | 10.726 | 0.460* | -0.414 | 10.566 | 0.512* | -0.446 | 10.785 | 0.518* | -0.914 | 9.660 | 0.553* | ||
| Birch | k-NN1 | -1.237 | 10.747 | 0.187 | -1.304 | 9.288 | 0.204* | 0.591 | 11.361 | 0.094 | -1.304 | 9.288 | 0.204* | |
| k-NN2 | -0.973 | 8.018 | 0.320* | -0.957 | 7.919 | 0.295 | - | - | - | -0.940 | 7.910 | 0.298* | ||
| k-NN3 | -1.026 | 8.026 | 0.314* | -0.967 | 7.890 | 0.305* | - | - | - | -0.953 | 7.880 | 0.308* | ||
| Principal Component |
Pine | k-NN1 | -0.451* | 10.050 | 0.121* | -0.689* | 10.093 | 0.122* | -0.172 | 10.659 | 0.041 | -0.750* | 9.776 | 0.129* |
| k-NN2 | -0.519* | 7.642 | 0.517* | -0.582* | 7.697 | 0.506* | -0.434 | 8.157 | 0.457* | -0.828* | 7.581 | 0.522* | ||
| k-NN3 | -0.512* | 7.649 | 0.516* | -0.580* | 7.710 | 0.505* | -0.415 | 8.161 | 0.448* | -0.824* | 7.577 | 0.522* | ||
| Spruce | k-NN1 | -0.968 | 11.271 | 0.145* | -1.699 | 10.267 | 0.211* | 0.286 | 12.987 | 0.100 | -1.802 | 11.434 | 0.178* | |
| k-NN2 | -1.083 | 10.775 | 0.457* | -0.879 | 10.569 | 0.514* | -0.438 | 10.874 | 0.503* | -1.168 | 9.327 | 0.599* | ||
| k-NN3 | -1.082 | 10.755 | 0.460* | -0.900 | 10.535 | 0.519* | -0.400 | 10.850 | 0.507* | -1.174 | 9.328 | 0.600* | ||
| Birch | k-NN1 | -0.699 | 10.202 | 0.195* | -1.304 | 9.109 | 0.244* | 0.591 | 11.361 | 0.084 | -1.304 | 9.109 | 0.243* | |
| k-NN2 | -1.038 | 7.723 | 0.381* | -0.875 | 8.205 | 0.370* | - | - | - | -0.859 | 8.211 | 0.369* | ||
| k-NN3 | -1.033 | 7.712 | 0.385* | -0.810 | 8.155 | 0.386* | - | - | - | -0.796 | 8.160 | 0.385* | ||
| Normalized difference vegetation index |
Pine | k-NN1 | -0.176 | 10.298 | 0.115* | 0.019 | 10.135 | 0.124* | 0.086 | 10.910 | 0.077 | -0.324 | 9.919 | 0.135* |
| k-NN2 | -0.217 | 7.790 | 0.486* | -0.240 | 7.688 | 0.499* | -0.177 | 8.018 | 0.447* | -0.621* | 7.690 | 0.495* | ||
| k-NN3 | -0.214 | 7.797 | 0.485* | -0.208 | 7.680 | 0.500* | -0.140 | 8.046 | 0.446* | -0.586* | 7.687 | 0.494* | ||
| Spruce | k-NN1 | -1.486 | 11.593 | 0.144* | -0.550 | 11.843 | 0.135* | -0.143 | 11.218 | 0.138* | -0.102 | 11.328 | 0.136* | |
| k-NN2 | -0.448 | 9.166 | 0.546* | -0.629 | 9.404 | 0.562* | -0.405 | 9.036 | 0.583* | -0.629 | 9.404 | 0.562* | ||
| k-NN3 | -0.495 | 9.248 | 0.534* | -0.626 | 9.391 | 0.563* | -0.324 | 8.982 | 0.594* | -0.626 | 9.391 | 0.563* | ||
| Birch | k-NN1 | -0.645 | 9.527 | 0.213* | -0.598 | 10.417 | 0.245* | 0.591 | 11.361 | 0.165 | -0.598 | 10.417 | 0.245* | |
| k-NN2 | -0.177 | 7.852 | 0.280* | 0.087 | 7.746 | 0.307* | - | - | - | 0.087 | 7.746 | 0.307* | ||
| k-NN3 | -0.215 | 7.864 | 0.269* | 0.041 | 7.851 | 0.271* | - | - | - | 0.041 | 7.851 | 0.271* | ||
Separation of the sun illuminated and shaded parts of the crown nearly always reduced the prediction root mean square errors by an average of 4%. However, there were cases where a reduction of 15-25 % was achieved. The correlations coefficients between field-estimated and predicted crown defoliations did always increase if the image characteristics, extracted from two crown zones, were used as the auxiliary variables in the prediction. Reduction in the root mean square errors was usually followed by a slight increase in the prediction bias, which was statistically significant for pine trees when transformed images were used as the auxiliary data sets. Image transformation into principal components and the NDVI did not reduce the root mean square error, but the NDVI did reduce significantly the prediction bias for birch when it was used as the input auxiliary data source.
The lowest root mean square error for predicted tree crown defoliation for pine trees was 7.564, 9.166 for spruce and 7.712 for birch. All were achieved using different k-NN prediction methods. The prediction bias for pine trees was less than the prediction bias for spruce trees. However, there was no unique prediction approach detected which would work best for all tree species. This confirms the findings coming from satellite image-based remote sensing, which suggested that there was no standardized solution for using the k-NN prediction. The best achieved results depend on the prediction objectives, the auxiliary data available, etc., so the settings need to be optimized every time the method is used ([15]).
The prediction accuracies were compatible with the ones achieved using similar methodological approaches but different image data as the input. Mozgeris et al. ([21])achieved 9-11% root mean square errors in predicting pine crown defoliation using color infrared aerial images taken from ultralight aircraft in areas that partly overlapping the current study area. Unpublished results for the area used in this study indicated a similar potential for color infrared aerial images taken at larger resolutions (ground sampling density of 10-15 cm). This suggested that color-infrared orthophoto maps, produced in a standardized way for Lithuanian stand-wise forest inventories may have the same or even a higher potential to predict individual tree crown defoliation as other aerial images acquired for use in forest health assessment studies.
The main aim of producing the color-infrared orthophotos is to use them within the frames of the Lithuanian stand-wise forest inventory to facilitate the delineation of forest compartments. Forest compartments are usually delineated by analyzing the basic forest stand characteristics (tree species composition, density, crown diameter in relation to the stem height and the diameter at breast height) that have been visually estimated from orthophoto imagery and comparing them to historical records from previous forest inventories ([19]). Technically, visual interpretation of tree crown defoliation could happen while delineation of forest compartments is taking place. Detection and mapping of forest health is important when creating treatment plans and for correcting growth estimates. The possibility of detecting crown defoliation classes corresponding to the UN-ECE/ ICP-Forests for pine and spruce stands using visual analytical interpretation of color-infrared aerial photographs at a scale 1:10000 in Lithuania has been investigated by Daniulis & Mozgeris ([7]). However, such solutions would require special training and could potentially suffer from some subjectivity. Another option could be the automatic prediction of the health status of forest compartments. In this study individual tree crown level defoliation predictions, achieved using orthophoto maps, were averaged to the sample plot level. The average figures were then compared with the figures obtained using field surveyed defoliation of the same trees. It was clear that not all trees were identified on the orthophotos. Only crowns that were sun illuminated when the aerial image was taken, that did not overlap other crowns and were large enough to be detectable by the sensor could be identified on the aerial images ([9]). This fact may cause some differences in average defoliation values estimated in the field and by using aerial images.
Only 16 % of the trees present in the field were not detected on the orthophoto maps (Tab. 2). Only 5-10% of the pine trees were not detected on the image, regardless of the tree status in the canopy. Average defoliation detection rates for pine stands using orthophoto maps did not significantly differ from rates derived from using visual assessment methods. The average defoliation of spruce stands would be 2% less because a little more than half of the spruce trees were detected on the aerial image. However, 88% and 73% of superior and dominant spruce trees, respectively, were detected on the image but this would not have influenced average image and field estimated defoliation values. The detection of birch trees on the image was between the pine and spruce as were the differences in average field and image estimated defoliations.
Tab. 2 - Percentage of trees identified on the orthophoto maps and the potential influence of tree visibility on the assessment of defoliation.
| Tree Species |
Category of the tree |
Number of trees | Percentage of detected trees |
Average defoliation | Difference in average defoliation |
||
|---|---|---|---|---|---|---|---|
| In the field |
Detected on orthophoto maps |
Trees in the field |
Trees detected on orthophoto maps |
||||
| All | Superior trees | 548 | 519 | 94.7 | 14.21 | 14.17 | 0.04 |
| Dominant trees | 819 | 756 | 92.3 | 15.87 | 15.67 | 0.20 | |
| Sheltered trees | 681 | 446 | 65.5 | 21.11 | 20.82 | 0.29 | |
| All trees | 2048 | 1721 | 84.0 | 17.17 | 16.55 | 0.62 | |
| Pine | Superior trees | 437 | 418 | 95.7 | 13.90 | 13.84 | 0.06 |
| Dominant trees | 678 | 651 | 96.0 | 15.67 | 15.55 | 0.12 | |
| Sheltered trees | 347 | 310 | 89.3 | 22.09 | 22.18 | -0.09 | |
| All | 1462 | 1379 | 94.3 | 16.67 | 16.52 | 0.15 | |
| Spruce | Superior trees | 72 | 63 | 87.5 | 14.65 | 14.92 | -0.27 |
| Dominant trees | 99 | 72 | 72.7 | 17.37 | 17.36 | 0.01 | |
| Sheltered trees | 293 | 112 | 38.2 | 20.43 | 17.81 | 2.62 | |
| All | 464 | 247 | 53.2 | 18.88 | 16.94 | 1.94 | |
| Birch | Superior trees | 39 | 38 | 97.4 | 16.79 | 16.58 | 0.21 |
| Dominant trees | 42 | 33 | 78.6 | 15.60 | 14.24 | 1.36 | |
| Sheltered trees | 41 | 24 | 58.5 | 17.68 | 17.29 | 0.39 | |
| All | 122 | 95 | 77.9 | 16.68 | 15.95 | 0.73 | |
As the majority of trees analyzed were located in stands that were predominantly pine, the average defoliation values were computed just for the sample plots in the pine stands. Only the defoliations predicted using image data from whole crown projection were used for subsequent analysis. The correlation coefficients between plot-wise average values of field estimated and predicted defoliations were around 0.8 (Tab. 3). The root mean square error at a sample plot level was around 3.7% regardless of the type of image transformation used. The average defoliation in the field was 15.49 %. The absolute value of bias dropped when the NDVI-transformed image was used as the auxiliary data set to predict crown defoliation. Prediction root mean square errors were lower (5-10) than those observed within the frames of previous research in the same study area that mapped sample plot level defoliation using multiple regression and numerous panchromatic aerial images, SPOT XS and GIS database variables ([1]) and was compatible with the errors achieved using small format color infrared aerial images taken from ultra-light aircraft (2-5), but with a much smaller number of sample plots ([21]).
Tab. 3 - Accuracies for defoliation prediction at the sample plot level.
| Validation statistic | Type of image transformation | ||
|---|---|---|---|
| Original image |
Principal components |
Normalized difference vegetation index |
|
| Bias | -0.549 | -0.426 | 0.263 |
| Root mean square error | 3.75 | 3.77 | 3.75 |
| Correlation coefficient | 0.803 | 0.799 | 0.795 |
Conclusions
The main conclusions of the research, aimed to investigate the opportunities for using the color-infrared orthophoto maps to predict tree crown defoliation at the single tree and sample plot levels, presented in this paper were:
- Around 84 % of trees were identified on the conventional Lithuanian stand-wise forest inventory using color-infrared orthophoto maps with a ground sampling density of 50 cm. Average tree defoliation, as detected on the images, was 0.6% lower than the value of all the trees in the sample plots.
- Individual crown level defoliations were usually underestimated using the k-nearest neighbor non-parametric prediction technique using color-infrared orthophoto map image characteristics as the auxiliary variables. The lowest root mean square error for predicted tree crown defoliation achieved for pine trees was 7.564, 9.166 for spruce and 7.712 for birch, and the highest coefficients of correlation between field estimated and predicted crown defoliations were 0.576, 0.600 and 0.386, respectively. All were achieved using different prediction methods. Prediction bias was lowest and statistically insignificant when NDVI-transformed images were used as the auxiliary variables.
- The defoliation prediction root mean square error at the sample plot level was around 3.7%, the bias was statistically not significant and the correlation coefficients between plot-wise average values of field estimated and predicted defoliations were around 0.8 in stands that were predominantly made up of pine trees. This suggests that color-infrared orthophoto maps may be a potential data source of forest health characteristics for use in stand-wise forest inventories.
Acknowledgment
The study was carried out within the framework of the National Project No. VP1-3.1-ŠMM-08-K-01-025: “Specific, genetic diversity and sustainable development of Scots pine forest to mitigate the negative effects of increased human pressure and climate change”, supported by the EU Social Fund.
References
Gscholar
Gscholar
Gscholar
Gscholar
Gscholar
Gscholar
Gscholar
Gscholar
Gscholar
Gscholar
Gscholar
Gscholar
Gscholar
Gscholar
Gscholar
Gscholar
Gscholar
Gscholar
Gscholar
Gscholar
Gscholar
Gscholar
Gscholar
Authors’ Info
Authors’ Affiliation
Laboratory of Geomatics, Institute of Land Management and Geomatics, Aleksandras Stulginskis University, Studentu 11, LT-53361 Akademija, Kaunas distr. (Lithuania)
Laboratory of Forest Monitoring, Institute of Forest Management and Wood Science, Aleksandras Stulginskis University, Studentu 11, LT-53361 Akademija, Kaunas distr. (Lithuania)
Institute Forest Management and Wood Science, Aleksandras Stulginskis University, Studentu 11, LT-53361 Akademija, Kaunas distr. (Lithuania)
Corresponding author
Paper Info
Citation
Eigirdas M, Augustaitis A, Mozgeris G (2013). Predicting tree crown defoliation using color-infrared orthophoto maps. iForest 6: 23-29. - doi: 10.3832/ifor0721-006
Academic Editor
Alberto Santini
Paper history
Received: Jul 31, 2012
Accepted: Nov 19, 2012
First online: Jan 14, 2013
Publication Date: Feb 05, 2013
Publication Time: 1.87 months
Copyright Information
© SISEF - The Italian Society of Silviculture and Forest Ecology 2013
Open Access
This article is distributed under the terms of the Creative Commons Attribution-Non Commercial 4.0 International (https://creativecommons.org/licenses/by-nc/4.0/), which permits unrestricted use, distribution, and reproduction in any medium, provided you give appropriate credit to the original author(s) and the source, provide a link to the Creative Commons license, and indicate if changes were made.

Web Metrics
Breakdown by View Type
Article Usage
Total Article Views: 57745
(from publication date up to now)
Breakdown by View Type
HTML Page Views: 48148
Abstract Page Views: 3486
PDF Downloads: 4497
Citation/Reference Downloads: 20
XML Downloads: 1594
Web Metrics
Days since publication: 4932
Overall contacts: 57745
Avg. contacts per week: 81.96
Article Citations
Article citations are based on data periodically collected from the Clarivate Web of Science web site
(last update: Mar 2025)
Total number of cites (since 2013): 5
Average cites per year: 0.38
Publication Metrics
by Dimensions ©
Articles citing this article
List of the papers citing this article based on CrossRef Cited-by.
Related Contents
iForest Similar Articles
Research Articles
Estimating crown defoliation of Scots pine (Pinus sylvestris L.) trees using small format digital aerial images
vol. 6, pp. 15-22 (online: 14 January 2013)
Review Papers
Monitoring the effects of air pollution on forest condition in Europe: is crown defoliation an adequate indicator?
vol. 3, pp. 86-88 (online: 15 July 2010)
Research Articles
Extreme climatic events, biotic interactions and species-specific responses drive tree crown defoliation and mortality in Italian forests
vol. 17, pp. 300-308 (online: 30 September 2024)
Research Articles
First results of a nation-wide systematic forest condition survey in Turkey
vol. 4, pp. 145-149 (online: 01 June 2011)
Research Articles
A fast screening approach for genetic tolerance to air pollution in Scots pine field tests
vol. 6, pp. 262-267 (online: 01 July 2013)
Research Articles
Long-term monitoring of air pollution effects on selected forest ecosystems in the Bucegi-Piatra Craiului and Retezat Mountains, southern Carpathians (Romania)
vol. 4, pp. 49-60 (online: 05 April 2011)
Research Articles
Influence of climate on tree health evaluated by defoliation in the ICP level I network (Romania)
vol. 10, pp. 554-560 (online: 05 May 2017)
Research Articles
Rapid assessment of wind storm-caused forest damage using satellite images and stand-wise forest inventory data
vol. 6, pp. 150-155 (online: 08 April 2013)
Research Articles
The patterns of nearest neighbor trees in a temperate forest
vol. 15, pp. 315-321 (online: 23 August 2022)
Technical Reports
Air pollution regulations in Turkey and harmonization with the EU legislation
vol. 4, pp. 181-185 (online: 11 August 2011)
iForest Database Search
Search By Author
Search By Keyword
Google Scholar Search
Citing Articles
Search By Author
Search By Keywords
PubMed Search
Search By Author
Search By Keyword


