Scale dependency of the effects of landscape structure and stand age on species richness and aboveground biomass of tropical dry forests
iForest - Biogeosciences and Forestry, Volume 16, Issue 4, Pages 234-242 (2023)
doi: https://doi.org/10.3832/ifor4239-016
Published: Aug 23, 2023 - Copyright © 2023 SISEF
Research Articles
Abstract
The structure and diversity of plant communities respond to changes in landscape structure and vary with spatial scale, stand age and plant size. Therefore, it is important to identify the scale (grain size and extent) at which secondary forest attributes of large and/or small plants and landscape structure are more closely associated. We performed multi-scale analyses in which different grain sizes and extents were assessed to determine the most appropriate spatial scale for assessing the association of large/small tree aboveground biomass and species richness with successional age and landscape structure using regression analysis. AGB and species richness were more strongly associated with landscape structure when large grain sizes (500 m2) were used, with R2 values between 0.31 and 0.43. Variation in AGB and species richness was explained primarily by successional age and landscape structure, respectively. At large extents, successional age was related to the AGB of large trees (R2 = 0.43); at intermediate extents, landscape structure was related to the species richness of large trees (R2 = 0.31). The approach and results of this study may facilitate the identification of appropriate areas and scales for the maintenance or restoration of tree diversity, carbon storage, and the provision of ecosystem services in tropical dry forests.
Keywords
Scale Effect, Grain, Spatial Extent, Multi-scale Analysis, Secondary Succession, Landscape Metrics.
Introduction
Tropical dry forests (TDF) are one of the most extensive ecosystems on earth, covering about 40% of the tropical forests of the world ([39]). They provide a variety of important ecosystem services, such as climate change mitigation and regulation of biogeochemical cycles ([36]). TDF are considered the most threatened and deforested forests worldwide due to their intense exploitation and transformation over hundreds of years from different types of natural and anthropogenic disturbances ([39]). However, when the disturbance ceases, forests are generally able to regenerate naturally and recover their structure, diversity, and composition of tree species to the pre-disturbance state through secondary succession, which in turn contributes to recovering the ecosystem services provided by these forests ([9]). Since secondary forest succession takes several decades, chronosequence or time for space substitution in a landscape is the most widely used method of studying this process ([9]). Several studies have documented the effect of successional age on vegetation structure and species diversity in TDF ([14], [13], [38]). However, few studies have evaluated how this effect varies according to plant size ([44]). This is important because large plants are generally better at competing for and exploiting limiting resources ([13]), making up the forest canopy and contributing disproportionately to the recovery of aboveground biomass (AGB) during succession ([14]). On the other hand, small plants are vital for the regeneration of tropical forests due to their high recruitment and turnover rates ([32]) and contribute more than large plants to the recovery of species diversity during succession, due to their higher density and distinct micro-environmental conditions in the understory ([14]).
The frequency, intensity, and extent of disturbances, both natural (hurricanes, tree-fall gaps) and anthropic (land-use changes) determine the structure of the landscape, in terms of both composition, that is the types of land cover (patches of different successional age and vegetation structure/composition), and configuration, that is their spatial distribution. Landscape structure can be described and studied through metrics relating to the number, size, isolation, similarity, or contrast between patches considered individually or grouped by habitat type ([30]). These metrics are suitable predictors of the vegetation structure and diversity attributes of tropical forests ([3], [35]).
Landscape structure is generally assessed using land cover maps of different habitat types, obtained from remotely sensed data ([41]), and depends on the observed scale, i.e., it varies with scale ([3]). In landscape ecology, scale refers to the spatial dimension at which the ecological process of interest occurs. The scale concept involves two fundamental components: grain and extent. Grain is the minimum unit of study, either the size of a plot or a pixel in an image; extent refers to the area covered by the whole study ([49]). The grain should be of sufficient size to capture the variability of the attribute studied and in accordance with the resolution of the satellite imagery used. Large grains (1000 m2 or more) have been reported to capture greater variability in vegetation attributes such as species richness of trees, abundance of individuals, AGB, or basal area ([19]). In contrast, very small grain sizes (tens of m2) cannot capture this variability, thus over- or underestimating the attribute of interest, depending on the local conditions sampled. On the other hand, setting large sampling plots requires a lot of effort and resources, which imposes limits to the size and number of plots established and, therefore, the representativeness of the spatial variation present in heterogeneous landscapes.
The spatial extent of a landscape comprises different land cover classes that serve as habitats for species potentially enhancing species richness ([15]). Different types of habitats covering a wide range of environmental conditions foster the coexistence of different species through niche partitioning ([34]). Similarly, a patchy landscape has been reported to reduce biomass because large trees may suffer high rates of damage and mortality in response to microclimatic changes at patch edges ([24]). This benefits lianas and pioneer species ([28]) which tend to have lower biomass than forest interior trees. The identification of the extent at which these relationships are strongest, known as the scale effect, can be used for landscape management, as species respond differently to landscape conditions ([29]).
The effects of scale on the relationship between landscape structure and different vegetation attributes have generally been studied considering only one component of scale. Some studies have evaluated this effect by varying the grain size in a given extent ([45], [26]), while others have used different extents for the same grain size ([11]). The present study is pioneer in evaluating both scale dimensions, i.e., considering different grain sizes and spatial extents at the same time. To this end, it is important that landscape structure metrics take into account the different grain sizes of plots since landscape metrics are sensitive to variations in the pixel size of imagery. Therefore, it is necessary to identify an optimal pixel size that best fits the sampling plot size, as this will yield accurate information on landscape metrics ([51]).
In recent years, there has been a growing interest in understanding the influence of landscape structure on vegetation attributes ([31], [35]) and knowing the spatial scale that best captures the association between vegetation attributes and landscape structure. This information can advise adequate strategies and plans for conserving biodiversity and the ecosystem services provided by tropical forests. The TDF of the Yucatan Peninsula have a long history of land cover changes ([46]). As a result, most of the landscape is now a mosaic of a large number of patches of vegetation at different successional stages ([12]), making them an ideal study system to evaluate the effects of stand age and landscape structure on key attributes such as aboveground biomass (AGB) and species richness.
In this study we investigated how landscape structure of patch types of different ages affects forest recovery (biomass and diversity) and evaluated the role of both grain size and spatial extent. The main objective of this study was to identify a spatial scale (grain and extent) that optimizes the relationships of AGB and species richness of small plants (1-5 cm diameter), large plants (>5 cm), and all individuals with landscape structure and forest stand age. We used a multi-scale analysis considering different tree size categories and different grain sizes (50, 200, and 500 m2) across different spatial extents (1, 5 and 10 km2). In terms of the grain size, we predicted that: (1) the largest grain size will yield the strongest associations of AGB and species richness with landscape structure and successional age, since larger grain sizes include greater variability in AGB and can better represent tree species diversity ([45]); (2) in terms of the spatial extent, the relationships of landscape structure with the response variables will vary both between the response variables and between the plant size classes. Plot-level AGB is strongly influenced by the local environmental conditions, such as the occurrence and extent of forest edges and open areas within short distances ([31]). Therefore, (2A) AGB will be more closely associated with landscape structure at small and intermediate spatial extents than at larger ones. Conversely, species richness is strongly influenced by seed dispersal, which can occur at intermediate and long distances and is strongly influenced by landscape-level connectivity ([33]). Therefore, (2B) in general, we expect species richness to be more closely associated with landscape structure at intermediate (5 km2) to large (10 km2) extents. However, we also expect that the relationship between species richness and landscape structure will vary with plant size. In particular, (2C) species richness of large plants will be more strongly associated with landscape structure at larger extents than small plants since large plants have lower densities and therefore require larger extents to adequately capture the variability in their species richness as well as the association of this variable with landscape structure. As for the relative contribution of the independent variables to explain variation in the effect of scale, the main driver of AGB is plant size, which is directly and closely associated with successional age ([38]), while the main driver of species richness is the diversity of habitats and niches, which is mainly associated with environmental heterogeneity ([35]). Therefore, (3) we predict that successional age will be the variable explaining the largest proportion of the variation in AGB, while metrics related to environmental heterogeneity will explain the largest proportion of the variation in species richness.
Materials and methods
Study area
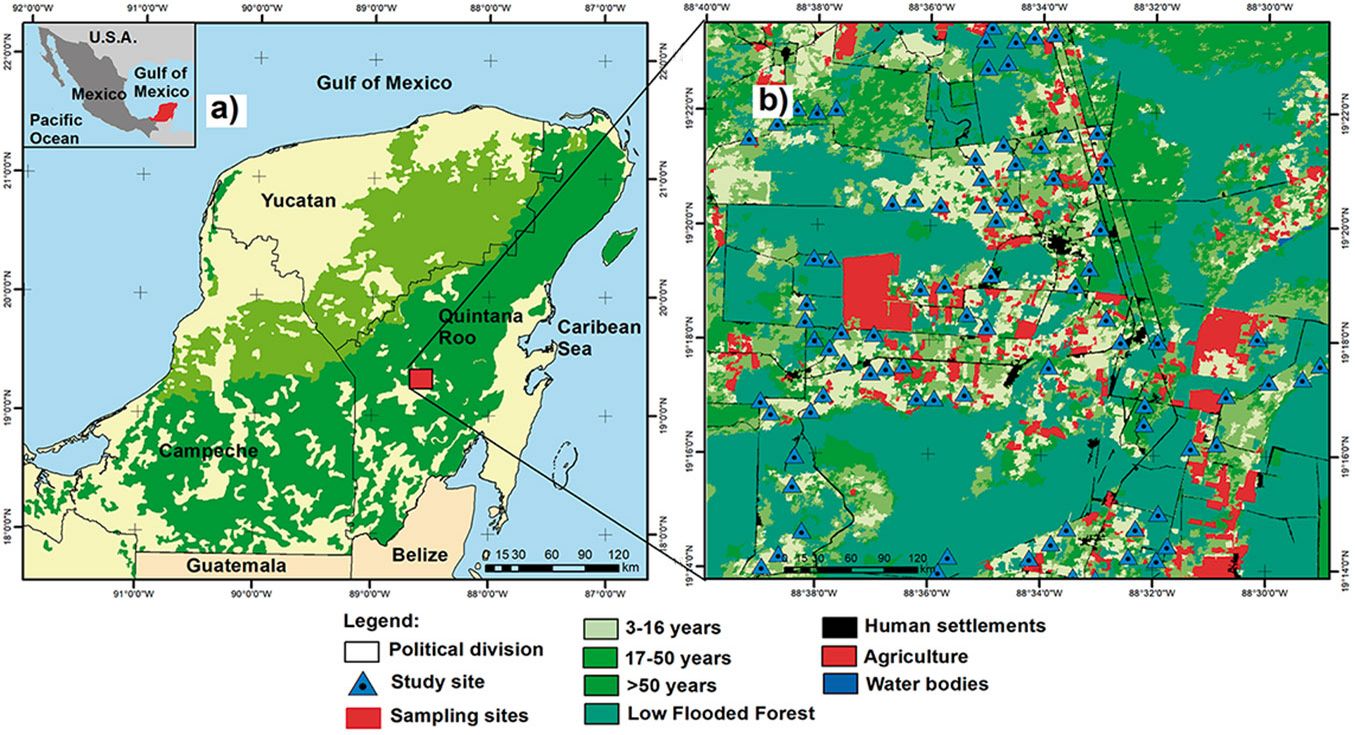
The study area is a landscape dominated by semi-evergreen tropical dry forest located in the Yucatan Peninsula, Mexico (Fig. 1a, Fig. 1b). This site comprises a total area of 351 km2, has a warm sub-humid climate with a dry season from December to May and a rainy season from June to November. The mean annual temperature is 26 °C, and the mean annual precipitation ranges from 1100 mm to 1400 mm. The study area includes forests of different successional ages following the abandonment of cattle grazing and some areas of land previously used for slash-and-burn agriculture. The forest canopy is approximately 15 to 25 m high, and the most abundant tree species include Manilkara zapota (L.) P. Royen (Sapotaceae), Piscidia piscipula (L.) Sarg., and Lonchocarpus rugosus Benth. (Fabaceae), Bursera simaruba (L.) Sarg. and Guettarda combsii Urb. (Rubiaceae), among others ([41]).
Fig. 1 - Location of the landscape studied in the Yucatan Peninsula (a) and map of land cover types including three stand age categories of semi-evergreen tropical dry forest and low flooded forest (b).
Field data collection and calculation of vegetation attributes
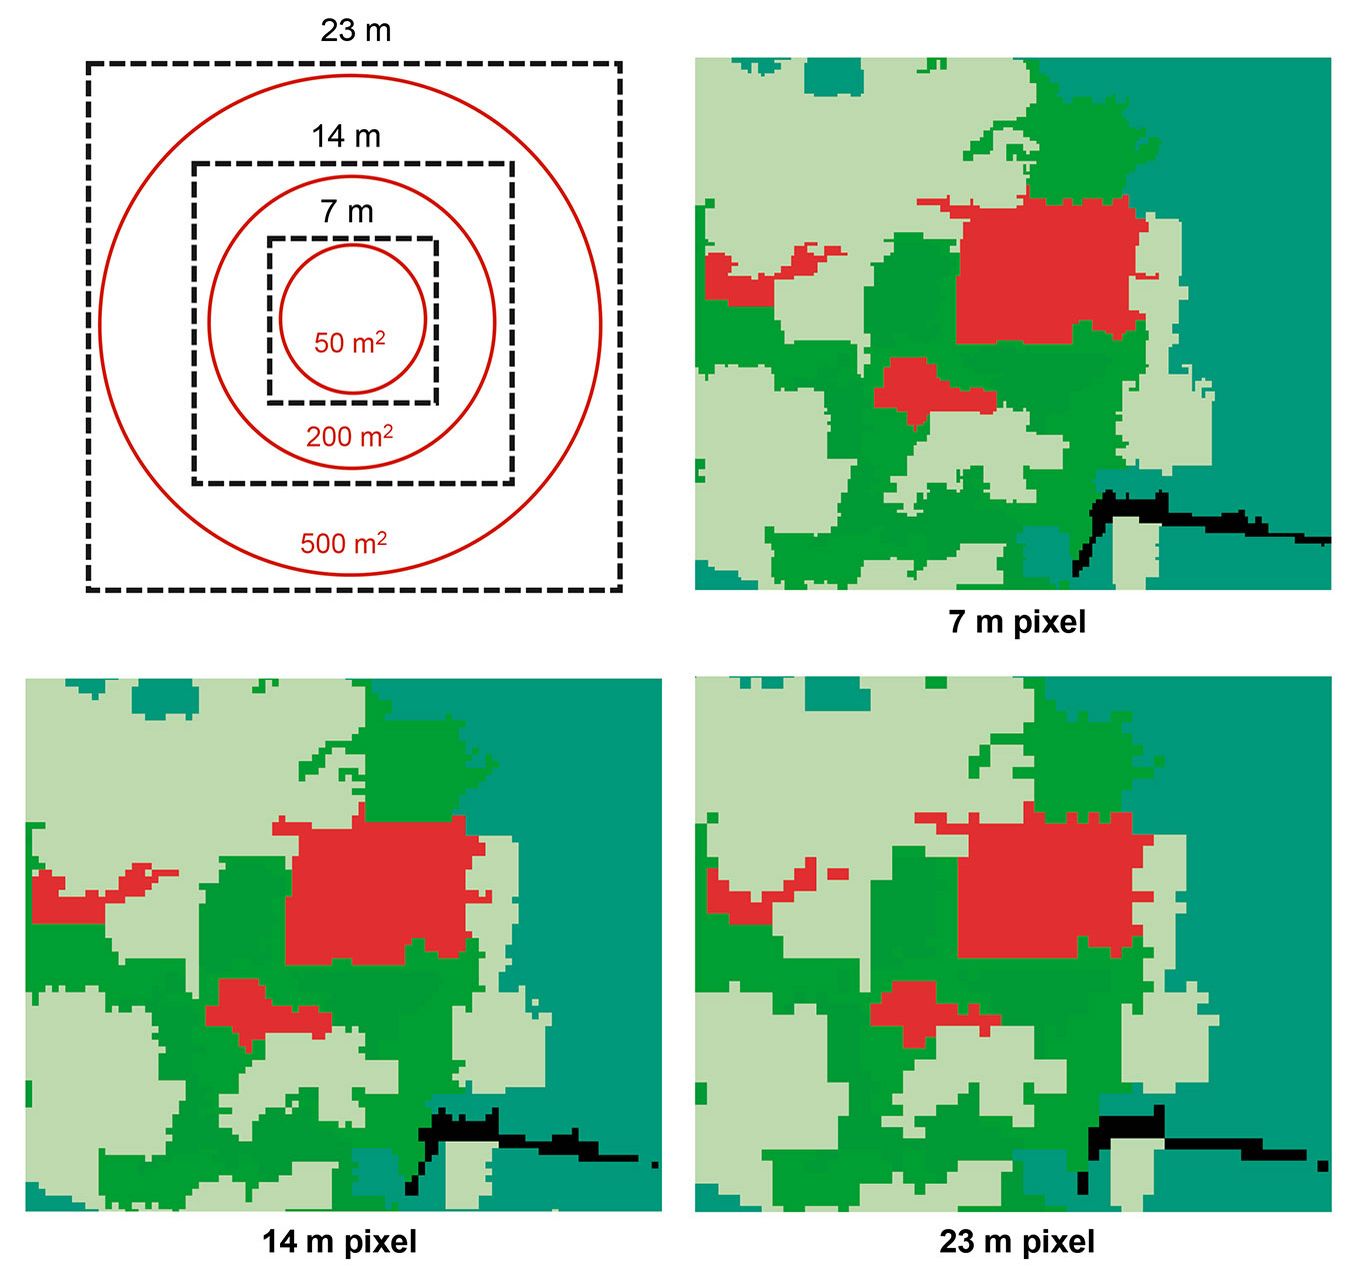
The biomass and tree diversity data were obtained from field data collected during the 2008 and 2009 rainy seasons from 86 sampling units established in a stratified random design ([41]). The sampling plots were set to cover the range of environmental conditions in the landscape, including low flooded forest (LFF) and three stand age categories of semi-evergreen TDF. The sampling units consisted of nested plots including a 500 m2 circular plot with two concentric circular subplots of 200 m2 and 50 m2. In each plot, all trees were identified to species, and the diameter at breast height (DBH, measured at 1.30 m above the ground) and height were measured. In the 500 m2 and 200 m2 plots, all individuals with a DBH greater than 5 cm were recorded; only in the 50 m2 plot, individuals with a DBH between 1 cm and 5 cm were sampled.
The aboveground biomass (AGB) was estimated in Mg ha-1 and the species richness in each 50 m2, 200 m2, and 500 m2 plot was recorded. AGB was estimated using local and regional allometric equations. These equations take into account DBH, height, wood density, and growth form (trees, palm trees, or lianas). The equations used are reported by Chave et al. ([8]) for lianas, Frangi & Lugo ([16]) for palm trees, and Guyot ([17]) and Ramirez et al. ([40]) for trees (see Tab. S1 in Supplementary material). Wood density values of the species used in allometric equations were obtained from previous research conducted in the study area or sites with similar conditions ([20]). The vegetation attributes (AGB and species richness) were calculated for three different plant-size categories: small trees (DBH between 1 cm and 5 cm), large trees (DBH >5 cm) and all sizes (small plus large trees).
Since small trees were not measured in the 200 m2 and 500 m2 grain sizes, we used the information from 50 m2 plots to calculate a correction factor for the AGB estimated for the 200 m2 and 500 m2 grain sizes. For species richness, the number of individuals expected in the 200 m2 and 500 m2 plots was estimated, and richness values were estimated using individual-based rarefaction curves with interpolation and extrapolation. These curves were constructed using the iNEXT package in R ([21]).
Calculation of landscape structure metrics
Landscape structure metrics were obtained from a categorical map of the different land cover classes representing patches of semi-deciduous TDF at different successional stages, LFF, and other land covers (Fig. 1b). These classes were chosen because: (i) the aim of this study was to know how landscape structure of patch types of different ages affects forest recovery; (ii) the spatial arrangement of habitats at a certain time is the result of past habitat loss and fragmentation; and (iii) this habitat arrangement can reflect the interaction between species and the landscape structure ([50]). The map was constructed using a SPOT-5 imagery with 10 m of spatial resolution, in a two-stage image classification procedure, using segmentation and Random Forests with an accuracy assessment of 91%. For further details about the map classification methods refer to Reyes-Palomeque et al. ([41]).
To assess the effect of grain size and extent on the relationship of AGB and species richness with landscape structure, the pixel size of the land cover map was changed to 7, 14, and 23 m in order to match the different plot sizes used as a grain in this study: 50, 200, and 500 m2 (Fig. 2). To change the pixel size a resampling procedure was performed using the nearest-neighbor algorithm, which assigns a value to each modified pixel from the nearest original pixel. This procedure has the advantage that it preserves the original values. In other words, this resampling method is appropriate for categorical data as it assigns to the output pixel a value corresponding to the value of the nearest pixel in the input raster without modifying it. In this way, each modified pixel will maintain the original land cover type value. This procedure allowed matching the sizes of observation units with pixels in categorical maps, so that the areas covered by 7 m, 14 m, and 23 m pixels would represent approximately 50 m2, 200 m2, and 500 m2 plots, respectively.
Fig. 2 - Categorical land cover maps resampled to obtain an optimal pixel size to analyze the extent and the respective grain size. Solid red lines indicate the size of sampling plots; dotted black lines indicate the corresponding grain size (resampled pixels at the chosen grain).
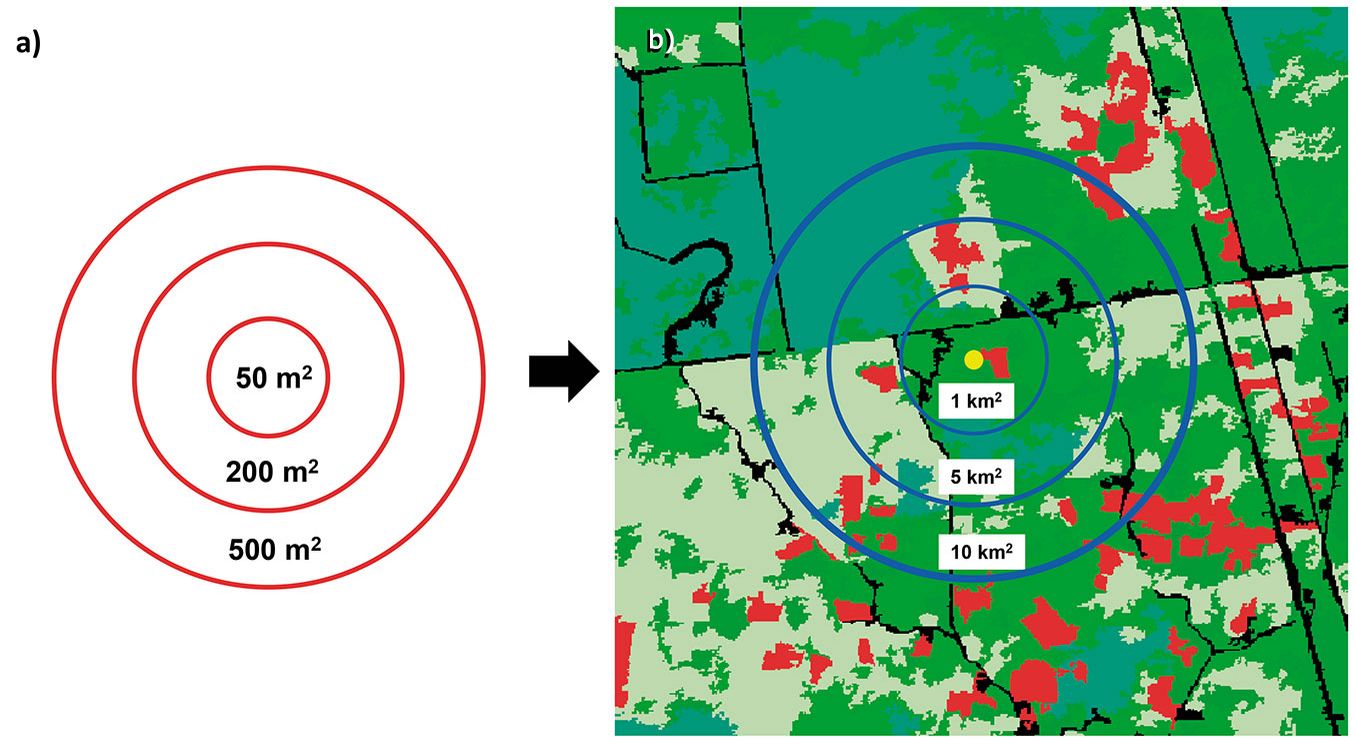
On the other hand, based on previous studies and to evaluate the effect of the extent and include a wide variability of coverages, we considered 3 different extents: 1, 5 and 10 km2 ([3], [35] - Fig. 3).
Fig. 3 - Plot sizes corresponding to the chosen grain sizes and spatial extents considered in this study. Solid red lines indicate grain size (a); solid blue lines mark the different spatial extensions (b).
As most landscape metrics are highly correlated, this study considered indices commonly used in landscape studies and proven to be good predictors of vegetation structure and diversity attributes ([18], [3], [53]). A total of 4 landscape metrics at the class level were selected, which reflect the configuration of a particular patch type and yielded the lowest correlation between them with Pearson’s correlation coefficient ([30]). The FRAGSTATS software version 4.0 was used to calculate the metrics. The selection of the metrics was made considering both metrics commonly used in landscape studies that have proven to be good predictors of vegetation structure and species diversity attributes ([18], [3], [53]), as well as metrics that include different components such as area, number of patches, edge, isolation and contrast. The indices considered in this study were the percentage of habitat as a proportion of each coverage (percentage of landscape - PLAND), patch density (PD), edge density (ED) and total edge contrast index (TECI). For a description and formulas of landscape metrics, refer to Tab. S2 in Supplementary material.
The calculation of the TECI metric requires a contrast matrix. This matrix was constructed using the inverse of the Jaccard similarity index (-1), which assesses the proportion of species that are shared between each pair of vegetation classes. Since landscape metrics are sensitive to the scale considered (grain and extend), instead of calculating a single value of each metric, we obtained the metric for each grain size and extension in order to characterize landscape patterns at different scales ([52]). In total, we analyzed a set of 144 landscape metrics at the class level to obtain metrics associated with each land cover class (forest stand age categories: 3-16 years, 17-50 years, >50 years and LFF). Each set of metrics was calculated in the three extents of interest (1, 5 and 10 km2) using each grain size (7, 14, and 23 m per pixel).
Data analysis
First, the mean AGB and species richness values were calculated for each successional age of the semi-evergreen TDF and the LFF. Then, to assess the relationships between vegetation attributes (AGB and species richness) and landscape structure, multiple linear regression analyses were performed using vegetation attributes as response variables and landscape metrics and stand age as explanatory variables.
Multiple linear regression models were performed for the three plant-size classes (small, large, and all trees) for each grain size (50, 200, and 500 m2) at each extent (1, 5 and 10 km2). This was performed considering the landscape metrics according to the categorical maps resampled for each grain size. Grain sizes and extents were analyzed to explore the effect of the scale of the extracted landscape metrics on the biomass and species richness observed at each scale.
Multiple linear regression models used a subset-based procedure, which selects the best model from several potential sets of non-correlated explanatory variables. This procedure was performed using the “regsubsets” function of the “leaps” package in R ([25]). The best models (considering grain size and extent) were selected based on the coefficient of determination (R2). The coefficient of determination is appropriate to compare different response variables (AGB and species richness) due to its fixed range (from 0 to 1), compared to the Akaike Information Criterion (AIC), the values of which depend among other factors, on the sum of squares of the error of the dependent variable ([5]). We are aware that AIC is an appropriate criterion to select models differing in the number of parameters for one response variable ([5]). However, for all of our comparisons we selected models with the same number of parameters (3).
Data were tested for normality, homoscedasticity, and error independence, and the response variables (AGB and species richness) were transformed to square root (x) to meet the linearity assumption of the data. Additionally, the semi-partial correlation of each explanatory variable was calculated to determine the contribution of each variable to the total variation explained by the regression model.
Results
Estimation of AGB and species richness by grain size
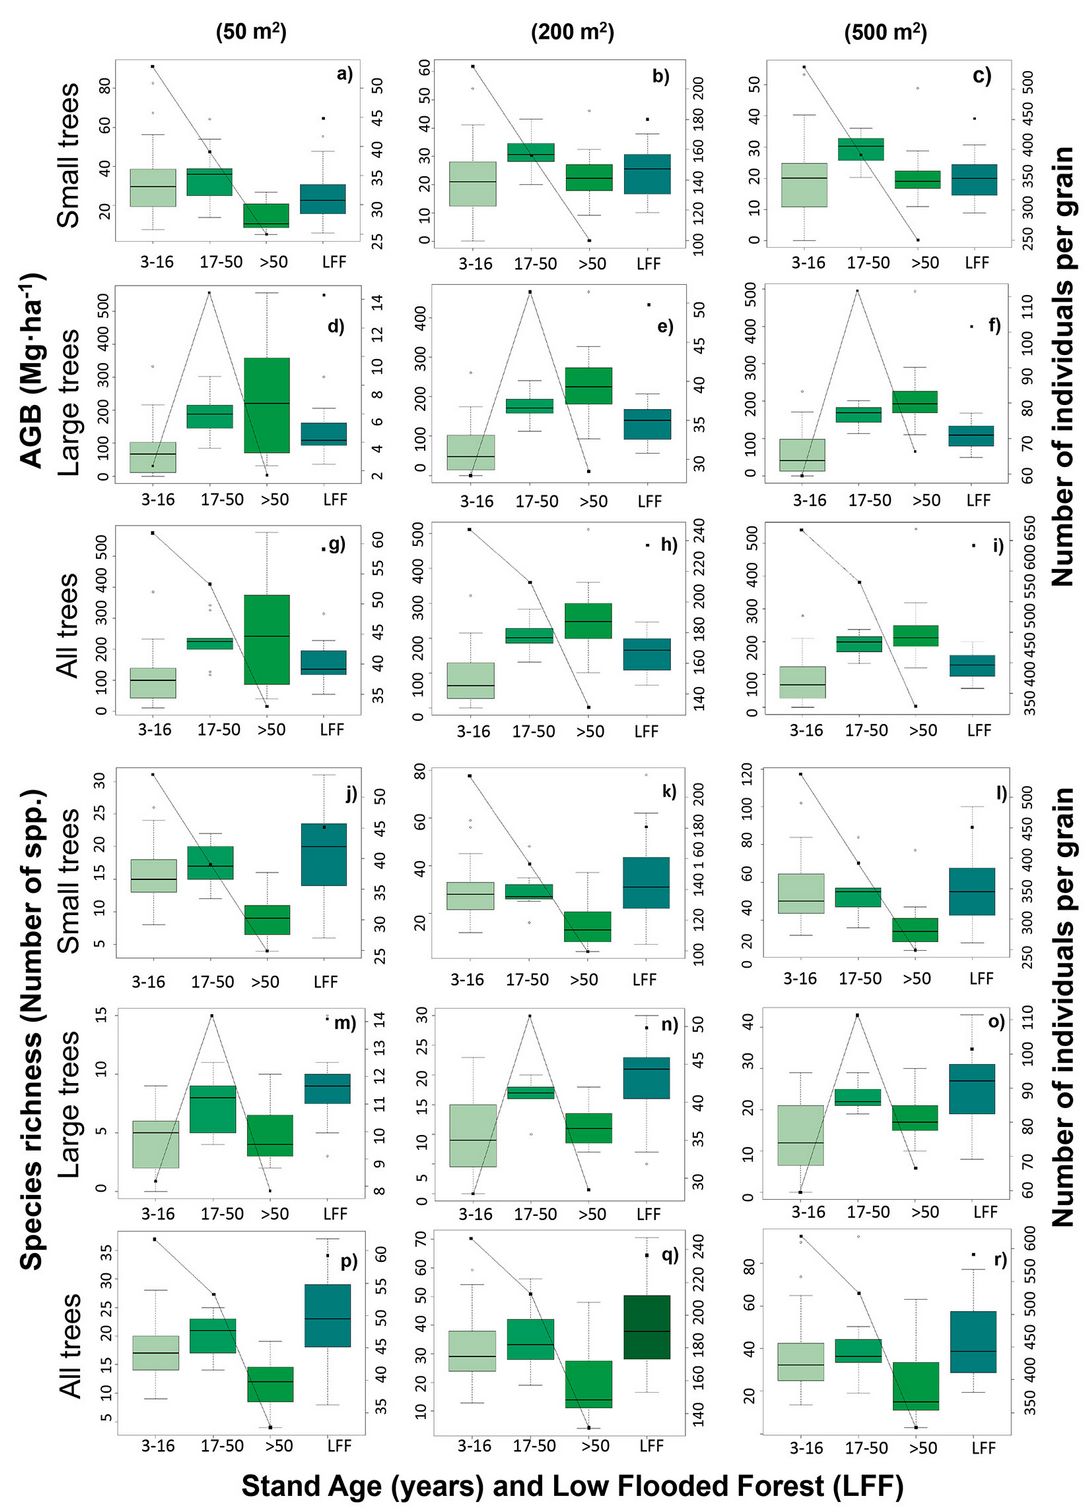
The results obtained from 86 plots for each grain size show that mean AGB values for the three plant-size categories consistently decreased as the grain size increased (Tab. 1, Fig. 2). In contrast, species richness values increased with grain size for the three plant-size categories and were consistently higher for small trees than for large trees (Tab. 1, Fig. 2)
Tab. 1 - Mean values (± standard error) of the AGB density and species richness found for each group (small, large and all trees) and grain size.
| Attributes | Grain size (m2) |
Small trees (Mean ± SE) |
Large trees (Mean ± SE) |
All trees (Mean ± SE) |
|---|---|---|---|---|
| AGB (Mg ha-1) | 50 | 28.94 ± 1.82 | 117.70 ± 11.84 | 146.64 ± 11.78 |
| 200 | 23.11 ± 1.25 | 113.03 ± 9.24 | 136.21 ± 10.49 | |
| 500 | 20.50 ± 1.17 | 100.49 ± 8.63 | 120.99 ± 9.44 | |
| Species richness | 50 | 15 ± 1 | 6 ± 1 | 18 ± 1 |
| 200 | 27 ± 1 | 12 ± 1 | 31 ± 1 | |
| 500 | 33 ± 2 | 18 ± 1 | 37 ± 2 |
Mean species richness peaked at the intermediate successional stage (17 to 50 years), and showed high values in low flooded forests (LFF - Fig. 4). The densities of small trees and all trees decreased with successional age, while the density of large trees tended to increase toward the intermediate successional age (17 to 50 years) and then decreased in the oldest age (>50 years), and showed relatively high values in the flooded forest (Fig. 4).
Fig. 4 - Mean AGB, species richness, and number of trees of large trees, small trees and all individuals in each stand age category and the low flooded forest (LFF) in each grain size. Boxes in the upper and lower three graphs represent AGB and species richness, respectively; solid lines and points indicate the number of individuals, points indicate the number of individuals.
Effects of scale and importance of landscape structure and stand age on AGB and species richness
The regression analyses indicated statistically significant relationships between the dependent variables (AGB and species richness) and the explanatory variables (stand age and landscape metrics) for the different grain sizes and spatial extents analyzed.
The coefficients of determination (R2) were higher for the large grain size (500 m2) considering AGB and species richness (Tab. S3 in Supplementary material). The exception to this pattern was the 50 m2 grain size, which showed a stronger association of landscape structure with AGB and species richness of small and all individuals. Tab. 2 shows the best regression models (those with the highest R2 values) for the different grain sizes and extents.
Tab. 2 - Best multiple linear regression models between response variables (AGB and species richness) and explanatory variables (landscape metrics and age) for different plant-size categories at different grain sizes and spatial extensions. These models were selected considering the coefficient of variation (R2). (*): P < 0.05; (**): P < 0.01; (***): P < 0.001.
| Response variable |
Size of trees |
Grain size (m2) |
Extent (km2) |
Explanatory variables |
β | R 2 | Semipartial correlation (R2) |
|---|---|---|---|---|---|---|---|
| AGB (Mg ha-1) | Small | 50 | 10 | PD_3-16 years* | 0.20 | 0.27 | 0.05 |
| PD_17-50 years *** | -0.58 | 0.22 | |||||
| PLAND_17-50 years *** | 0.51 | 0.18 | |||||
| Large | 500 | 10 | Age forest *** | 0.57 | 0.43 | 0.35 | |
| ED_>50 years ** | 0.26 | 0.11 | |||||
| PLAND_17-50 years ** | 0.23 | 0.08 | |||||
| All | 500 | 10 | Age forest *** | 0.53 | 0.39 | 0.30 | |
| ED_>50 years ** | 0.28 | 0.11 | |||||
| PLAND_17-50 years * | 0.22 | 0.06 | |||||
| Species richness | Small | 50 | 1 | PD_>50 years * | -0.19 | 0.16 | 0.03 |
| PLAND_ LFF * | -0.17 | 0.03 | |||||
| TECI_17-50 years * | 0.22 | 0.04 | |||||
| Large | 500 | 5 | Age forest *** | 0.55 | 0.31 | 0.28 | |
| PLAND_17-50 years ** | 0.30 | 0.10 | |||||
| PLAND_>50 years * | -0.17 | 0.03 | |||||
| All | 50 | 1 | PD_>50 years * | -0.17 | 0.16 | 0.03 | |
| PLAN D_LFF * | -0.15 | 0.02 | |||||
| TECI_17-50 years * | -0.24 | 0.05 |
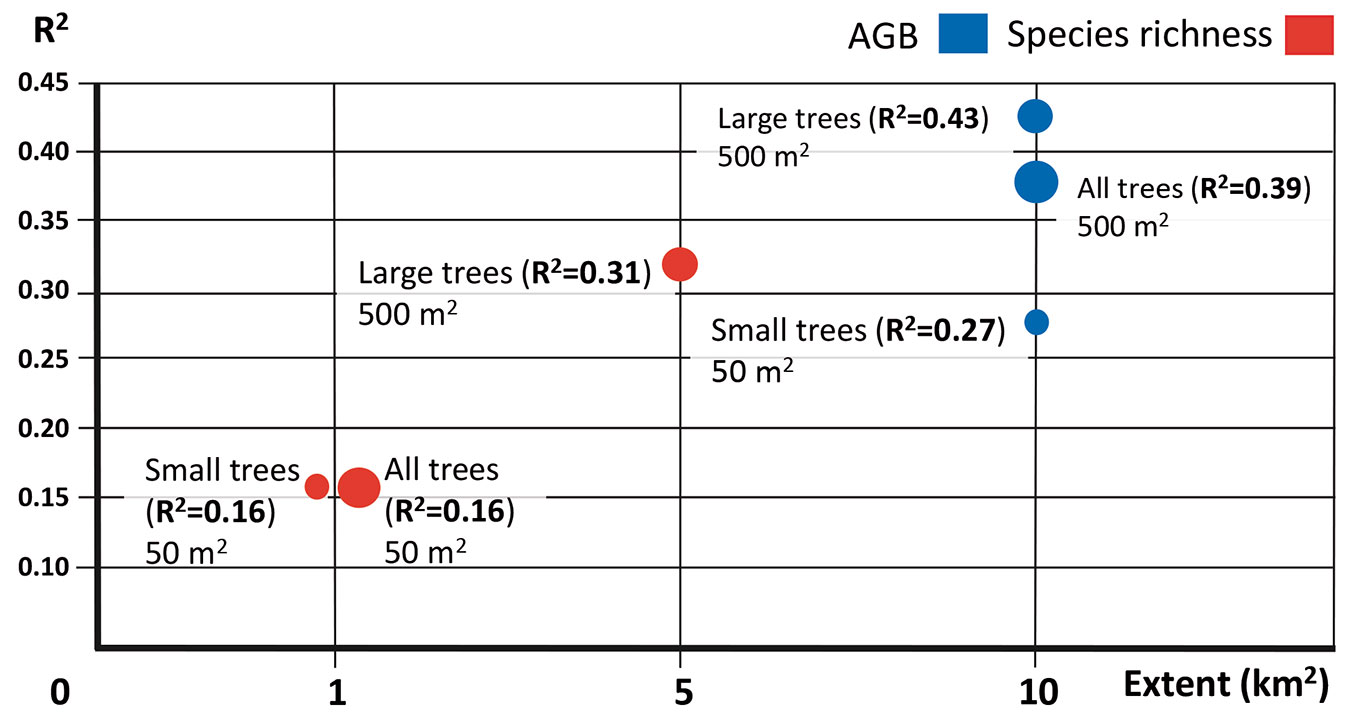
The association between response and explanatory variables differed considerably among the three extents evaluated (Tab. 2, Fig. 5). The AGB of large trees, small trees and all individuals showed the strongest associations with landscape metrics and stand age in the largest extent (10 km2). Species richness of large trees showed the strongest association at an intermediate (5 km2) extent, while for small and all individuals this association occurred at the smallest (1 km2) extent (Fig. 5).
Fig. 5 - Plotted values of R2 vs. extent for the best regression models between the response (AGB and species richness) and explanatory (landscape metrics and successional age) variables for different plant-size categories. These models were selected considering the coefficient of variation (R2).
The best multiple regression models indicated that the biomass of large and all plants was positively related to successional age. This was the variable that contributed most to explaining AGB variability, with a semi-partial correlation of 0.35 and 0.30 for large trees and all size categories, respectively. On the other hand, AGB of all plant size classes responded positively to the increase in percentage of landscape (PLAND) covered by the stand age class 17 to 50 years, indicating that the biomass is positively correlated with the increase in the percentage of landscape covered by intermediate-aged forests (Tab. 2).
The best multiple regression models indicated that species richness of large trees was positively correlated to successional age. However, the percentage of landscape (PLAND) and the patch contrast (TECI) were important metrics to explaining the variability in species richness, with semi-partial correlations of 0.10, 0.05 and 0.04 for large trees, all plant-size categories and small trees, respectively. The species richness of large trees increases when the percentage of landscape (PLAND) of intermediate-aged forest (17 to 50 years) increases. In contrast, the species richness of small trees responded positively to increases in the patch contrast (TECI) of patches aged 17 to 50 years, indicating an increase in species richness of small trees when the patch contrast of intermediate-aged forest is lower (Tab. 2).
Discussion
Finding a spatial scale (grain and extent) that optimizes the relationships of AGB and species richness with landscape structure and successional age may help to indicate the appropriate spatial scale for developing conservation and land-use strategies and identifying landscape configurations that could increase plant diversity, carbon storage or forest regeneration in restoration activities ([35]). We found that the relative contribution of landscape metrics and stand age to explaining variation in AGB and species richness in the TDF studied varied with grain size and extent.
Regarding grain size, the largest plot (500 m2) showed the strongest associations of the explanatory variables with AGB (R2 = 0.43 and 0.39 for large trees and all individuals, respectively) and species richness (R2 = 0.31 for large trees). This finding supports in part our first hypothesis and suggests that large grain sizes allow capturing a greater degree of variability in AGB and species richness, which allows stronger associations of AGB and species richness with landscape structure and stand age. AGB estimates using large grain sizes are more accurate because these sizes better capture the variability in vegetation structure since they include a larger number of trees of different sizes, both small and large ([19], [45]). This minimizes errors in AGB values estimated in the field ([22], [19]), because large trees are rare and have a heterogeneous spatial distribution, so larger plots are more likely to adequately reflect their true frequency.
Our results on species richness also contribute to support in part our first hypothesis. In general, the strongest association between this variable and the explanatory variables corresponded to the largest grain size. This size is probably more representative of the floristic diversity of forests, especially regarding large trees, and thus facilitates the detection of a stronger association. However, the species richness of small trees and all plant-sized individuals showed the opposite behavior, as it was more closely associated with the explanatory variables in the smallest grain size (50 m2, R2 = 0.16, for both classes). This may be due to two reasons. First, small trees tend to show a clumped distribution at small spatial scales. Other studies have reported that it is possible to accurately estimate the species richness of small tree species with small sample units ([45]). Second, small trees were sampled only in the smallest grain and there may be errors in the estimation of their species richness for the other grain sizes using individual-based rarefaction curves.
Soil properties, microclimatic conditions, and biotic interactions play an important role defining which species arrive and establish in regenerating forests at the local (grain size) level ([9]). However, these factors may change at the landscape (extent) level. In landscapes with low levels of (human) disturbance dominated by forest matrices, biomass and species richness are expected to be strongly associated to environmental factors. While in heterogeneous landscapes that have been affect by disturbance, such as in this study, in addition to the environment, vegetation structure and composition will depend on landscape structure and configuration, which affect the dispersion of propagules ([4]).
The results of the present study also support our second overall hypothesis that scale effects will vary according to the dependent variable and the plant size. The effect of extent varied between both attributes evaluated (AGB and species richness) and across plant-size categories (large, small and all trees), as reported in previous studies ([18], [3], [35], [11]). However, we found only partial support for our specific predictions.
Contrary to prediction 2A, we found that AGB of large, small and all plants was most strongly associated with landscape structure and successional age at the largest extent (10 km2). The majority of biomass in tropical forests is stored in large mature trees. Many large trees have a life history characterized by slow growth, which increases their vulnerability to drastic changes in the immediate surrounding environment ([23]). For example, forest fragmentation can reduce biomass along forest edges ([31]), where tree mortality is higher and this edge effect extends from less than 100 m up to 3 km into forest interiors ([24]). Thus the amount of large trees tends to be reduced in the edges of forest fragments generally restricting them to the interior ([24]). However as the area of a patch-type increases, the proportion of interior conditions also increases. In addition, habitat amount is strongly related to habitat configuration, as this may restrict or expand the range of habitat amount, impeding or facilitating the movement of species among patches ([50]). In this study, the intermediate and the oldest stages of succession have a large proportion of the coverage that correspond to the tropical dry forest with larger patches (Fig. 1); this increases interior conditions and may be the reason underlying the strongest associations of AGB with landscape structure occurred at the largest extension. On the other hand, small plants are particularly abundant in early successional stages, which tend to be dominated by pioneer species with high capacity to disperse their seeds over long distances and rapidly colonize, grow and reproduce in open areas. This could help explain why the closest associations of AGB of small trees with landscape metrics also occurred at a largest extent.
The results of the associations of species richness with landscape structure generally support our specific predictions 2B and 2C. Species richness of large plants was most strongly associated with landscape structure at intermediate extents (5 km2) compared to small and all plant-sized individuals (1 km2 in both cases). Different studies have reported that the association between species richness of different plant sizes and landscape structure varies across landscape extents ([18], [3]). The variation in the effect of scale on species richness may be due to the relationship between tree size and density. For example, large trees have low density values, so large to intermediate extents are required to adequately capture the variability in their species richness (and, therefore, the association of this variable with landscape structure). Conversely, small trees have higher density values and all plants have even higher density, so the variation in species richness can be captured in small extents.
Stand age was the most important variable explaining variation in AGB of large trees and all individuals. This finding supports our third hypothesis and suggests that stand age strongly influences biomass accumulation as shown by different studies ([18], [27]). Our results suggest that AGB recovers rapidly with time after abandonment, reaching similar values in the 17-50 years and >50 years age classes. A rapid AGB recovery in Neotropical forests has been reported ([38]). In addition, our results confirm the central role of large trees in the accumulation of AGB in the forests studied (Fig. 4d-i), as it has also been reported for forest functioning and ecosystem services in general ([2]). Large trees regulate resources such as light, water, and mineral nutrients, influence the growth of small- and medium-sized trees and provide habitats for many other species ([1]).
On the other hand, species richness was more closely associated with landscape structure than with successional age; this finding supports our third hypothesis and is consistent with previous studies ([18], [3], [35]). Landscape structure is a central factor in explaining plant species diversity at local and regional scales ([42]). This is because the diversity of habitats and niches, which can be captured by landscape metrics of environmental heterogeneity, is the key driver of species richness ([35]).
In relation to low flooded forests areas, the results of the present study indicate this land cover type has relatively low values of AGB but high values of species richness. In flooded forests, periodic flooding during the rainy season represents an additional stress to dry-season drought ([6]), especially for large trees, which may explain the low AGB values found in these forests. Most of these forests have not been converted to other land uses, so they must be mature forests. However, the high species richness is surprising given the particularly stressful conditions faced by plants inhabiting flooded forests, suggesting that several species have developed adaptations to these conditions. These results also indicate the importance of these forests, which cover the largest proportion of the study area, being distinctive of the Yucatan Peninsula and essential for biodiversity conservation ([37]).
Low flooded forests are considered key habitats for various species because their proximity to non-flooded forests favors the seasonal provision of fruits to a large number of animals ([43]), and due to their distinct floristic composition and phenology ([7]). Few studies have described the structure and floristic diversity of low flooded forests ([10]). However, their characteristics and spatial distribution in the Yucatán Peninsula endow them with a high conservation value. Therefore, low flooded forests should also be evaluated and considered in conservation and management plans ([43]).
Finally, one of the important factors influencing the effect of grain size and extent on vegetation attributes that is rarely considered in landscape ecology studies is the pixel size of images. The pixel size of a classified map plays a central role in quantifying landscape structure because landscape metrics are sensitive to the spatial variation of pixels in the categorical maps from which they are extracted ([48], [51]). Therefore, to effectively capture the effect of landscape structure, it is also necessary to evaluate the most appropriate pixel size ([47]). To the best of our knowledge, this is the first study to jointly analyze the effects of the two components of spatial scale (grain size and extent) on the associations of AGB and tree species richness with landscape structure, which required resampling the pixel size of the classification map to match the grain size.
Conclusions
This study shows that the effects of landscape structure and successional age on aboveground biomass and the species richness of tree species in the TDF studied depend on scale. The AGB of TDF responds to factors largely associated with successional age at large grain sizes (500 m2) and at large extents (10 km2). This demonstrates the strong influence of successional age at these spatial scales on the recovery of AGB in landscapes previously used for traditional agriculture and that contain vegetation patches of different stand ages. On the other hand, species richness seems to be more strongly influenced by landscape structure at small and large grain sizes at small and intermediate extents, depending on the size of the trees and their density. Larger trees have lower tree densities so landscape structure is most closely associated with species richness at intermediate and maybe larger extents. These results highlight the importance of evaluating the effect of both components of scale for each vegetation attribute considering different plant-size categories.
The high deforestation and fragmentation rates of tropical forests involve changes in the landscape structure and successional age of vegetation. In turn, these affect the structure and diversity of forests and their capacity to provide ecosystem services, including the mitigation of climate change through the sequestration of atmospheric CO2 in forest biomass and various services associated with biodiversity. Understanding the grain size and extent at which landscape structure and successional age are most closely associated with key vegetation attributes is essential for proposing conservation, sustainable use, restoration activities or management strategies to increase the biodiversity and maintain the provision of environmental services at the landscape level.
Finally, the present study stresses the importance of multi-scale analyses as a tool for assessing the relationships between landscape structure and vegetation attributes to select the most appropriate scale for each attribute, according to the plant size category considered. This requires adjusting the spatial resolution or pixel size of categorical maps to match the sample size or plots to effectively capture the landscape metrics.
Acknowledgments
We thank the Ejido of José Maria Morelos for allowing us to work in their lands and for their assistance with field work. The study was financially supported by CICY and FOMIX-Yucatán (project no. 108863). Finally, we thank María Elena Sánchez, who translated the manuscript into English.
References
CrossRef | Gscholar
Gscholar
Gscholar
CrossRef | Gscholar
Gscholar
CrossRef | Gscholar
CrossRef | Gscholar
CrossRef | Gscholar
Gscholar
CrossRef | Gscholar
Authors’ Info
Authors’ Affiliation
Juan Manuel Dupuy 0000-0001-7491-6837
José Luis Andrade 0000-0002-4991-5020
Fernando J Tun-Dzul 0009-0003-2749-6843
José Luis Hernández-Stefanoni 0000-0002-9559-7131
Centro de Investigación Científica de Yucatán A.C., Unidad de Recursos Naturales, Calle 43 # 130, Colonia Chuburná de Hidalgo, 97205 Mérida, Yucatán (Mexico)
Geospatial Technologies Laboratory, Department of Natural Resources Management, Texas Tech University, Box 42125, Lubbock, TX 79409-2125 (USA)
Corresponding author
Paper Info
Citation
Reyes-Palomeque G, Dupuy JM, Portillo-Quintero CA, Andrade JL, Tun-Dzul FJ, Hernández-Stefanoni JL (2023). Scale dependency of the effects of landscape structure and stand age on species richness and aboveground biomass of tropical dry forests. iForest 16: 234-242. - doi: 10.3832/ifor4239-016
Academic Editor
Paola Mairota
Paper history
Received: Oct 12, 2022
Accepted: Jun 26, 2023
First online: Aug 23, 2023
Publication Date: Aug 31, 2023
Publication Time: 1.93 months
Copyright Information
© SISEF - The Italian Society of Silviculture and Forest Ecology 2023
Open Access
This article is distributed under the terms of the Creative Commons Attribution-Non Commercial 4.0 International (https://creativecommons.org/licenses/by-nc/4.0/), which permits unrestricted use, distribution, and reproduction in any medium, provided you give appropriate credit to the original author(s) and the source, provide a link to the Creative Commons license, and indicate if changes were made.

Web Metrics
Breakdown by View Type
Article Usage
Total Article Views: 7292
(from publication date up to now)
Breakdown by View Type
HTML Page Views: 6241
Abstract Page Views: 532
PDF Downloads: 450
Citation/Reference Downloads: 0
XML Downloads: 69
Web Metrics
Days since publication: 248
Overall contacts: 7292
Avg. contacts per week: 205.82
Article Citations
Article citations are based on data periodically collected from the Clarivate Web of Science web site
(last update: Feb 2023)
(No citations were found up to date. Please come back later)
Publication Metrics
by Dimensions ©
Articles citing this article
List of the papers citing this article based on CrossRef Cited-by.
Related Contents
iForest Similar Articles
Research Articles
Communicating spatial planning decisions at the landscape and farm level with landscape visualization
vol. 7, pp. 434-442 (online: 19 May 2014)
Research Articles
Evaluation of urban forest landscape health: a case study of the Nanguo Peach Garden, China
vol. 13, pp. 175-184 (online: 02 May 2020)
Research Articles
The concept of green infrastructure and urban landscape planning: a challenge for urban forestry planning in Belgrade, Serbia
vol. 11, pp. 491-498 (online: 18 July 2018)
Review Papers
Large-scale effects of forest management in Mediterranean landscapes of Europe
vol. 6, pp. 342-346 (online: 29 August 2013)
Research Articles
Fragmentation of Araucaria araucana forests in Chile: quantification and correlation with structural variables
vol. 9, pp. 244-252 (online: 28 August 2015)
Research Articles
Fire occurrence zoning from local to global scale in the European Mediterranean basin: implications for multi-scale fire management and policy
vol. 9, pp. 195-204 (online: 12 November 2015)
Short Communications
The Polish landscape changing due to forest policy and forest management
vol. 2, pp. 140-142 (online: 30 July 2009)
Research Articles
How do urban dwellers react to potential landscape changes in recreation areas? A case study with particular focus on the introduction of dendromass in the Hamburg Metropolitan Region
vol. 7, pp. 423-433 (online: 19 May 2014)
Research Articles
Monitoring spatial and temporal pattern of Paneveggio forest (northern Italy) from 1859 to 2006
vol. 3, pp. 72-80 (online: 17 May 2010)
Editorials
Adaptation of forest landscape to environmental changes
vol. 2, pp. 127 (online: 30 July 2009)
iForest Database Search
Google Scholar Search
Citing Articles
Search By Author
Search By Keywords
PubMed Search
Search By Author
Search By Keyword


