Communicating spatial planning decisions at the landscape and farm level with landscape visualization
iForest - Biogeosciences and Forestry, Volume 7, Issue 6, Pages 434-442 (2014)
doi: https://doi.org/10.3832/ifor1175-007
Published: May 19, 2014 - Copyright © 2014 SISEF
Research Articles
Collection/Special Issue: RegioResources21
Spatial information and participation of socio-ecological systems: experiences, tools and lessons learned for land-use planning
Guest Editors: Daniele La Rosa, Carsten Lorz, Hannes Jochen König, Christine Fürst
Abstract
Landscape visualizations have the potential to support participatory environmental planning at different spatial scales and decision levels from international to farm level. However, it is yet unclear what specific demands are relevant for visualization on the different decision levels. In this context more knowledge is needed about visualization objectives and the respective tasks, intended effects and suitable techniques for the specific levels. Especially the farm level has been neglected in research, although farmers make many decisions that affects public interests in the visual landscape. Farmers need to communicate these decisions to the public in an understandable way. The question of how visualization can support participation in the planning process at the municipal level is examined in this paper by drawing on the findings of the Interactive Landscape Plan Koenigslutter, Germany (IALP) about the preferences and reactions of citizens to visualizations used in the landscape planning process at the local decision level. On this basis, we examined the applicability and differences of the findings for the farm level. Furthermore, in order to explore visualization opportunities at the farm scale, the farm management system MANUELA was used as an example of an information platform that could serve as a basis for farm scale visualizations. By transferring landscape planning results to the farm level, we developed recommentations about the application of visualization, intended effects and appropriate techniques at the farm scale. The general findings for the municipal level show that visualization can improve participation by providing participants with a common image of the planning proposals for discussion and collaborative decisions. Different visualization methods offer different capabilities for supporting participation in the different planning phases. At the farm scale, 2D visualizations and diagrams are often sufficient to communicate information to customers about farm performance for providing ecosystem services. They may consist of maps and supporting information that is easily generated from GIS data. However, for a higher (more interactive) level of communication and participation activities, such as discussions with affected neighbors about land use changes or the integration of citizens’ proposals, more sophisticated visualization techniques would be required. Visualization techniques are needed that farmers can use to easily simulate visual impacts of land use changes at the landscape scale.
Keywords
Landscape Planning, Participatory Planning, Landscape Visualization, Farm Scale, Ecosystem Services, MANUELA
Introduction
Visualizations are major means of communicating ecological information to the public and stakeholders. Much research has been done about visualization techniques and their effect on addressees. Landscape visualizations have been used successfully to communicate landscape issues and discuss planning decisions with experts, stakeholders and the general public ([32], [38], [17], [27]). Although skeptics warn of the danger of manipulation and the over emphasis of the visual landscape ([10], [31], [21], [34]), landscape visualizations have proven to be effective in participatory planning at many different planning scales (see [22] for an overview). Certainly, landscape visualizations have limitations; however they present a common image which stimulates opinions and helps participants to formulate and question their own opinions ([20]). Nonetheless, very little is known on how to choose the right visualization type according to the application purpose and the level of political decision in environmental issues. Decisions that require participation are not only made on the political or administrative level but also on the farm scale, where many decisions have an impact on the visual landscape and therefore effect the wider public. For example, planning farm infrastructure, such as windmills, solar panels, buildings for livestock, or farm roads, may impact the visual landscape which is enjoyed by the public. Even the conversion of grassland into agricultural fields or changes in the cropping systems from short to tall crops, such as maize to short rotation coppice, are relevant for people on a supra farm level. Furthermore, neighbors, farm customers (e.g., food companies, tourists, customers of farm sale), and authorities that decide about agri-environmental funding now require more information about farm performance and respective ecosystem services (ESS - [39]). Many of these new communication and participation tasks on the farm level can be supported by visualization.
Visualization methods offer many different capabilities and choices for presenting landscape information. The landscape can be portrayed in two, three or four dimensions or visualized with varying degrees of realism ([15], [7]). The image may be static or dynamic and provide different levels of interactivity ([26]). Also the scale in which the landscape is visualized emphasizes different aspects and issues of the landscape ([20]). Even the style of the visualization (i.e., stylized or realistic/detailed) influences how it can be used in planning decisions ([27]). Furthermore, the choice of visualization methods is influenced by contextual factors such as data availability and quality, audience, size of planning area, planning issues, and the phase of the planning process ([42]). In addition, the various scales of the planning decisions (global, national, state, regional, local, site) hold different questions and thus require different visualization tools ([29]).
Despite the promise that visualization holds for supporting participation and the many technical options that are available, a systematic overview of the relevant requirements for visualization on the different decision levels is missing. In order to choose a suitable visualization type and technique, we need to know more about the purpose, respective tasks and intended effects visualization must fulfill on the different planning levels. In addition, research has not addressed participation and visualization on the farm level, although farmers make many decisions that affect public interests in the visual landscape.
Investigation objectives and approach
In this paper we examine how visualization can support communication with participants in the planning process, and we propose a framework for selecting appropriate types of visualization for participatory planning. Two levels of planning information are considered: the municipality or landscape scale, in which landscape planning decisions are made, and the farm scale.
Our findings on the landscape scale are based on research carried out in the research and development project, Interactive Landscape Plan (IALP) in Königslutter am Elm, Germany. The IALP was sponsored by the Federal Agency for Nature Conservation and implemented from 2002 until 2005. In the case study, data was gathered using participant observation, interviews, and quasi-experimental tests about a range of visualization techniques in different participatory settings, planning phases and with different application objectives. On the farm scale, an analysis of farm scale planning applications formed the basis for determining the visualization’s application objectives ([39]). Using the application framework developed for the municipal decision level, we generated recommendations about the visualization type and technique suitable for the farm scale by identifying transferability and similarities. As a standard for the current technical information and visualization at the farm scale, we used the (farm) Management System Nature Conservation for a Sustainable Agriculture (MANUELA). It was initially sponsored by the Federal Foundation for the Environment (DBU) from 2005-2008 and continues to be developed at the Institute for Environmental Planning at Leibniz University Hannover, Germany.
In the following chapters we first describe the different degrees of participation and their objectives in the planning process. This is followed by a review of the different tasks and effects of visualization techniques in the planning process at the municipal level, and recommendations are made about their potential to support participation in the different planning phases. Next, different opportunities to use visualization on the farm level are identified and matched with the potential tasks and effects that visualizations can support. Finally, suitable visualization techniques are recommended for the farm level and suggestions are made about their further development.
Participation in planning at the landscape scale
Levels of participation in the planning and decision process were first characterized by Arnstein ([5]) who identified eight levels of participation that range from non-participation up to citizen empowerment. Since then other researchers have revised and adapted the framework ([43], [18]) For example, the International Association for Public Participation ([12]) has adapted the Arnstein’s categories into different levels of communication and public impact: information, consultation, involvement, collaboration and empowerment (see Fig. 1). In all frameworks, the objective is to move from the one-way information delivery to the involvement of the public in decisions and democratic legislation. However, when the benefits promised from participation are not realized, planners and stakeholders often become disillusioned with the process ([23]). The discrepancy that may exist between the actual and perceived participation is called the “Arnstine gap” ([6]). It is argued here that visualization can help to close the Arnstine gap by improving participants’ understanding of the issues and their ability to communicate their knowledge and ideas at all levels. Visualization may not only improve people’s understanding of the planning issues, realistic landscape visualization may actually affect behavior or policy ([32]).
Fig. 1 - Levels of participation in landscape planning in the IAP2 spectrum of public participation ([12]).
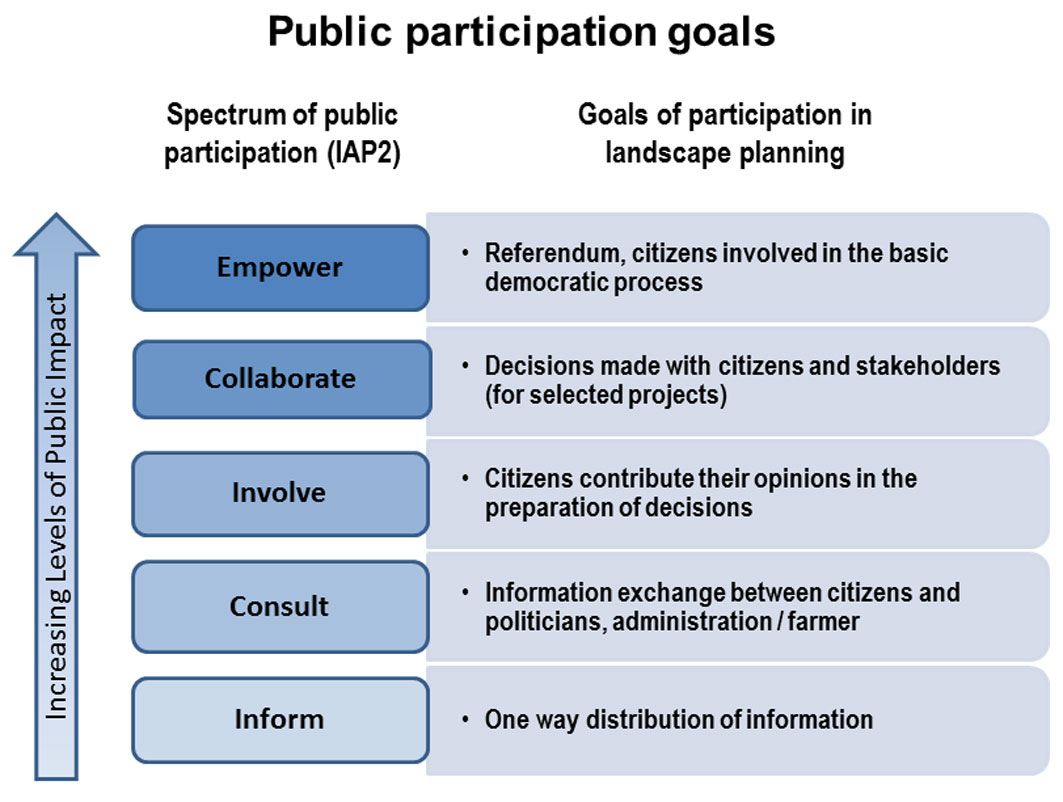
The European Landscape Conventions requires that the public be involved in decision made about the landscape. The degree of involvement for the public and different stakeholders depends on the project context, scale and objectives. Limiting participation to a one way distribution of information about landscape does not promote public trust in the planning process ([11]). Rather an exchange of information (consultation) with citizens, politicians and stakeholders, such as farmers, should be a goal of effective participation. Even better is when citizens can contribute their opinions, and their concerns are reflected in the decision making process (involvement), for example about infrastructure or new housing development projects. In the case of implementation projects that go beyond the scope of landscape planning, collaborative decisions that incorporate recommendations from citizens and stakeholders represent a greater involvement of citizens in the process. Finally, democratic representation in a referendum on environmental issues represents the highest degree of participation in planning. However, the higher levels of participation hold the danger that a small group, which is not representative of the population, may dominate the decision if all groups are not fairly represented. Identifying the appropriate stakeholders and ensuring representative participation is essential to the process ([18]).
In landscape planning the landowners (often the farmers) are an important stakeholder group because they are faced with the implementation of planning decisions on their land. The satisfaction of such stakeholders with the planning process is related to how well their participation is embedded in the planning and decision making process ([14]). Unfortunately, the public is often involved late in the planning process with little influence on the decisions ([9]). Rather participation should be considered as early as possible and incorporated throughout the process. Furthermore, the process should represent relevant stakeholders, such as farmers, and emphasize empowerment, equity, trust and learning ([24]).
How can visualization support participation at the landscape scale?
Visualization tasks, effects and respective suitable techniques at the municipal decision level
In the planning context, politicians and planners must communicate information on the landscape to citizens, who perceive and understand the information in the context of their cultural and social experience ([17]). A visual medium may have fewer linguistic and cultural barriers than a written or verbal message ([35]). While traditional communication tools in planning, such as maps, diagrams, and text, remain the most common instruments for communicating information, these are limited in their ability to convey spatial understanding to lay audiences ([36], [17]). An image not only supports spatial understanding but also helps citizens to picture landscape issues and facilitates participation ([1], [16], [25]).
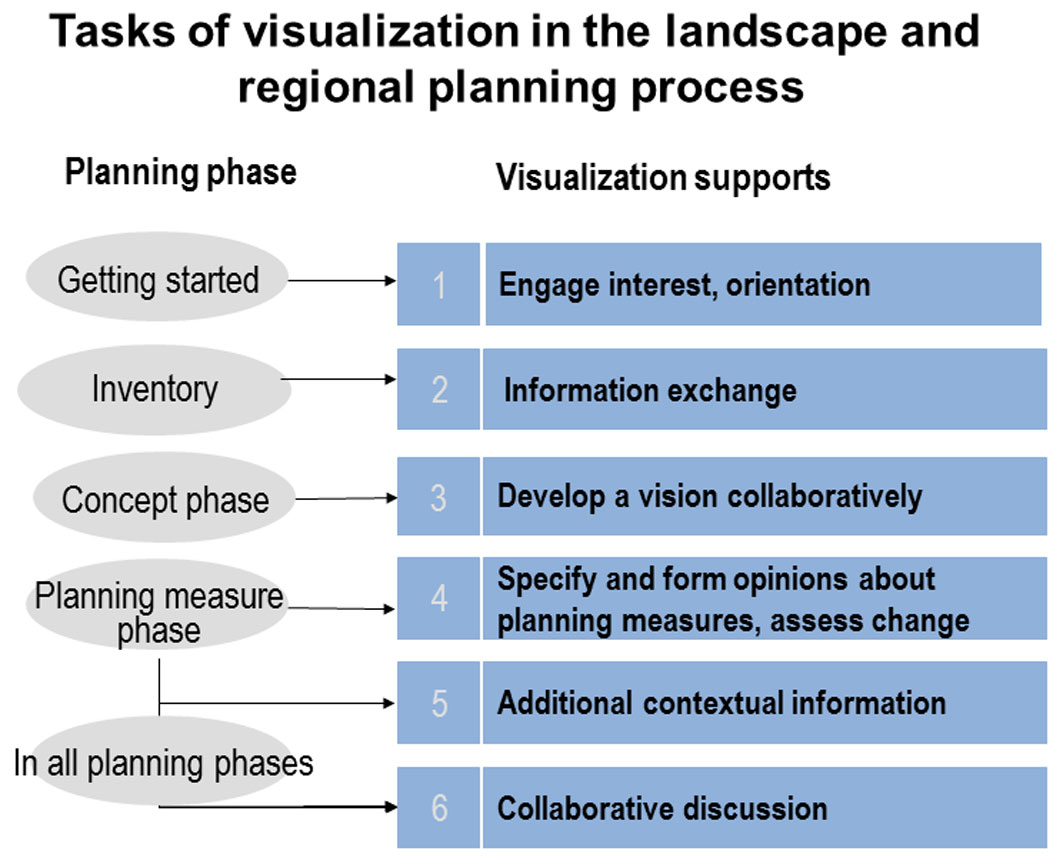
In landscape planning visualization supports different tasks during participation in the various planning phases (see Fig. 2). For example, a realistic, interactive visualization can trigger initial interest in the planning and spatial issues, or in the inventory and assessment phase, visualizations provide a common basis for the exchange of information and local knowledge about existing environmental data. Furthermore, stakeholders, citizens and planners can use visualizations to illustrate future scenarios and develop a “leitbild” (vision) for the landscape collaboratively. Finally, the simulation of planning measures provides a basis for discussing and forming opinions about the implementation of planning measures.
Fig. 2 - Visualization supports participation and communication in the different phases of landscape and regional planning. Visualization techniques tested in the IALP ([38]).
Different types of visualization
A wide range of visualization techniques are available offering different capabilities and possibilities to support the participatory tasks in the planning phases (Fig. 3). Among other aspects, visualization characteristics differ in dimensionality, level of realism, dynamic movement, interactivity, and display ([7], [40]). For example, two dimensional maps and aerial photographs improve the viewer’s orientation in discussions. Realistic visualizations with a high degree of detail, such as photomontages or photorealistic renderings, help participants to picture the changes in the landscape. VR models, panorama photos, animations or virtual globes of fered movement through the scene, which can stimulate interest by giving the viewer control of what they see. Finally, interactive visualizations, such as sketching or geodesign options, which allow the viewer to manipulate the content of the visualization, offer great potential for collaborative discussion about planning alternatives.
Fig. 3 - Visualization techniques have different characteristics - movement, realism, interactivity and dimensionality - that support different tasks in participation.
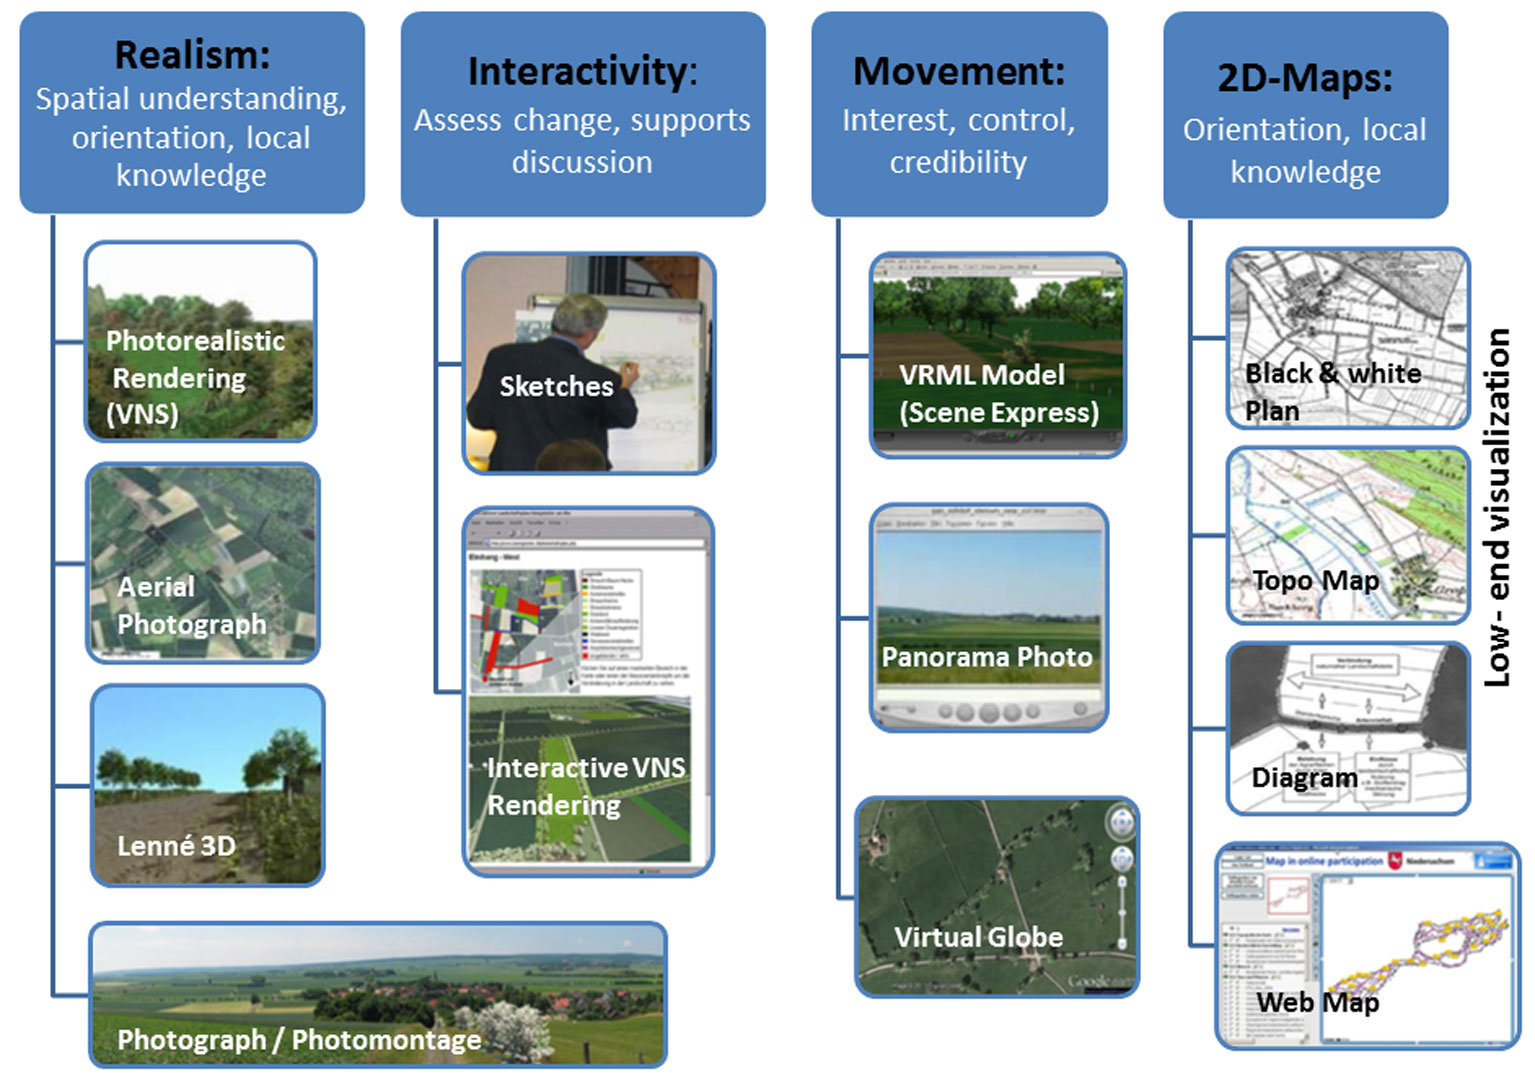
Regardless of the range of possibilities, visualization must fulfill some basic requirements in order to be suitable for public participation. It must provide the participants with good orientation, spatial understanding, the ability to assess change in the landscape, and credibility ([42]). In other words, the visualization can support participation when the viewer understands: where s/he is; what s/he is viewing, which changes to the landscape are being proposed; and s/he must trust that the visualization is not manipulative. Interestingly, the interactivity of the visualization plays an important role in promoting credibility of the visualization and understanding of the planning issues ([28]). Participants appreciate the opportunity to interact with the information because they often want to try out their own ideas and proposals ([37]).
Visualization requirements of the different landscape planning phases
Which visualization method can support the participatory goals in the different planning phases depends on the characteristics and effects of the visualization methods. The findings of the IALP and recommendations for using visualizations in the different planning phases are summarized in Fig. 4 ([42]).
Fig. 4 - Overview of goals, characteristics and effects of visualization that are important for selecting visualization techniques that support participation in the landscape planning process.
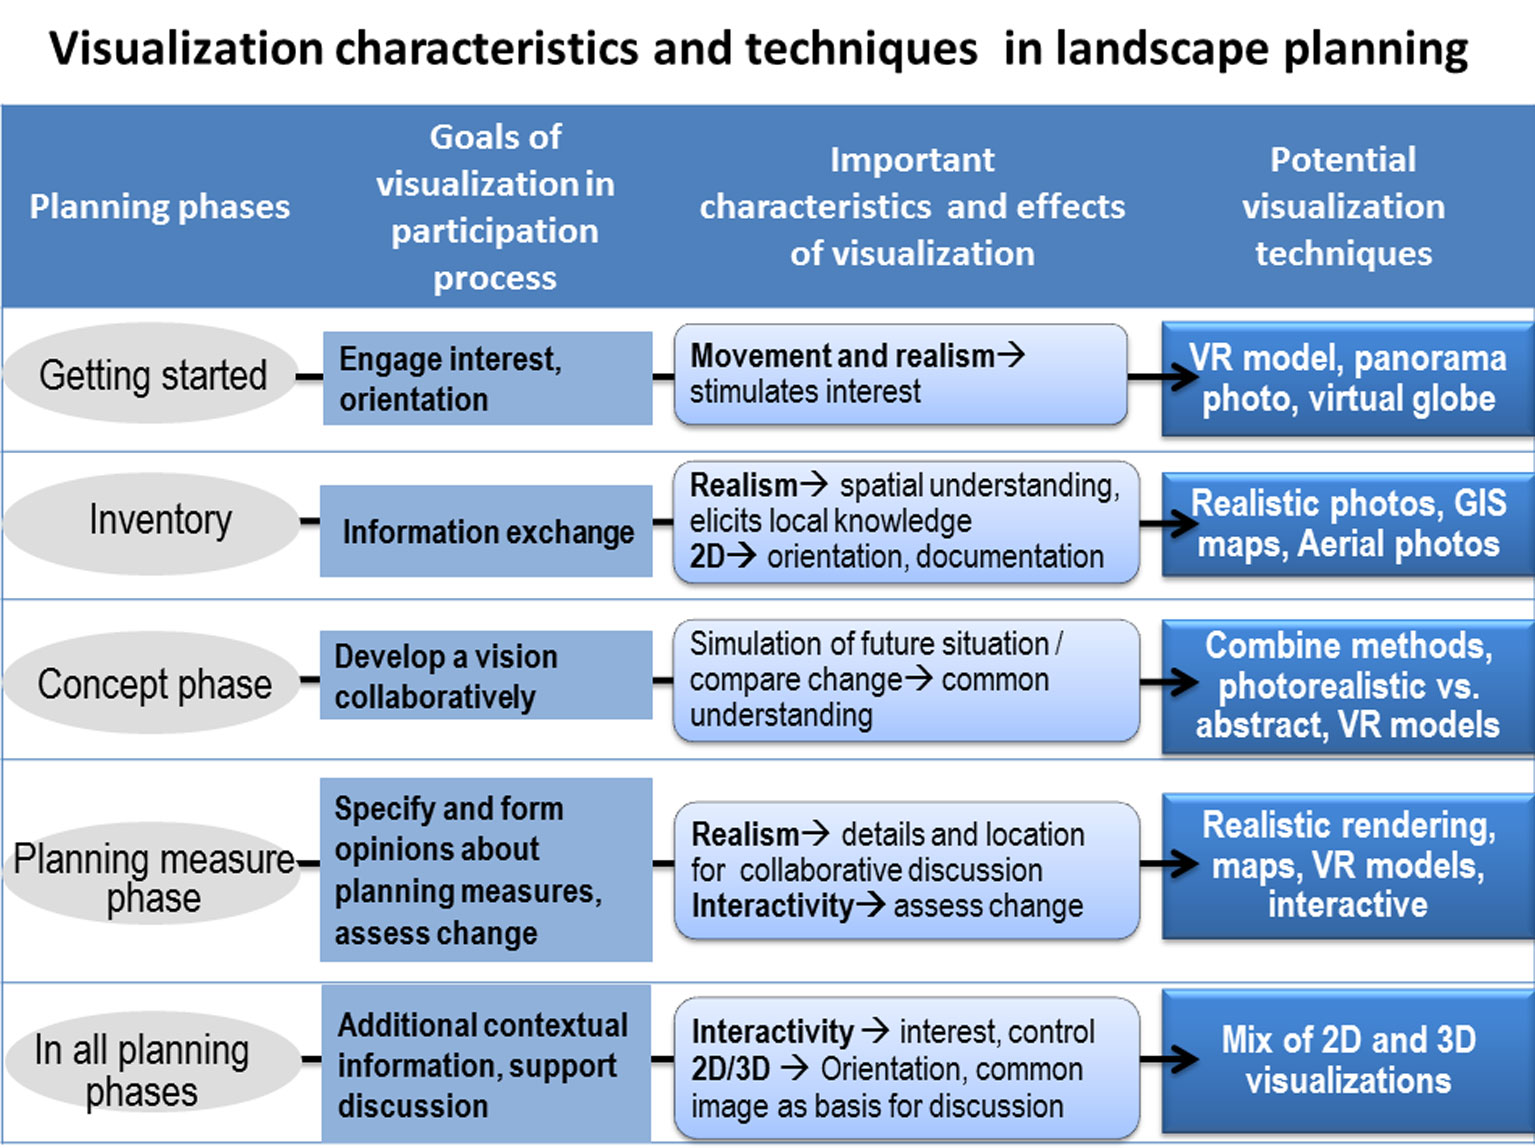
Getting started: movement and realism stimulate interest
Movement in visualizations can capture peoples’ attention and interest in the planning issues, although the initial fascination can wear off when the viewer becomes familiar with it ([26]). Realism and the viewer’s perspective of the image also help viewers recognize and identify with the planning area and issues. The recognition of the personal landscape in a realistic image influences the emotional involvement of the participants ([32]). Furthermore, the eye-level view provides the viewer with a familiar perspective that promotes identification with and interest in the landscape ([20]). The findings of the IALP indicate that the panorama photo, with a rotatable, realistic, eye-level view of the landscape, is especially successful in attracting the citizens’ interest and stimulating discussion about the landscape.
Inventory phase: realism elicits local knowledge, 2D provides orientation
Realistic and detailed representations of the landscape are useful to verify the site inventory with stakeholders and the public. At this stage in the planning, such visualizations, e.g., aerial photos or panorama photos, not only draw out participants’ local knowledge, they also give participants a sense of familiarity and help to elicit comments about the landscape. The overview and orientation that maps and aerial photos offer help citizens to locate themselves and their knowledge in the landscape.
Concept phase: simulations support common understanding
Developing a vision or “leitbild” for the future landscape in the concept phase of planning requires a common understanding of landscape development objectives and options. The visualization must communicate ideas and concepts that are central to the landscape while recognizing the uncertainty of the future development. Although it is still unclear which approach is preferable, geo-referenced or geo-typical images have been used in visioning. Geo-referenced images show the actual site in an abstracted or stylized manner. It is contended that the visualization should be abstract or stylized because the planning ideas are not yet concrete in the concept phase. This approach suggests that schematic images such as sketches ([2]) or abstract versions of possible planning proposals ([8]) can be used to show spatial relationships without including specific details of the actual site.
On the other hand, the geo-typical image does not show the actual site, rather it is a realistic image or photo of a prototypical landscape. In this approach, participants can discuss potential development options using realistic images of similar planning situations on comparable sites. The realistic images give a clearer picture of how the development of different goals and objectives could look. However, the viewers must mentally transfer the concepts to the actual site.
Planning measures: realism and interactivity help assess change
Participants often expect the most realistic and detailed visualizations in this planning phase, so they can form qualified opinions about concrete planning measures. Although photorealistic methods help to picture the landscape change, sufficiently detailed data must be available in order to create realistic visualizations ([30]). It is important to communicate the factors that limit realism to the public, so they understand the limitations of the visualization. For the participants in the IALP case study the comparison of before-and-after images also played a central role in discussions during this phase, either to explain measures, to illustrate an opinion, or even to support decisions about alternatives.
Visualization in all phases - general recommendations and discussion
The findings of the IALP case study indicate some general recommendations for using visualization in the participatory process at the landscape scale, regardless of planning phase ([41]) Firstly, two dimensional visualizations remained a main stay of communication. This supports the findings of MacEachren ([19]) and Arciniegas & Janssen ([4]) that 2D maps and aerial photos offer an important overview of the planning area and orientation that are important when working with citizens. Interestingly, participants with good map reading skills often prefer maps to 3D visualizations ([26]).
Secondly, the combination of 2D maps and 3D realistic still images of the landscape satisfied the participants’ requirements for both orientation and spatial understanding ([42]). Furthermore, a combination of methods was needed to meet the diverse needs of the participants. Although it can be debated that different visualization methods are better in different situations and for different audiences, this agrees with Appleton’s findings that no single visualization method can fulfill all the wishes of the participants ([3],).
Finally, the visualizations that allowed participants to interact with the content, whether it was an artist sketching ideas or interactive 3D models, were used frequently to explain or support comments during discussions. This supports the findings of Schroth et al. ([28]), who found that when viewers can directly engage in the visualization, it promotes collaboration in a participatory planning situation. The development of new technology that makes it possible to ask “What-if?” questions of scenarios and to visualize the answers has potential to improve collaborative participation.
Goals, characteristics, effects and techniques of visualization on the farms scale
Visualization goals on farm scale and present techniques
At the landscape scale, sound environmental information and public participation in the planning process is needed to reach qualified and democratic decisions about spatial development questions. Ultimately, many of these decisions must be implemented on farms and with the support of farmers: for example, species protection, habitat networks, or the reduction of fertilizer input near areas for extraction of drinking water. Farmers need to communicate such ecosystem services to the public in order to improve acceptance and recognition for their contributions, for example, in the local community. In addition, customers of farm products want to know about the environmental performance of farms or the life cycle of the products. Authorities require information about the ecological results of payments for ecosystem services, for example, in agri-environmental measures ([39]). Furthermore, when farmers make changes in agricultural land use it changes the landscape that neighbors and the local community see and experience. Therefore they must communicate the reasons for change, and when possible, allow the public to be part of the decisions about changes that directly affect them. In fact, a farmer’s good “image” depends on the visual quality of the landscape, nature conservation achievements on the farm and the openness of farmers to communicate.
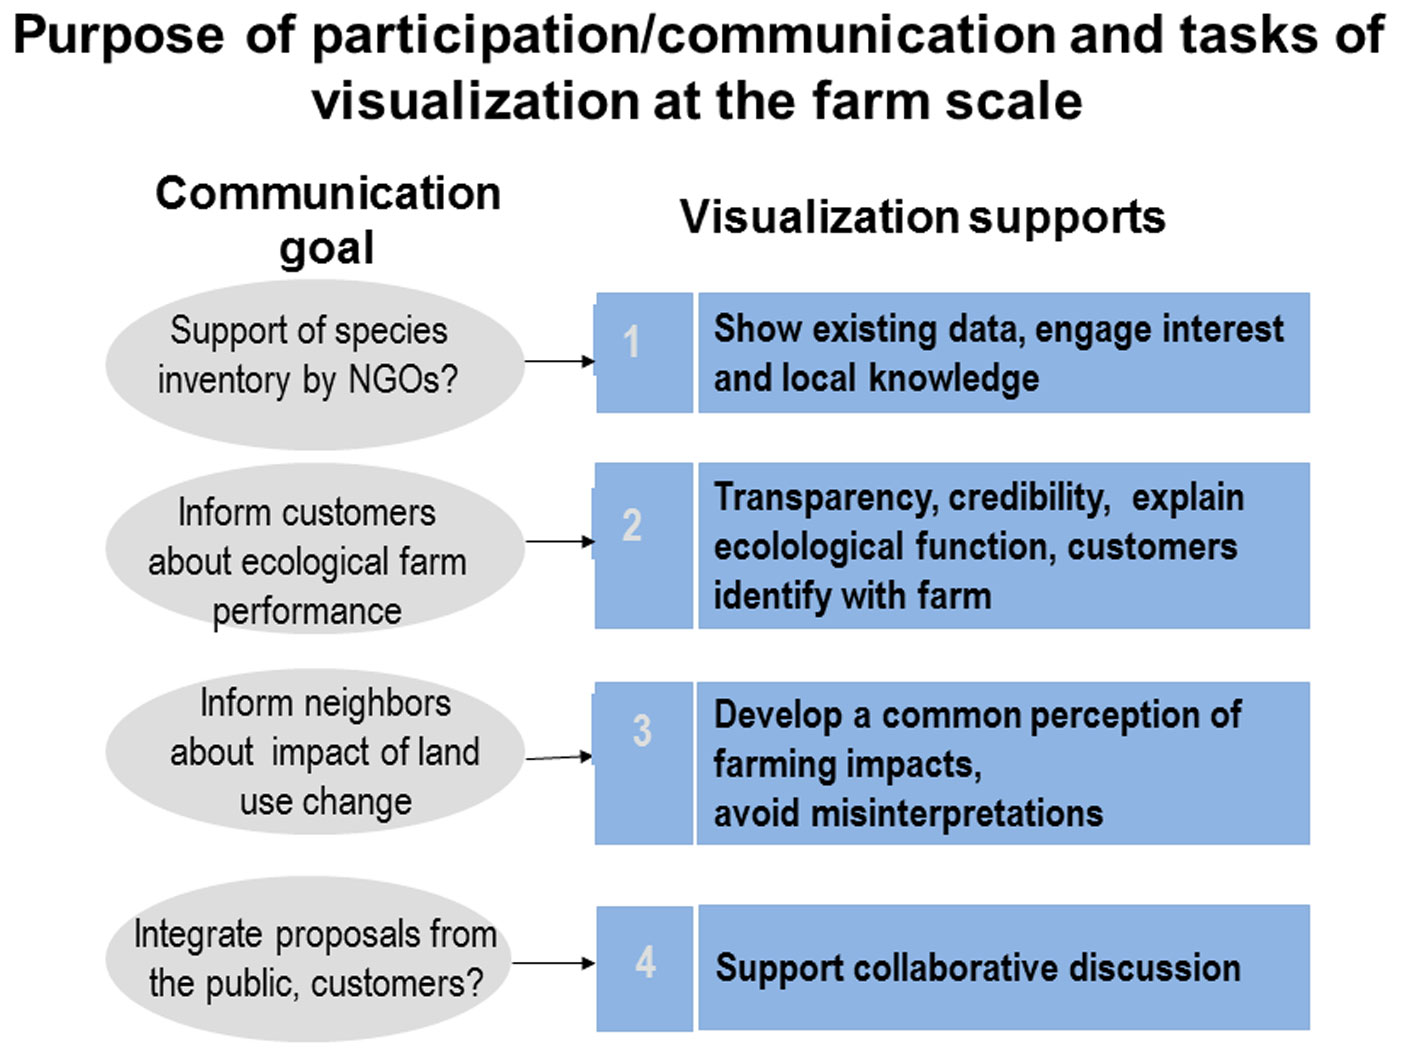
The necessity of good communication at the farm scale is evident in the numerous examples of citizens protesting against the increase of energy crops or the siting of wind mills or the construction of buildings for livestock. The goal of visualization at the farm scale is to communicate changes in the landscape that result from farming practices and agri-environmental measures to perspective customers and interested parties. Using two and three dimensional visualizations, farmers can help local citizens understand landscape changes occurring on their farms (e.g., effect of crops such as maize or short rotation coppice). In this way, farmers can increase the acceptability of the changes or even integrate citizens’ proposals into planned land use changes (see Fig. 5).
Fig. 5 - Examples of how visualization can support farmers’ communication with the public, customers, food companies and authorities at the farm scale.
Requirements for visualization characteristics and desired effects at the farm scale and proposed visualization techniques
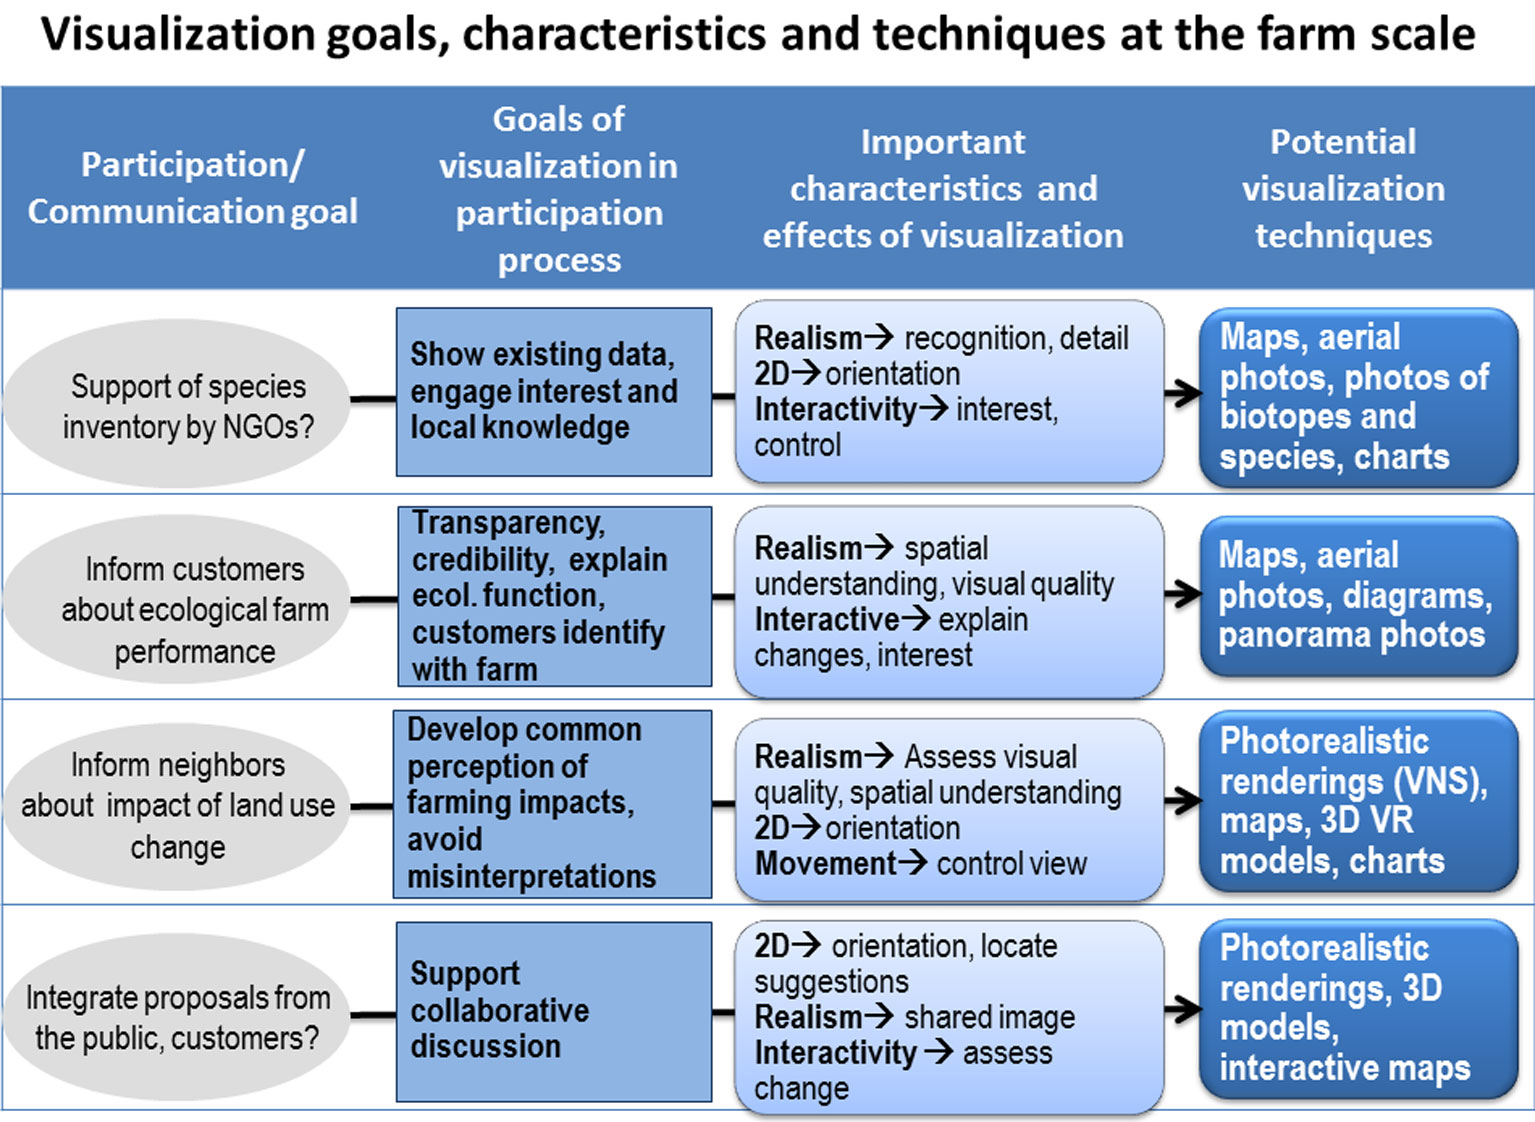
Based on the experience gained in the IALP case study, we deduced recommendations for the use of visualization at the farm scale. Our analysis indicates that visualizations fulfill similar communication objectives on the farm scale as they do on the municipal level (Fig. 5). Also at the farm scale visualization must also fulfill the prerequisites of good orientation, spatial understanding, ability to assess change and credibility. The findings indicate that 2D visualizations with maps and charts can satisfactorily communicate non-visual or conceptual information to the farm customers, neighbors and local community. For example, invisible or temporal landscape processes at the farm scale, e.g., good farming practice to reduce nitrate in the ground water or measures to improve biotope connectivity, can be illustrated in maps with additional information in the form of charts and graphs. Being able to view the data and compare the evaluation of biodiversity, soil and landscape aesthetics can support transparency and trust in the farm products. Also scenarios of farm management visualized in maps can help communicate changes to affected parties. According to the findings on the landscape level, maps and charts can suffice for these purposes. Fig. 6 shows potential visualization goals at the farm level and the characteristics and effects of visualization that are required to fulfill these goals.
Fig. 6 - Recommendations for the integration of visualization on the farm scale.
However, if the general public should understand and accept visual changes occurring on the farm, then they will need more than two dimensional visualization methods. 3D visualization techniques are needed to show a perspective view of the landscape that can portray proposed development in a realistic context. Research suggests that realistic, 3D visualizations increase understanding and help people relate to the landscape changes ([33]). Farmers could use real-time, 3D visualizations not only to attract customers but also to promote an understanding of the ESS they provide to the public.
Supporting visualization with farm management data
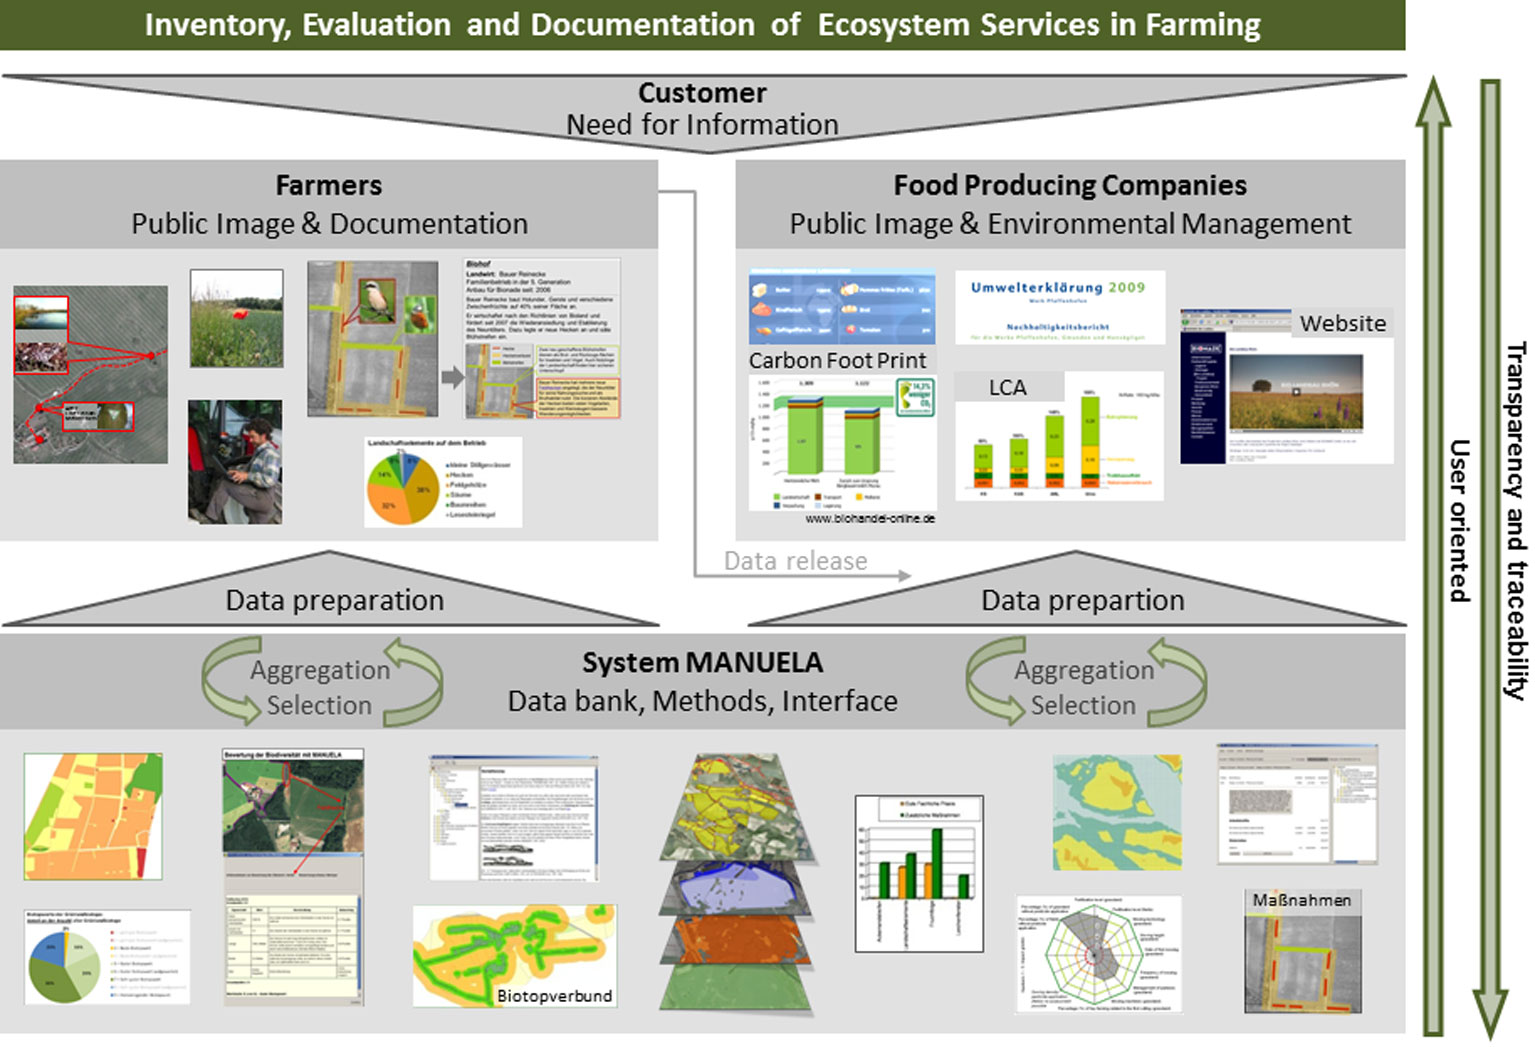
We tested the feasibility of different visualization options with respect to available data and EDV support in the farm management system (MANUELA). MANUELA is a computer system that assists farmers with the management of agri-environmental measures and sustainable farm practices on individual farms ([39]). It can be used not only to document but also to market the farm’s ecosystem services (ESS) to contracting food producers as well as local customers. Using the open source GIS program OpenJUMP® (⇒ http://www.openjump.org/), the system supports the inventory, assessment, documentation, planning and cost calculations of ESS that a farm offers. MANUELA also provides spatial analysis and evaluation of management decisions. Fig. 7 gives an overview of the different components and capabilities of MANUELA.
Fig. 7 - Overview of the visualization functions of MANUELA (source: [13]).
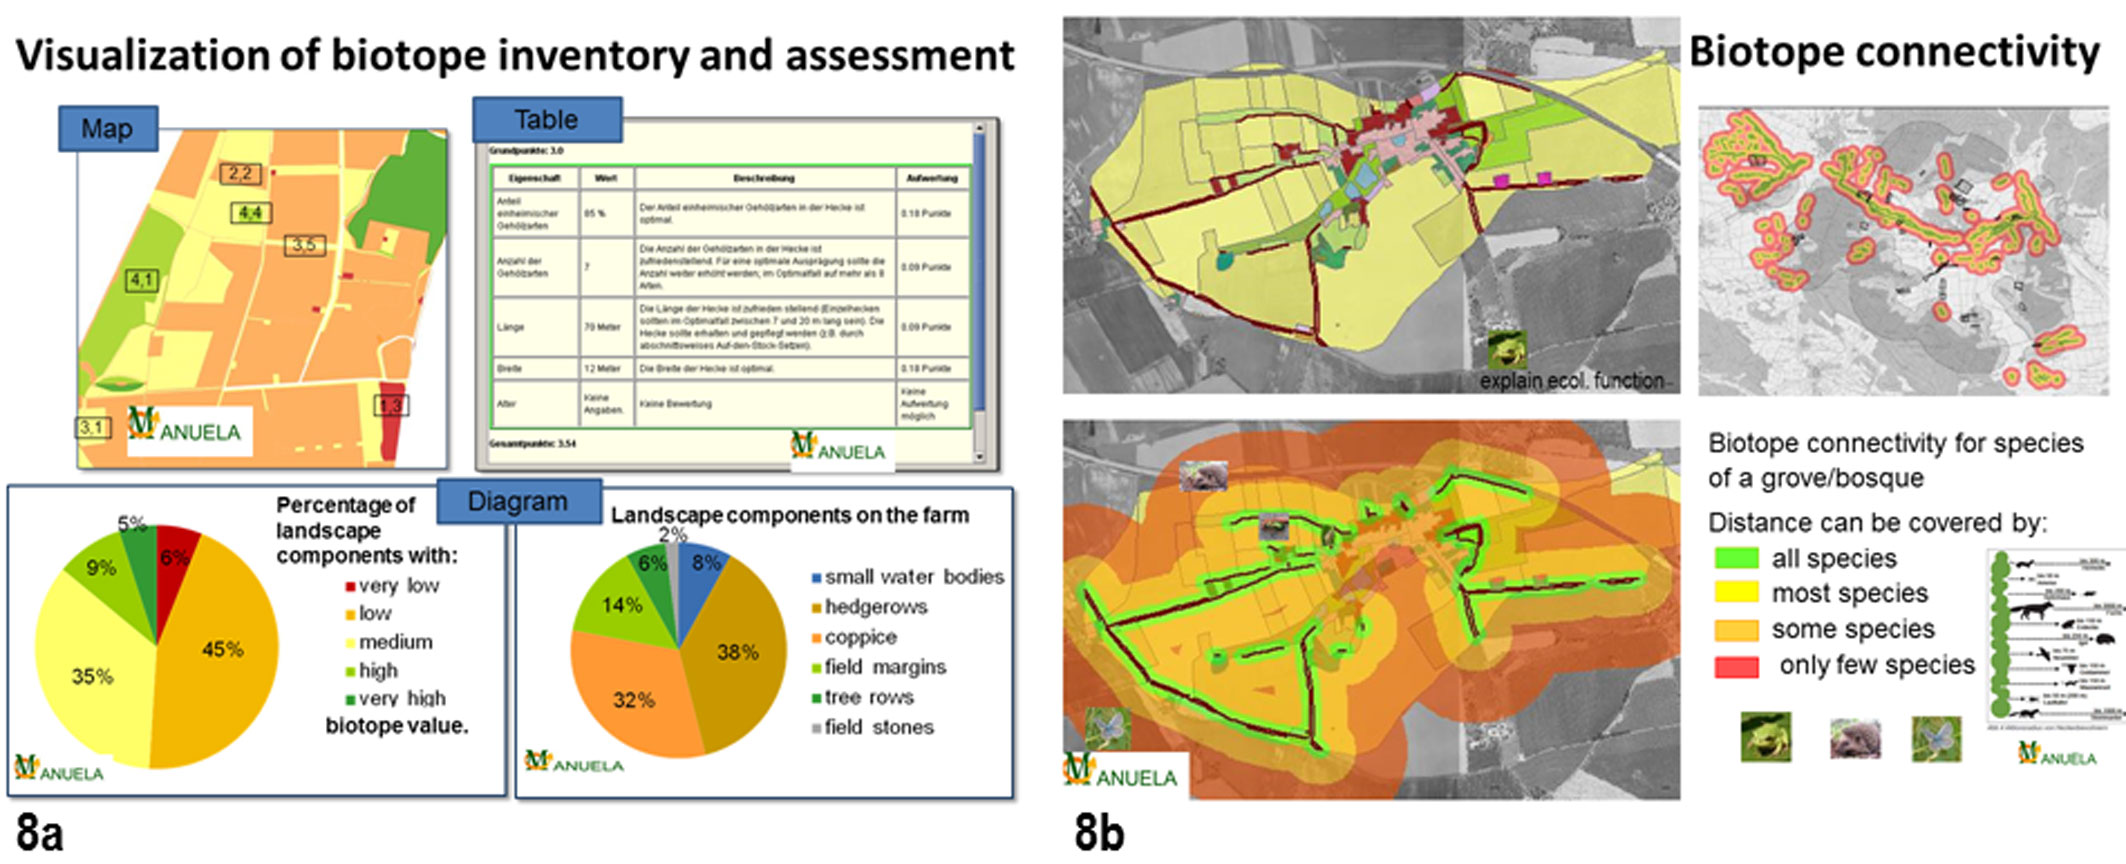
Presently, visualizations implemented in MANUELA consist mainly of GIS maps and charts drawn from data about the individual farms. This information and corresponding still images are used to illustrate the changes in the ecosystem services. For example, the data about the biotope inventory is illustrated in maps and tables and the assessment can be visualized in diagrams (see Fig. 8a and Fig. 8b).
Fig. 8 - (a) Visualization of biotope inventory. (b) Visualization of biotope connectivity in MANUELA. Data about ESS can be visualized with maps, diagrams, tables and photos. Presenting the data supports transparency of decisions about ESS.
However, the potential of the farm management system MANUELA to support more sophisticated visualizations is excellent. The GIS data used in MANUELA is comparable to or even more detailed than the data used at the landscape level in the Interactive Landscape Plan. Therefore, more sophisticated visualization techniques could be created to illustrate landscape change at the farm level. For example, an elevation model, which is a prerequisite for 3D visualizations, is a standard feature for soil erosion assessment. Furthermore, the habitat data at the farm level in MANUELA is far more detailed than at the landscape level. This fulfills many of the prerequisites for creating realistic and detail landscape visualizations equally well, if not better than at the landscape level. The same is true for data about cultivated crops and their phenology over the course of the year, which enables the visualization of temporal changes of the landscape.
If the software from the interactive landscape planning tool box was used to create visualizations with this excellent data basis, the results could satisfy all the information and communication requirements of the various addressees. For example, interactive maps and 3D visualizations could be used to communicate major landscape changes planned by the farmer. A real-time 3D model could allow customers to take a virtual stroll through the farm. Interactive maps could enable local citizens to interactively contribute data about species that they have sighted (crowd sourcing). However, such visualization methods require expertise that farmers do not generally have and the software is often expensive. Until the technology becomes easier to use, creative ways to integrate simpler solutions, such as photos or videos on YouTube®, may have to suffice. Nevertheless, the potential of interactive visualizations to attract attention to the highlights of a farm should not be ignored, even if they must be produced by an expert. A fly-over animation or a video that offers a virtual hike through the farm may be an effective advertisement.
Discussion of farm scale visualization
Farmers can make their achievements more public by visualizing the environmental improvements on their farm. At the same time, such visualizations can be used to manage and document the performance of ESS produced by the farm. However, the farm scale visualization is place-based, in other words it addresses decisions made for one farm. The surrounding landscape can be only partially represented, which does not provide a visual overview of the contextual landscape. For example, the cumulative effect of several farmers cultivating energy crops on the wider landscape is not illustrated. The same applies to representing the connectivity of larger ecological systems that span multiple farms. Such issues need to be addressed at the landscape scale, and the visualizations must be able to bridge the farm and landscapes scale in order to show the effects of farm decisions on both the farm and landscape scales.
A common perception about the impacts of farm measures is crucial in order to avoid misinterpretations and misunderstandings about changes in the landscape at the farm scale. Presently such changes are generally visualized with maps and diagrams. However, visual impacts are best understood with realistic simulations or real time models that require expert know-how or specialized visualization techniques. Until these technologies become easier to use, farmers must depend on simple “crutches”, such as “before and after” photos or videos. Therefore, developing easy to use 3D and interactive visualization techniques that can simulate landscape changes is an urgent request for the future.
Conclusions
In order to use visualization in a targeted and efficient way, it is important to analyze the application objectives as well as the respective visualization tasks and intended effects. This analysis, both on the landscape as well as on farm scale, is a prerequisite for choosing a suitable visualization technique. At all scales visualizations must provide good orientation, spatial understanding, the ability to assess change and credibility.
At the landscape scale, visualizations can support participation in the:
- early phases of planning by stimulating interest with realistic or moving images;
- inventory phase by providing realistic visualizations of the existing landscape that help participants to contribute local knowledge;
- concept phase by supporting discussion about a “leitbild” concept for the landscape with either geo-typical or geo-referenced images;
- final planning phases by illustrating planning measures with realistic visualization methods that offer different views of the planning.
At the landscape scale, the findings indicate that two dimensional maps and aerial photographs provide participants with the necessary overview and orientation. In combination with three dimensional, realistic visualizations, they form a good basis for discussing landscape issues. Furthermore, interactive visualizations promote collaborative discussion as well as credibility in the participatory process. New technologies that allow participants to pose questions and interact with the visualized information offer potential to make participation in the planning process more collaborative. However, a combination of different visualization methods is needed in order to meet the diverse requirements of the participants and the participatory goals.
Visualizations not only improve the involvement of citizens and stakeholders in the planning process at the landscape level, they also provide transparency at the farm scale. At farm scale, visualizations can be used to communicate visual landscape changes that result from altered agricultural practices and the development of farm infrastructure. They can also communicate information to customers (food companies, tourists, customers of farm sale, neighbors) about the ESS that farmers produce by showing where and how the actual measures are implemented.
Presently, maps and diagrams of ecosystem services that are generated from GIS data can be visualized and made public on the web by farm management systems like in MANUELA. This in combination with simple visualizations such as photos may be sufficient to present many of the issues at the farm scale. However, 3D visualizations illustrate visual changes in the landscape more effectively. For this, farmers and farm advisers need easy to use 3D visualization technologies that do not yet exist. The development of user-friendly 3D visualization methods, preferably open source, is essential to help farmers simulate visual landscape change on their farms.
Further research should address the inter-relationship of effective visualization on both the landscape and farms scale. Possibly, visualizations at both scales may improve the decisions at the landscape level by making the consequences at the farm level clearer. Conversely, the visualization of ESS at the farm scale may improve farmers “bargaining power” in landscape decisions.
References
Gscholar
Gscholar
Gscholar
Gscholar
Gscholar
Gscholar
Gscholar
Gscholar
Gscholar
Gscholar
Authors’ Info
Authors’ Affiliation
Christina Von Haaren
Institute of Environmental Planning, Leibniz University Hannover, Herrenhäuser Str. 2, D-30419 Hannover (Germany)
Corresponding author
Paper Info
Citation
Warren-Kretzschmar B, Von Haaren C (2014). Communicating spatial planning decisions at the landscape and farm level with landscape visualization. iForest 7: 434-442. - doi: 10.3832/ifor1175-007
Academic Editor
Marco Borghetti
Paper history
Received: Oct 31, 2013
Accepted: Apr 05, 2014
First online: May 19, 2014
Publication Date: Dec 01, 2014
Publication Time: 1.47 months
Copyright Information
© SISEF - The Italian Society of Silviculture and Forest Ecology 2014
Open Access
This article is distributed under the terms of the Creative Commons Attribution-Non Commercial 4.0 International (https://creativecommons.org/licenses/by-nc/4.0/), which permits unrestricted use, distribution, and reproduction in any medium, provided you give appropriate credit to the original author(s) and the source, provide a link to the Creative Commons license, and indicate if changes were made.

Web Metrics
Breakdown by View Type
Article Usage
Total Article Views: 50468
(from publication date up to now)
Breakdown by View Type
HTML Page Views: 42474
Abstract Page Views: 2387
PDF Downloads: 4045
Citation/Reference Downloads: 71
XML Downloads: 1491
Web Metrics
Days since publication: 3629
Overall contacts: 50468
Avg. contacts per week: 97.35
Article Citations
Article citations are based on data periodically collected from the Clarivate Web of Science web site
(last update: Feb 2023)
Total number of cites (since 2014): 9
Average cites per year: 0.90
Publication Metrics
by Dimensions ©
Articles citing this article
List of the papers citing this article based on CrossRef Cited-by.
Related Contents
iForest Similar Articles
Research Articles
The concept of green infrastructure and urban landscape planning: a challenge for urban forestry planning in Belgrade, Serbia
vol. 11, pp. 491-498 (online: 18 July 2018)
Research Articles
Public participation GIS to support a bottom-up approach in forest landscape planning
vol. 6, pp. 347-352 (online: 29 August 2013)
Technical Advances
Forest planning and public participation: a possible methodological approach
vol. 5, pp. 72-82 (online: 12 April 2012)
Research Articles
Usefulness and perceived usefulness of Decision Support Systems (DSSs) in participatory forest planning: the final users’ point of view
vol. 9, pp. 422-429 (online: 02 January 2016)
Review Papers
Public participation: a need of forest planning
vol. 7, pp. 216-226 (online: 27 February 2014)
Research Articles
Scale dependency of the effects of landscape structure and stand age on species richness and aboveground biomass of tropical dry forests
vol. 16, pp. 234-242 (online: 23 August 2023)
Research Articles
Public participation in sustainable forestry: the case of forest planning in Slovakia
vol. 7, pp. 414-422 (online: 19 May 2014)
Review Papers
Green Infrastructure as a tool to support spatial planning in European urban regions
vol. 6, pp. 102-108 (online: 05 March 2013)
Research Articles
Green oriented urban development for urban ecosystem services provision in a medium sized city in southern Italy
vol. 7, pp. 385-395 (online: 19 May 2014)
Research Articles
Evaluation of urban forest landscape health: a case study of the Nanguo Peach Garden, China
vol. 13, pp. 175-184 (online: 02 May 2020)
iForest Database Search
Search By Author
Search By Keyword
Google Scholar Search
Citing Articles
Search By Author
Search By Keywords
PubMed Search
Search By Author
Search By Keyword


