Integrating forest-based industry and forest resource modeling
iForest - Biogeosciences and Forestry, Volume 9, Issue 5, Pages 743-750 (2016)
doi: https://doi.org/10.3832/ifor1961-009
Published: Aug 12, 2016 - Copyright © 2016 SISEF
Research Articles
Abstract
This paper introduces a modeling approach for the assessment of policy options within the forest-based bioeconomy. The feedback between the forestry dynamics model and the economic model of the global forest-based sector of the proposed framework is essential, not only for response analysis as to the development of forest resources and for a correct assessment of future harvesting potentials, but also for the assessment of the impact of different management regimes on wood-based product markets. Test runs of the modeling framework on a Swedish case highlight the necessity of considering timber assortments for a comprehensive integration of forest resources and wood-based commodity market dynamics. Hence, the composition of harvest demand in terms of timber assortment affects the allocation of harvesting activities and, consequently, the development of forest resources (and thus future harvest potentials), as well as the production, trade and consumption of wood-based products.
Keywords
Policy, Bioeconomy, Wood-based Products, Market, Forest Resources
Introduction
A meaningful assessment of the impact of policy actions within the forest-based bioeconomy requires the capability to evaluate the economic implications on the market for wood-based products, as well as the impact of such implications on forest resources. This in turn calls for the modeling of the wood-based product market, as well as of the forest resource dynamics, and, most importantly, their interaction. While there are quite a few modeling efforts with pan-European scope that dealt with forest resource dynamics ([13], [23], [24], [3]), or wood product markets separately ([20], [21], [9], [12]), only few modeled their interaction on pan-European scale ([10], [19], [22]).
In particular, the existing studies do not fully account for the feedback from the forest-products market model to the forest resource model, so that the integration between the two is partial only. Thus, the sustainable potential supply of woody biomass as calculated by the forest resource model is ingested by the market model as a constraint on the production of wood-based products (sawnwood, wood-based panels, pulp and paper). The demand for wood raw material calculated by the latter is then used by the forest resource model to assess the development of forest resources; however, when computing the next period potential harvest level, the “actual” harvest demand derived by the market model is not taken into account.
As a result, multiple errors propagate over time, should the satisfaction of the demand for woody biomass calculated by the economic forest sector model require a lower harvesting level than the sustainable potential derived by the forest resource model ([15]). In addition, none of these studies accounted for timber assortments (sawlogs and pulp-/fuel-wood, respectively), neither when allocating the harvest demand from the market model in the forest model, nor when deriving in the latter the harvest potential to be used as bounds for the production.
On the opposite, the full integration of forest resources and market dynamics in a modeling framework calls for the consideration of timber assortments. Hence, the division of harvest potential on timber assortments has implication for production as well as for trade of wood-based products. In turn, the composition of the harvest demand in terms of timber assortment has implications for forest management and, consequently, for the development of forest resources.
This paper adds to the existing literature by elaborating the full (as opposed to the partial one) interaction between a forest resource model and an economic forest-based sector model. Further, in the information transfer between the two models, timber assortments (coniferous and non-coniferous sawlogs and pulp-/fuel-wood, respectively) are also accounted for. The integrated model is used in a Swedish test case.
The paper proceeds as follows: the next chapter introduces the forest-based sector model - the Global Forest Trade Model (GFTM - [7]) - and the forest resource model - the European Forestry Dynamics Model (EFDM - [14]). Then a description of the information exchange between the two models follows. Hereafter, the results of a number of modeling runs are presented and discussed. Finally, conclusions and suggestions for further research are put forward.
Materials and methods
The modeling framework for the forest-based bioeconomy suggested in this paper is based on two main ingredients: a forest-based sector model - the Global Forest Trade Model (GFTM) - and a forest resource model - the European Forestry Dynamics Model (EFDM).
The Global Forest Trade Model (GFTM)
The Global Forest Trade Model (GFTM) is an equilibrium model for the forest-based sector which shares with other similar models - notably the Global Forest Products Model, GFPM ([2]) and the European Forest Institute Global Trade Model, EFI-GTM ([8]) - the theoretical formulation based on spatial equilibrium theory in competitive markets for several commodities ([18]). Specifically, the model is based on the maximization of the whole forest sector welfare (consumer, primary/industrial products-producers and traders), subject to feasibility, resources, productivity and equilibrium constraints. Similarly to the GFPM and the EFI-GTM, also the GFTM is static since, given a certain number of iterations (i.e., the number of periods one wants to project), at each iteration the optimal welfare is computed, with imperfect foresight. Once a solution is reached, the parameters of the model are updated based on endogenous (harvest levels) and exogenous (GDP growth) drivers, new resources and productivity constraints are set, and a new iteration begins.
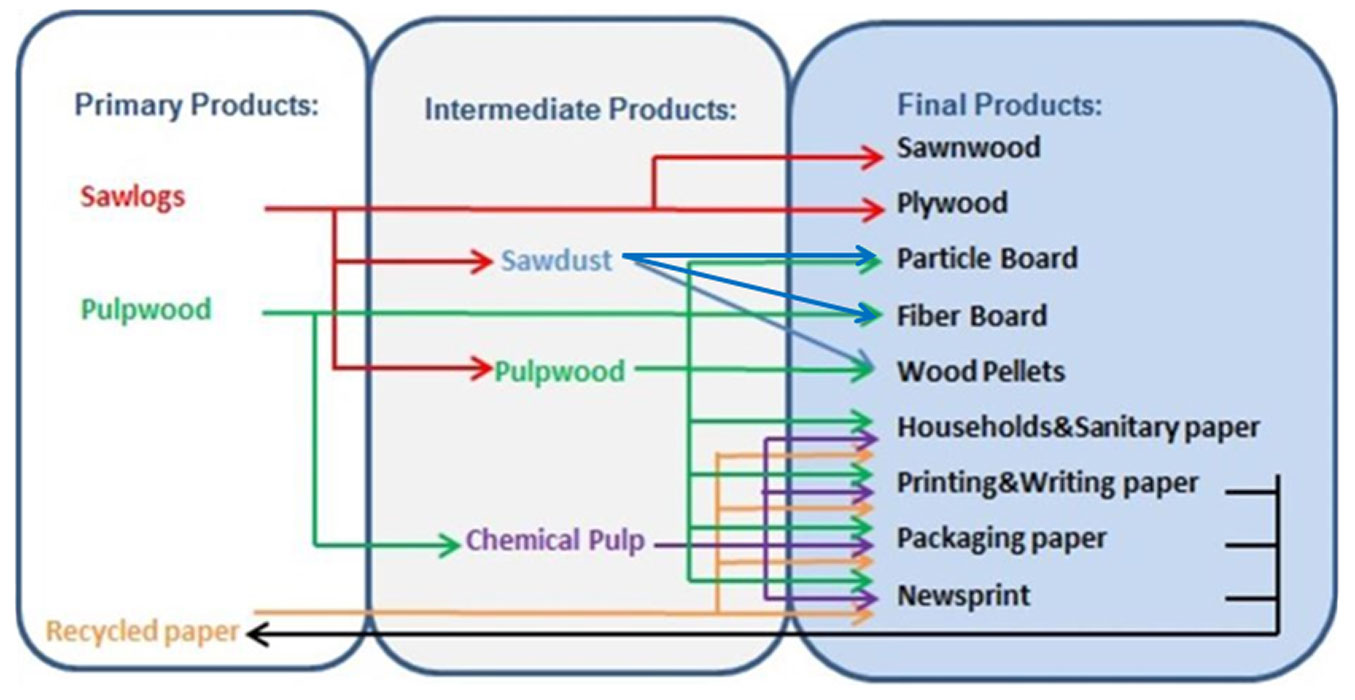
GFTM focuses on wood-based products that are internationally traded, covering ten final products, four intermediate products, and four primary products (Fig. 1). The geographical scope is global, with a European focus. Countries that are modeled individually comprise all EU member states plus Belarus, Norway, the Russian Federation, Serbia, Switzerland, and Ukraine in Europe, and then Brazil, Canada, Chile, China, India, Japan, Turkey, and USA. Some non-major producer and/or consumer countries of wood are aggregated into global sub-regions: South East Asia, North Africa, South Africa, Rest of Latin America, Oceania, and the Rest of the World. The main outputs of GFTM are the projections of consumption, production and net trade levels for final products, the projections for harvested, industrially processed and net traded quantities for primary products, and quantities produced and traded for intermediate products.
Fig. 1 - Product flow chart of the GFTM.
GFTM uses as starting prices/values for production/trade quantities the corresponding data derived from FAOSTAT and EUROSTAT data bases for the years 2010 and 2011. Prices for all commodities derive from trade unit values (value in US$ divided by quantity exported or imported). Following the same approach as for the time series cross sectional approach in Jonsson ([6]), the largest trade stream (in quantity terms) is used to derive the price (e.g., for the Swedish price of coniferous sawnwood, the export trade unit value is used as the price for sawnwood). Production costs derive from FAOSTAT as the price (trade unit values) for the product minus the price of the input(s) weighted by input coefficients.
Price and GDP elasticities derive from Jonsson ([6]) for Europe, while for non-European countries and sub-regions GFTM uses the same elasticities as in GFPM. As for wood pellets, price and GDP elasticities are estimated through time-series cross-sectional analysis performed on data for household use in Austria, Germany, Italy, and Sweden. These elasticities are then applied for countries where the consumption of wood pellets is deemed to be dominated by household use, while for countries where wood pellets are consumed also for larger scale use for heating and/or power, weighted elasticities are set based on expert assessment of the respective quantity share of respective user category. The constant parameters of the timber supply function in the initial period derive from actual data for sawlogs and pulpwood removals (production), and prices of sawlogs and pulpwood, respectively.
GFTM can be used as a stand-alone model. In this instance, timber supply is provided from a simple growth model wherein growing stock and increment data are compiled from various sources, and annual potential harvest levels are set equal to annual increment. This volume is then converted to solid volume under bark, using a constant 0.88. This value is based on national data for Sweden, considering all tree species and assortments. Ideally one should use different conversion factors depending on species. In particular, non-coniferous species are very diverse in terms of the extent of bark. However, for simplicity, considering that all non-coniferous species are aggregated in the modeling, only one conversion factor was used here. Finally, the obtained volume is divided into coniferous and non-coniferous, sawlogs and pulpwood respectively, based on FAOSTAT industrial roundwood production (i.e., removals) data series.
The supply/availability of local intermediate and final products is determined in the transformation process simulated by the industry module of the GFTM. Thus, the transformation of products implicit in the production process is described in GFTM by means of a country-specific industry matrix, whose number of columns equalizes the number of produced products (intermediate and final), the number of rows is the total number of products, and the matrix coefficients are equal to the conversion factors for production. Unfortunately, for most countries and products these data are not available, hence the used input/output coefficients build on Fonseca ([5]), while, for countries and sub-regions not covered in the study, the coefficients were extrapolated using expert assessment.
For further details regarding model structure, assumptions, and input data, we refer the reader to Jonsson et al. ([7]).
European Forestry Dynamics Model (EFDM)
EFDM is an area-based matrix model ([16]), meaning that forest areas are transiting between elements of a set of fixed states, depending on the initial state and the correspondingly applied management activities. Typically, an activity is either harvest, such as final felling and thinning, or no management, which simply means that the forest is let to grow naturally for that time step. However, an activity could also represent a calamity due to biotic or abiotic forest damage. Thus, given a set of fixed states S, and denoting by X0 the initial area distribution over the states, by P the transitions between different states (S) guided by the activities A (defined over S), and by t the ordinal number of time step in the model run, the transition from one period to the following are governed by (eqn. 1):
When applied to even-aged forests, the set S is usually defined by classes for age and standing volume. A common S is associated with all the different “forest types” which in turn are defined by, for example, region, species, site quality and/or owner. The initial state matrix X0 is estimated using NFI plot data, while the transition matrix P is estimated using two consecutive measurements of NFI plots, increment measurement of NFI plots, or growth information from pre-existing functions.
Usually, data available for estimating the transition matrices also define the length of the time step of the model. The X matrix is constructed through a simple classification, while the P matrix is estimated using a Bayesian procedure. The activity matrix A is derived relying on national expertise and it consists of probabilities for each activity in each cell of the state-space, normally expressing a management pattern relating to the “handbook”. By applying a shifter to the basic activity matrix, the activity level can be adjusted to meet, for example, a specific harvest level. The relative intensities of different activities can be changed using activity specific shifters.
In the Swedish test case used in this paper to demonstrate the full feedback loop, the set S was defined by 10 (11) volume-classes and 32 (33) age-classes for 36 different “forest types” (four site classes, three species and three owner groups) in all four different regions covering entire country. Volume and age classes are considered to be dynamic, while the factors defining the forest types are static. For details about the forest type definitions see Tab. 1.
Tab. 1 - The static factors defining the forest types in Sweden.
| Owner | State | Private | Company | - | |
|---|---|---|---|---|---|
| Dominating species | Pine | Spruce | Broadleaves | - | |
| Region | Götaland | Svealand | S. Norrland | N. Norrland | |
| Site class (m3 ha-1 year-1) |
1 | < 7 | < 4.4 | < 2.9 | < 2.5 |
| 2 | 7.0 - 8.5 | 4.5 -5.7 | 3.0 - 3.5 | 2.6 - 3.1 | |
| 3 | 8.6 - 10.0 | 5.8 - 7.1 | 3.6 - 4.2 | 3.2 - 3.7 | |
| 4 | ≥ 10.1 | ≥ 7.2 | ≥ 4.3 | ≥ 3.8 | |
Model linkages
In each period the iteration begins with the forest resource model, EFDM, providing the maximal sustainable harvesting level in terms of coniferous and non-coniferous sawlogs and pulpwood to GFTM. However, for countries not (yet) modeled by EFDM, the simpler model mentioned above is used to provide the maximal sustainable harvesting level. Although EFDM provides the supply of timber split in sawlogs and pulpwood, the real proportion is derived in the GFTM depending on the demand for wood-based products and wood pellets ([7]).
Thus, the factual distribution on different assortments of a certain harvested amount is dependent on market conditions (i.e., depending on demand, some sawlogs can be used as pulpwood), and hence derived within the GFTM. However, a possible assortment outcome of the harvest is critical in terms of impact analysis, since it allows identifying the implications for the market of a change in management practices resulting from policy interventions, e.g., a shift from a clear felling regime to continuous cover forest management.
GFTM reaches an equilibrium solution, and it provides, besides other results, the demand for coniferous and non-coniferous sawlogs and pulpwood specified for each country (or global sub-region). The EFDM ingests such demand, and allocates the harvesting activities in the country (or sub-region) to meet the demand for the respective assortment. The new state of the forest resulting from the harvest and other management activities is then calculated, and a new harvest potential is provided, while demand curves are updated using growth projections for gross domestic product (GDP).
Basic outputs of EFDM are the distribution of forest land area into volume and age classes after a time step and the drain per activity during the time step. However, in this application the drains were converted into timber assortments. Thus, for each forest type in the forest resource model, there is an assortment table that provides the outcome in terms of assortments for each state-space cell and activity.
An output (assortment) vector was established for each forest type and activity. Linking these vectors to the activity shifters, the allocation of harvest demand was solved by finding the combination of sub-region, species and activity specific shifters that would yield an outcome close to the demand. The same tables were used to express the potential harvest level, which was established in terms of plain cubic meters, in assortment volumes.
Establishing such an assortment table for a given country requires primarily some information about the theoretical, potential, distribution of assortments in the given forest type volume-age-cell. This theoretical distribution is contingent upon local conditions, besides bio-physical ditto, mainly minimum top-diameter requirements for sawlogs and pulpwood. Thus, the theoretical distribution is then affected by harvesting methods, equipment, and traditions.
Thus, the creation of - as realistic as possible - assortment tables presupposes the involvement of national expertise. In the Swedish test case, these tables were derived from the output of a national forestry planning and analysis system Heureka ([11]), which implies that the tables provide the theoretically possible assortment distribution, rather than the market driven distribution. Hence, we were not able to estimate assortments actually entering the market.
Further, since the forest type definitions are based on dominant species, a fraction of the wood harvested in a coniferous forest type could actually originate from a non-conifer species, and vice versa. This was handled through coefficients expressing the fraction of the volume harvested in a forest type in a certain activity that would be allocated to non-conifer assortments.
The potential harvest level is derived inside the forest resource model as the highest possible (harvest) level that could be sustained for 100 years without significantly decreasing the standing volume. In the test case, the harvest level was allowed to be temporarily 10% lower than the long-term level, and a standing volume 10% lower than the initial one was also accepted. In these calculations, a standard management pattern was assumed and a common shifter was used for all sub-regions, species and activities. In cases where the total sum of all activities for a cell in a state-space would have exceeded 100%, the proportions were adjusted favoring final felling, then thinning, and lastly no management.
Results
Two different sets of model runs were performed. In the first one, the flow between the GFTM and EFDM was specified in assortments, while in the second the split of the harvest potential for Sweden provided by EFDM was done based on historical industrial roundwood removals data. In both cases the GFTM was run on a global scale (48 regions). The simpler growth model mentioned above was used as forest component, except for Sweden for which EFDM was employed. Specifically, the two forest models have been used to provide, for Sweden and for 47 regions, respectively, the harvest potential, and then, after GFTM’s run, to ingest the harvested demand when computing the following period’s harvest potential.
Tab. 2 depicts the maximal sustainable harvesting level - split in coniferous and non-coniferous sawlogs and pulpwood, respectively - derived by the EFDM and ingested by GFTM as upper bounds for the production of wood-based commodities, the resulting demand for sawlogs and pulpwood provided by GFTM as a feedback to EFDM, the harvest potential for the next period, and the ensuing demand for primary products. As the sustainable harvest potentials provided - the initial one as well as the following ones revised in each (five-year) period - are higher than the demand for all assortments, the potentials, in total as well as per assortment, are increasing. There is further a noticeable reduction in the modeled demand for coniferous sawlogs (Csl) over time. The demand for coniferous pulpwood (Cpw) is also slightly reduced, whereas the demand for non-coniferous sawlogs (NCsl) and non-coniferous pulpwood (NCpw) increases.
Tab. 2 - Harvest potential and harvest levels in Sweden as modelled by EFDM and GFTM respectively when assortments are accounted for in EFDM.
| Annual harvest potential (million m3) - EFDM | Annual harvest levels (million m3) - GFTM | ||||||||||
|---|---|---|---|---|---|---|---|---|---|---|---|
| Period | Csl | Cpw | NCsl | NCpw | Sum | Period | Csl | Cpw | NCsl | NCpw | Sum |
| 2010 | 43.1 | 23.9 | 1.1 | 10.1 | 78.2 | 2010 | 36.8 | 23.4 | 0.36 | 3.3 | 64.0 |
| 2011-2015 | 44.2 | 24.9 | 1.3 | 11.4 | 81.8 | 2011-2015 | 36.3 | 23.2 | 0.37 | 3.5 | 63.3 |
| 2016-2020 | 45.5 | 26.0 | 1.4 | 13.0 | 85.9 | 2016-2020 | 35.4 | 23.2 | 0.38 | 3.7 | 62.6 |
| 2021-2025 | 47.4 | 27.5 | 1.6 | 14.1 | 90.6 | 2021-2025 | 34.3 | 23.4 | 0.40 | 3.8 | 62.0 |
Tab. 3 is the correspondent to Tab. 2 for the case where timber assortments are not accounted for, neither when allocating harvesting activities, nor when providing the harvest potential, to GFTM (which in this instance is provided as total industrial roundwood). Harvest potentials, as well as harvest levels, differ from the corresponding ones derived when timber assortments are accounted for in the EFDM. Interestingly, the total harvest potentials obtained after 2010 are higher when the EFDM does not consider timber assortments (Tab. 3), even though total harvest, obtained summing up over all assortments and periods, is higher than the one derived when timber assortments are taken into account.
Tab. 3 - Harvest potential and harvest levels in Sweden as modelled by EFDM and GFTM respectively when assortments are not accounted for in EFDM.
| Annual harvest potential (million m3) - EFDM | Annual harvest levels (million m3) - GFTM | ||||||||
|---|---|---|---|---|---|---|---|---|---|
| Period | Conifers | Non-Conifers | Sum | Period | Csl | Cpw | NCsl | NCpw | Sum |
| 2010 | 67.0 | 11.2 | 78.2 | 2010 | 33.3 | 28.6 | 0.36 | 4.0 | 66.2 |
| 2011-2015 | 70.6 | 12.5 | 83.2 | 2011-2015 | 32.1 | 29.3 | 0.37 | 4.3 | 66.1 |
| 2016-2020 | 72.2 | 14.2 | 86.5 | 2016-2020 | 32.0 | 25.3 | 0.38 | 3.8 | 61.4 |
| 2021-2025 | 78.2 | 15.6 | 93.8 | 2021-2025 | 30.8 | 26.0 | 0.38 | 4.0 | 61.2 |
As regards Sweden, Tab. 4 largely mirrors the information in Tab. 2. Hence, most notable is the slight, gradual reduction in coniferous sawnwood (Csw) production in Sweden, whereas the production of non-coniferous sawnwood (NCsw), plywood (Pw), particle board (Pb), fibreboard (Fb), graphical paper (GP), packaging paper (PP), and household & sanitary paper (HH&SP) remains largely unchanged.
Tab. 4 - Annual production levels of wood-based commodities as modeled by GFTM (m3/tons) when assortments are accounted for in EFDM.
| Year | Assortments | SWE | Fin | Fra | Ger | UK | Russia | Canada | USA | China |
|---|---|---|---|---|---|---|---|---|---|---|
| 2010 | Csw | 17891166 | 9990261 | 7650173 | 21296513 | 3411216 | 29808323 | 38580341 | 38897585 | 18690340 |
| NCsw | 136268 | 77914 | 1535976 | 1041425 | 55645 | 2557317 | 1533942 | 17697594 | 24338855 | |
| Pw | 73469 | 954475 | 270961 | 232503 | 0 | 3035975 | 1795289 | 9345798 | 45544028 | |
| Pb | 491376 | 209131 | 4198261 | 7295367 | 2486826 | 5483644 | 6243751 | 15072684 | 11999835 | |
| Fb | 96849 | 99961 | 1070536 | 4621156 | 706642 | 1700114 | 1274935 | 7601422 | 42658061 | |
| GP | 5169501 | 7252401 | 3573665 | 10171953 | 1627377 | 2456551 | 8575889 | 20477454 | 26900999 | |
| PP | 4997007 | 4380371 | 4426774 | 11571165 | 1824451 | 2859312 | 3333179 | 53547196 | 64693252 | |
| HH&SP | 338698 | 151026 | 701449 | 1312430 | 753204 | 308350 | 621155 | 6577437 | 7871030 | |
| 2015 | Csw | 17613448 | 10454891 | 7946522 | 21940973 | 3516001 | 30608135 | 39661070 | 40128492 | 19320655 |
| NCsw | 139364 | 79269 | 1578847 | 1074507 | 58539 | 2613065 | 1582117 | 18432866 | 25060511 | |
| Pw | 73357 | 938591 | 269989 | 232093 | 0 | 3050455 | 1795732 | 9327121 | 46270246 | |
| Pb | 491338 | 208637 | 4218638 | 7279527 | 2446079 | 5418181 | 6274890 | 14951124 | 12524843 | |
| Fb | 96812 | 99946 | 1071906 | 4680061 | 681143 | 1691143 | 1270790 | 7579650 | 43972106 | |
| GP | 5138924 | 7117461 | 3556903 | 10169209 | 1612282 | 2482819 | 8606936 | 20095269 | 27403120 | |
| PP | 4998955 | 4605787 | 4390459 | 11602165 | 1749151 | 2811079 | 3329248 | 56214207 | 67254192 | |
| HH&SP | 328416 | 147203 | 671764 | 1268612 | 742095 | 307144 | 539614 | 6371646 | 8216248 | |
| 2020 | Csw | 17146123 | 10804002 | 8192772 | 22508058 | 3627119 | 30972095 | 40513646 | 40859709 | 19726795 |
| NCsw | 143975 | 81664 | 1625453 | 1104500 | 62575 | 2675076 | 1627838 | 18965205 | 25446259 | |
| Pw | 73353 | 939525 | 270225 | 232322 | 0 | 3049267 | 1798885 | 9314515 | 46883691 | |
| Pb | 491009 | 208503 | 4232874 | 7286865 | 2403710 | 5370395 | 6293746 | 14744510 | 13067557 | |
| Fb | 96814 | 99946 | 1073666 | 4734449 | 618512 | 1686427 | 1269119 | 7539897 | 44922030 | |
| GP | 5105685 | 7038596 | 3546049 | 10167224 | 1591936 | 2489075 | 8631845 | 19834590 | 27977269 | |
| PP | 5025373 | 4779517 | 4375406 | 11619047 | 1715743 | 2789099 | 3322526 | 58975108 | 69315619 | |
| HH&SP | 325885 | 146453 | 666494 | 1254271 | 737875 | 306784 | 475898 | 6295120 | 8647999 | |
| 2025 | Csw | 16615814 | 11169239 | 8407304 | 22963675 | 3711211 | 31843158 | 42105484 | 42459647 | 19942088 |
| NCsw | 147647 | 83635 | 1664538 | 1132685 | 65427 | 2734833 | 1668134 | 19395230 | 25866740 | |
| Pw | 73355 | 941731 | 270574 | 232699 | 0 | 3061702 | 1806218 | 9306326 | 47754089 | |
| Pb | 490890 | 208364 | 4246859 | 7285879 | 2375692 | 5337334 | 6312012 | 14775913 | 13635293 | |
| Fb | 96830 | 99954 | 1076703 | 4781277 | 605397 | 1683664 | 1268439 | 7594958 | 45976764 | |
| GP | 5101626 | 6964843 | 3549313 | 10236367 | 1579283 | 2502254 | 8674228 | 19724387 | 28832250 | |
| PP | 5112092 | 4974170 | 4370206 | 11733887 | 1690495 | 2771663 | 3337275 | 61884964 | 71632311 | |
| HH&SP | 323360 | 145699 | 660573 | 1241347 | 733691 | 306458 | 430555 | 6332634 | 9180277 |
Tab. 5 is the correspondent to Tab. 4 for the case where timber assortments are not included in the EFDM. There are notable differences in the production figures, not only for Sweden. The most pertinent ones are the lower production levels of coniferous sawnwood in Sweden as compared to the case with assortments, and the correspondingly higher production in some other major producer countries, notably Canada, Germany, the Russian Federation and the USA. The lower production levels of coniferous sawnwood in Sweden can be understood in light of the historically derived coniferous sawlog proportion (53% of industrial conifer roundwood removals) used to split the harvest potential in assortments in these runs, being markedly lower than the one provided by EFDM in the runs considering timber assortments. In turn, this difference is an effect of the method used for creating the assortment tables in EFDM, as discussed in the Materials and Methods.
Tab. 5 - Annual production levels of wood-based commodities as modelled by GFTM (m3/tons) when assortments are not accounted for in EFDM.
| Year | Assortments | SWE | Fin | Fra | Ger | UK | Russia | Canada | USA | China |
|---|---|---|---|---|---|---|---|---|---|---|
| 2010 | Csw | 16101652 | 9998495 | 7646496 | 21287558 | 3410978 | 30055339 | 38910992 | 39089895 | 18782111 |
| NCsw | 135536 | 77876 | 1536404 | 1042435 | 55613 | 2557375 | 1534490 | 17695829 | 24458212 | |
| Pw | 73335 | 951117 | 270940 | 232595 | 0 | 3035771 | 1793802 | 9341244 | 45492572 | |
| Pb | 495274 | 209115 | 4195810 | 7288063 | 2490956 | 5485245 | 6251020 | 15084254 | 12003668 | |
| Fb | 97014 | 99955 | 1070424 | 4621255 | 705052 | 1700720 | 1273878 | 7599439 | 42694519 | |
| GP | 2237600 | 277516 | 940676 | 2184287 | 1191044 | 1930426 | 4414320 | 2938718 | 3200810 | |
| PP | 3237077 | 6903234 | 2621056 | 7929582 | 437980 | 516954 | 4092744 | 17621829 | 23680574 | |
| HH&SP | 5474677 | 7180750 | 3561733 | 10113869 | 1629023 | 2447380 | 8507064 | 20560548 | 26881383 | |
| 2015 | Csw | 15518623 | 10366664 | 7945209 | 22115615 | 3480470 | 31108665 | 40462151 | 41238163 | 19172176 |
| NCsw | 140786 | 80858 | 1591361 | 1079113 | 58869 | 2628029 | 1587061 | 18367543 | 25047255 | |
| Pw | 73307 | 951902 | 271080 | 232837 | 0 | 3040781 | 1795945 | 9348716 | 46163373 | |
| Pb | 495426 | 209000 | 4202394 | 7280168 | 2448638 | 5429498 | 6287536 | 14916988 | 12576422 | |
| Fb | 97046 | 99965 | 1072798 | 4660560 | 691055 | 1691919 | 1274196 | 7617858 | 43816308 | |
| GP | 2244675 | 277559 | 939740 | 2183674 | 1170600 | 1940740 | 4435627 | 2898014 | 3179639 | |
| PP | 3231513 | 6826920 | 2610425 | 7922699 | 435311 | 517211 | 4105476 | 17220457 | 24236125 | |
| HH&SP | 5476188 | 7104480 | 3550164 | 10106373 | 1605911 | 2457951 | 8541103 | 20118472 | 27415764 | |
| 2020 | Csw | 15456829 | 10649399 | 8193185 | 22660135 | 3591802 | 31625195 | 41649087 | 42709744 | 19597124 |
| NCsw | 141717 | 81242 | 1630428 | 1108924 | 62793 | 2685856 | 1632086 | 18840167 | 25592085 | |
| Pw | 73344 | 946500 | 271735 | 233621 | 0 | 3043305 | 1798315 | 9323078 | 46754444 | |
| Pb | 492986 | 208844 | 4225499 | 7288831 | 2394629 | 5375646 | 6312535 | 14919615 | 13128448 | |
| Fb | 96833 | 100112 | 1076199 | 4714963 | 624068 | 1690251 | 1274134 | 7644715 | 44879188 | |
| GP | 2177970 | 278563 | 941347 | 2188777 | 1151904 | 1954488 | 4495804 | 2879520 | 3156562 | |
| PP | 3055120 | 6688678 | 2609079 | 7997080 | 431531 | 517164 | 4136956 | 17060385 | 25014886 | |
| HH&SP | 5233090 | 6967241 | 3550426 | 10185857 | 1583436 | 2471652 | 8632760 | 19939905 | 28171448 | |
| 2025 | Csw | 14872282 | 10788984 | 8361348 | 23165713 | 3676756 | 32613585 | 43168636 | 44591045 | 19738785 |
| NCsw | 140824 | 81113 | 1674163 | 1132742 | 65296 | 2752091 | 1666337 | 19182850 | 26126141 | |
| Pw | 73205 | 939193 | 272180 | 234033 | 0 | 3049225 | 1798960 | 9326797 | 47573242 | |
| Pb | 493707 | 208330 | 4252207 | 7289154 | 2390027 | 5305605 | 6282694 | 15156731 | 13687471 | |
| Fb | 96864 | 100076 | 1077963 | 4775477 | 607504 | 1685641 | 1273474 | 7783891 | 46165785 | |
| GP | 5299748 | 6863950 | 3566658 | 10262072 | 1577570 | 2480779 | 8702434 | 19802305 | 29116289 | |
| PP | 5297963 | 4882189 | 4402852 | 11721879 | 1673043 | 2782419 | 3359900 | 61927002 | 71077891 | |
| HH&SP | 319066 | 143112 | 659400 | 1238082 | 741151 | 306517 | 424868 | 6634601 | 9272372 |
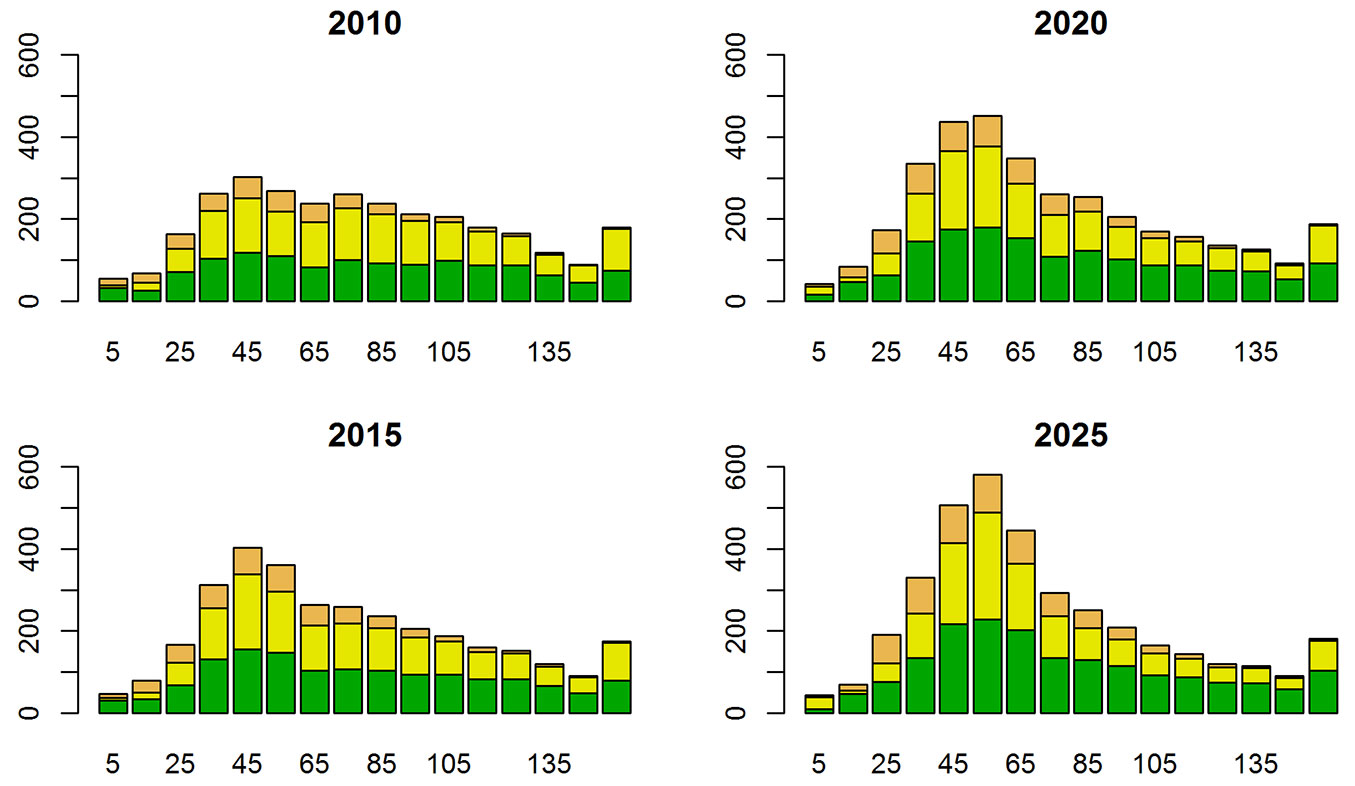
Fig. 2 shows the development of the age class distribution of the growing stock when timber assortments are accounted for by the EFDM. The most notable pattern is the increase in volume in the age classes between 40 and 70 years, which results from a changed area distribution over age-classes and an overtime changing stocking level in the separate age-classes.
Fig. 2 - Age class distribution of the growing stock (million m3) after each simulation step. Green color denotes pine, yellow color denotes spruce, and orange color denotes broadleaved species.
Tab. 6 compares growing stock development when harvests are applied considering timber assortments with the one obtained when the allocation of harvesting activities only accounts for tree species (coniferous and non-coniferous, respectively) and not for timber assortments. The growing stock development differs, mainly as regards coniferous tree species (pine and spruce).
Tab. 6 - The development of growing stock (million m3) by tree species when the harvests are applied with division into timber assortments and without this division.
| Standing volumes - With timber assortments | Standing volumes - Without timber assortments | ||||||||
|---|---|---|---|---|---|---|---|---|---|
| Year | Pine | Spruce | Broadleaves | Sum | Year | Pine | Spruce | Broadleaves | Sum |
| 2010 | 1280 | 1350 | 375 | 3006 | 2010 | 1280 | 1350 | 375 | 3006 |
| 2015 | 1429 | 1341 | 449 | 3219 | 2015 | 1377 | 1399 | 448 | 3224 |
| 2020 | 1583 | 1350 | 530 | 3464 | 2020 | 1480 | 1458 | 530 | 3468 |
| 2025 | 1780 | 1329 | 627 | 3737 | 2025 | 1606 | 1526 | 624 | 3756 |
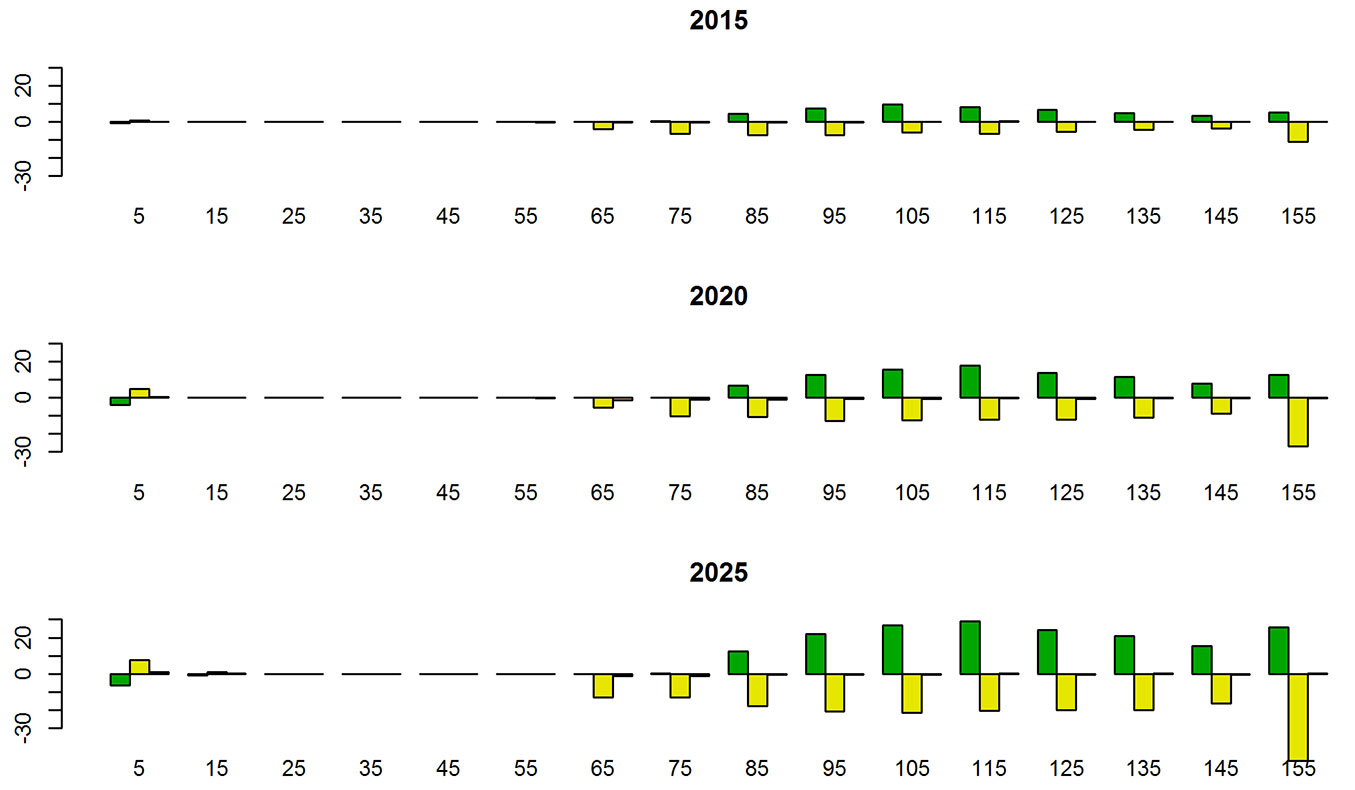
Differences in growing stocks are more pronounced for older age classes, but occur also in the first age classes, for which the effects of final felling and regeneration are visible (Fig. 3). Pines are harvested to a lesser, and spruce to larger, extent when timber assortments are considered. Also for broadleaf species there are, albeit less apparent, differences between the two runs.
Fig. 3 - Differences (million m3) in volume distribution over age classes.
Summary and conclusions
The current study introduces a novel approach for modeling the interaction between wood-based products markets and forest resources, with the aim of providing policy support on a pan-European scale. Specifically, the feedback between a forestry dynamics model (EFDM) and an economic model of the global forest-based sector (GFTM) is elaborated. Besides updating in each period the harvest potential provided by EFDM, contingently upon the demand for primary wood products in GFTM, the suggested framework also takes into account timber assortments when allocating harvest activities.
The outcome of modeling runs indicates that the suggested approach is apt for an integrative modeling of forest resources and wood-based products markets in a pan-European setting. The results also indicate that timber assortments should be considered when modeling this interaction. Hence, accounting for timber assortments in the allocation of harvesting activities over the state-space of EFDM results in different forest states with respect to the case wherein only tree species (coniferous and non-coniferous, respectively) are considered. Further, it also results in different projections of production and trade (and consequently also apparent consumption) of wood-based products. This underscores the importance of a feedback as complete as possible between the forest and the market model.
The EFDM is still under development and a novel method to include also uneven-aged forests within EFDM has recently been developed, and it is currently being tested in a number of countries ([17]). If the case studies prove the validity of the method, the next step in developing the proposed framework will certainly be the expansion of the model coverage, including, besides an increased geographical scope as regards even-aged forests, also short-rotation and uneven-aged forests. In these instances, accounting for timber assortments when linking to a forest-products market models is even more crucial. For example, constants derived from historical removals data used to divide roundwood into assortments are invalidated when applied to timber resulting from drastically different management regimes.
As mentioned above, the allocation of timber potentials and harvests into timber assortments is non-trivial. Ideally, there would be coefficients for each different management activity and forest development state (volume and age class combination) of each forest type. These could be derived from NFI data, but the actual supply of timber assortments from the forest to the markets differs from the theoretical distribution. This information is not recorded by the NFIs, but possibly by the wood-based products industry, or by the contractor conducting harvesting operation. The theoretical coefficients should then be adjusted according to this local, industry-based information. Since these data were not available, in the current analysis we were forced to use the same theoretical coefficients throughout. However, the objective of the study is to construct and demonstrate a well-grounded framework rather than providing quantitative results.
The sustainability criteria used to define the harvest potential of timber assortments were set by means of growing stock and harvest level. The UN General Assembly defines sustainable forest management as a “dynamic and evolving concept, which aims to maintain and enhance the economic, social and environmental values of all types of forests, for the benefit of present and future generations” ([1]). The EFDM has limitations in the sense of not allowing changes between the forest types or land use in the course of a simulation. Only forests available for wood supply were modeled and, therefore, using these strict production-oriented parameters as sustainability criteria is somewhat justified.
In this particular, narrow meaning, sustainability was adhered to, since both the standing volume of forests (Tab. 6) and the annual harvest potential (Tab. 2) increased during the simulation. In addition, the distribution of standing volume covers the entire age distribution. When assessing the supply potential a standard management pattern was used. A larger potential could be found by using more adapted management patterns, but whether this would increase the information content of the potential harvest level is debatable. When meeting the demand for different assortments from GFTM, harvests are allocated over sub-regions and species so as to result in the demanded assortment mix, which could imply that management applied in the simulation steps differs substantially from the program used when assessing the potential.
In the default version of the GFTM, the timber supply potential is split into timber assortments based on historic industrial roundwood removals data from FAOSTAT. Ingesting from the forest resource model the timber supply already allocated into assortments enriches the forest-based sector model. Hence, the market implications of a change in forest management, with an ensuing change in the assortment composition of the timber supply potential, can be modeled with greater detail and realism. Likewise, accounting for timber assortment when allocating harvesting activities in the forest resource model makes it possible to model impacts on forest resources of changing market conditions with greater precision.
Once more, it should be emphasized that in this paper we have deliberately refrained from trying to interpret the results in “real-world” terms, mainly as input data and parameters are still being refined. The purposes of this study is mainly to demonstrate the modeling concept and to assess the linkages between the models. As such, the outcomes of the modeling exercise should be considered with some caution. Hence, they should for example not be seen as detailed forecasts of forest industry developments. Still, already at this stage the modeling approach can be used for scenario analysis, studying directions of change and patterns of causality.
This paper presents a novel concept to model interactions between forest resources and wood-based commodity markets. Of course, there are some aspects that need further elaboration and refinements and we have tried to highlight some of them. Hence, the study has been carried out modeling only one country in the EFDM, to demonstrate the approach and to facilitate the analysis of the results. The outcome of the exercise encourages us to expand the geographical scope of the framework, including more countries in the EFDM. Indeed, the aim is to cover the entire Europe in the elaborated integration. The collection of data needed to reach this aim in terms of coefficients for timber assortments described above constitutes an interesting issue for future research. Another interesting point for future development concerns tree species. Further in the future, the concept should be developed for uneven-aged and short-rotation forest management.
The modeling results of this study indicate that the division into timber assortments has a species-specific impact on harvest allocation. Thus, the explicit consideration of timber assortments affected the propensity of harvesting spruce and pine respectively. At the moment, for Sweden, EFDM is considering three species groups (pine/spruce/broadleaves), while the GFTM currently recognizes only two (conifers/ non-conifers). Having the same detail as to tree species in both models should enhance the dynamics of the model linkage.
A strength of the proposed modeling set-up is that it can be used for analysis with a pan-European (or even global) scope while still being developed. Hence, depending on the current data availability, it is possible to perform in depth analysis for countries where more detailed data sets exist - e.g., as to the impact of a change in forest management regime and corresponding potential timber assortment mix for the provision of wood-based products and forest resource development in a specific country - at the same time as providing assessment on a more general level, e.g., regarding trade implications of a policy change on a pan-European level. In the latter case, the simplified approach as regards forest resource modeling is used for countries where detailed data sets are missing. An important aspect to highlight is that the modeling framework should be developed in close cooperation with national expertise.
A general problem, one which we share with other forest sector modeling enterprises, is that of poor, or at least uncertain, data quality in a number of different respects; from increment rates and growing stocks to input/output coefficients. Hence, an important aspect to highlight is that the modeling framework should be developed in close cooperation with national expertise. This entails, besides provision and assessment of data, also validation of modeling results. Part of this work could possibly be conducted under the auspices of the Forest Information System for Europe (FISE), recently established to support the EU Forest Strategy ([4]).
List of abbreviations
The following abbreviations were used throughout the paper:
- GFPM: Global Forest Products Model
- EFI-GTM: European Forest Institute Global Trade Model
- SSPs: Shared Socioeconomic Pathways
- Csl: Coniferous sawlogs
- Cpw: Coniferous pulpwood
- NCsl: Non-coniferous sawlogs
- NCpw: Non-coniferous pulpwood
- NFI: National Forest Inventory
- Csw: Coniferous sawnwood production
- NCsw: Non-coniferous sawnwood production
- Pw: Plywood production
- Pb: Particle board production
- Fb: Fibreboard production
- GP: Graphical paper production
- PP: Packaging paper production
- HH&SP: Household & sanitary paper production
Conflicts of interest
The authors declare no conflict of interest. The opinions expressed herein are those of the authors and do not necessarily reflect the views of the European Commission.
References
Gscholar
Gscholar
Gscholar
Gscholar
Gscholar
Online | Gscholar
Gscholar
Authors’ Info
Authors’ Affiliation
Francesca Rinaldi
Minna Räty
Ola Sallnäs
European Commission, Joint Research Centre (JRC), Institute for Environment and Sustainability (IES), Forest Resources and Climate Unit, v. E. Fermi 2749, I-21027 Ispra (Italy)
Corresponding author
Paper Info
Citation
Jonsson R, Rinaldi F, Räty M, Sallnäs O (2016). Integrating forest-based industry and forest resource modeling. iForest 9: 743-750. - doi: 10.3832/ifor1961-009
Academic Editor
Luca Salvati
Paper history
Received: Dec 21, 2015
Accepted: Jul 01, 2016
First online: Aug 12, 2016
Publication Date: Oct 13, 2016
Publication Time: 1.40 months
Copyright Information
© SISEF - The Italian Society of Silviculture and Forest Ecology 2016
Open Access
This article is distributed under the terms of the Creative Commons Attribution-Non Commercial 4.0 International (https://creativecommons.org/licenses/by-nc/4.0/), which permits unrestricted use, distribution, and reproduction in any medium, provided you give appropriate credit to the original author(s) and the source, provide a link to the Creative Commons license, and indicate if changes were made.

Web Metrics
Breakdown by View Type
Article Usage
Total Article Views: 51596
(from publication date up to now)
Breakdown by View Type
HTML Page Views: 42119
Abstract Page Views: 3753
PDF Downloads: 4260
Citation/Reference Downloads: 73
XML Downloads: 1391
Web Metrics
Days since publication: 3626
Overall contacts: 51596
Avg. contacts per week: 99.61
Article Citations
Article citations are based on data periodically collected from the Clarivate Web of Science web site
(last update: Mar 2025)
Total number of cites (since 2016): 11
Average cites per year: 1.10
Publication Metrics
by Dimensions ©
Articles citing this article
List of the papers citing this article based on CrossRef Cited-by.
Related Contents
iForest Similar Articles
Review Papers
Pathways to increase supply of sustainable wood from planted forests and trees to address bioeconomy needs: a review
vol. 19, pp. 168-185 (online: 12 May 2026)
Technical Reports
Regulation and future prospects of the Italian voluntary forestry carbon credit market
vol. 19, pp. 219-225 (online: 08 June 2026)
Review Papers
Comparative assessment for biogenic carbon accounting methods in carbon footprint of products: a review study for construction materials based on forest products
vol. 10, pp. 815-823 (online: 25 September 2017)
Research Articles
Outlook of the European forest-based sector: forest growth, harvest demand, wood-product markets, and forest carbon dynamics implications
vol. 11, pp. 315-328 (online: 18 April 2018)
Research Articles
Exploring the potential behavior of consumers towards transgenic forest products: the Greek experience
vol. 8, pp. 707-713 (online: 13 January 2015)
Review Papers
Wood modification technologies - a review
vol. 10, pp. 895-908 (online: 01 December 2017)
Commentaries & Perspectives
Key information for forest policy decision-making - Does current reporting on forests and forestry reflect forest discourses?
vol. 16, pp. 325-333 (online: 15 November 2023)
Research Articles
Improving sustainability in wood coating: testing lignin and cellulose nanocrystals as additives to commercial acrylic wood coatings for bio-building
vol. 14, pp. 499-507 (online: 11 November 2021)
Research Articles
NIR-based models for estimating selected physical and chemical wood properties from fast-growing plantations
vol. 15, pp. 372-380 (online: 05 October 2022)
Research Articles
Interaction between planting spacing and wood properties of Eucalyptus clones grown in short rotation
vol. 14, pp. 12-17 (online: 02 January 2021)
iForest Database Search
Search By Author
Search By Keyword
Google Scholar Search
Citing Articles
Search By Author
Search By Keywords
PubMed Search
Search By Author
Search By Keyword


