Outlook of the European forest-based sector: forest growth, harvest demand, wood-product markets, and forest carbon dynamics implications
iForest - Biogeosciences and Forestry, Volume 11, Issue 2, Pages 315-328 (2018)
doi: https://doi.org/10.3832/ifor2636-011
Published: Apr 18, 2018 - Copyright © 2018 SISEF
Research Articles
Abstract
A comprehensive assessment of European forest-based biomass harvest potentials, their future utilization and implications on international wood product markets and forest carbon dynamics requires the capability to model forest resource development as well as global markets for wood-based commodities with sufficient geographical and product detail and, most importantly, their interactions. To this aim, we apply a model framework fully integrating a European forest resource model and a global economic forest sector model. In a business-as-usual (BaU) scenario, European Union harvests increase seven percent by 2030 compared to past levels (485 million m3 on 2000-2012 average and 517 million m3 in 2030). The subsequent annual carbon stock change is a ten percent reduction by 2030 compared to 2000-2012 average (equal to 119.3 Tg C yr-1), corresponding to decreasing carbon-dioxide removal by the European forests. A second, high mobilization scenario (HM), characterized by the full utilization of the potential wood supply and a doubling of EU wood pellets consumption, was designed to explore potential impacts on forest carbon dynamics and international wood product markets under intensive exploitation of biomass resources. In the HM scenario, harvest increases by 55% (754 million m3 in 2030) compared to the BaU scenario. Fuelwood accounts for this increase in harvest levels as overall competition effects from increased wood pellets consumption outweighs synergies for material uses of wood, resulting in slightly reduced harvests of industrial roundwood. As expected, this increasing harvest level would significantly impair carbon-dioxide forest sequestration from the atmosphere in the medium term (-83% in 2030, compared to 2000-2012 average).
Keywords
Biomass, Carbon Stock Change, Forest, Fuelwood, Harvest, Wood-based Products
Introduction
The forest-based sector plays an essential role within the European bioeconomy, as a source of renewable materials and energy, substituting for non-renewable materials and products and fossil-based energy ([49]). It is also essential for climate change mitigation through the sequestration of carbon in forests and in harvested wood products ([35], [25]). The EU has an ambitious target of achieving at least a 27% share of renewable energy consumption by 2030 ([12]), which has resulted in a surge in the consumption of woody biomass for energy.
Forest biomass is currently the most important source of renewable energy, accounting for around half of the EU’s total renewable energy consumption ([11]). In particular, wood pellets have experienced a rapid growth: imported solid biofuels - largely composed of wood pellets - generated about 7% of all primary energy production from solid biofuels in the EU in 2013 ([15]). By 2015, EU28 accounted for 51% of global wood pellets production, while the EU28 share of the global wood pellets apparent consumption (i.e., production plus net imports) of 27.5 million tons was a staggering 75% ([16]). There are important interdependencies between wood pellets and wood-based products markets. While competing for the same feedstocks - roundwood as well as sawmilling byproducts - in the production, the demand for reconstituted wood-based panels, pulp and paper, and wood pellets is interdependently linked to the demand for sawnwood which is driving sawnwood production ([3], [28], [26], [31]).
The importance of forests and their products/services has resulted in a number of studies assessing woody biomass potential - mainly focusing on energy uses - at global ([53], [1], [37]), but above all European level ([10], [8], [9], [39], [2], [57]). With the exception of Lauri et al. ([37]) - using partial equilibrium modelling to assess the volume of woody biomass available for large-scale energy production at various hypothetical energy wood prices - these studies apply a resource-focused approach to derive woody biomass supply potentials. The European Forest Information Scenario (EFISCEN) model, based on national forest inventory data, was used to project possible future developments of forest resources in EEA ([8], [9]), Nabuurs et al. ([39]) and Verkerk et al. ([57]), while the other studies mentioned above relied on statistical analysis of international data sets (from FAO or Forest Europe).
Several studies have assessed the impact of an increased use of wood for energy on the forest-based sector, mainly with a regional focus ([24] for USA, [55] for Europe, and [36], [38], [13], [20], and [21] for the EU), but some also with a global scope ([48], [6], [26], [31]). Buongiorno et al. ([6]), Ince et al. ([24]), Lauri et al. ([36]), Moiseyev et al. ([38]), Forsell et al. ([20]), Johnston & Van Kooten ([26]), and Jonsson & Rinaldi ([31]) focus on economic implications. UN ([55]) mainly addresses impacts on forest resources, while European Commission ([13]) and Frank et al. ([21]) emphasize consequences in terms of greenhouse gas (GHG) flows. Apart from Johnston & Van Kooten ([26]), Forsell et al. ([20]) and Jonsson & Rinaldi ([31]), all these studies consider broad, generic, categories of energy wood, thereby failing to account for the intricate interlinkages between wood pellets and wood-based products markets. Further, Forsell et al. ([20]) only consider EU imports of wood pellets, thereby not fully assessing synergies and competition between wood pellets and wood-based products markets. Johnston & Van Kooten ([26]) also lack in detail as to the modelling of wood-based products markets, geographical scope, and forest resources. Since harvest demand is the main factor driving the short-term forest carbon sink (at least at EU level - [44]), and this is in turn driven by wood-based and energy wood markets, a joint analysis of these two sectors is an essential prerequisite for quantifying the climate change mitigation potential of the forest sector.
In this paper, our aim is to build up a modelling framework that includes a detailed analysis of European forest resources and their link with the forest carbon dynamic, taking into account their interactions with the international wood product markets. Such a comprehensive assessment of forest-based biomass potentials and their possible utilization requires a detailed appraisal of (i) the maximum sustainable woody biomass harvest potential for material and energy uses, as well as an analysis of the impacts on (ii) forest resources and forest carbon dynamics and on (iii) international wood-based product markets. This in turn requires the capability to model international markets for wood-based products as well as forest resource development and carbon dynamics, and, most importantly, their interaction, with sufficient detail.
To this end, this study elaborates the full interaction between a forest resource model and an economic forest-based sector model. Though the modelling set up has a European focus as regards forest resources, we fully consider market implications at global level. First, the future maximum potential supply of wood to 2030 derived with the forest resource model is used to constrain the use of roundwood for the production of wood-based products and pellets in the economic forest-based sector model. Then the economic model, after having reached a market equilibrium, provides the demand for wood raw material to the forest resource model, which uses this “actual harvest level” to model the evolution of forest resources and for the computation of next period’s harvest potential, including wood for energy.
Materials and methods
The Carbon Budget Model (CBM)
The CBM ([34]) is an inventory-based, yield-data driven model that simulates the stand- and landscape-level C dynamics of above- and below-ground biomass, dead organic matter (DOM: litter and dead wood) and mineral soil ([34]). The model has been applied to 26 EU countries, using National Forest Inventories (NFIs) input data, in order to estimate the EU forest C dynamic from 2000 to 2012, including the effect of natural disturbances and land use change ([43], [44]). The CBM provides one-year time step projections of C stocks and fluxes, such as the annual C transfers between pools, from pools to the atmosphere and to the forest product sector.
In this study, we use CBM to estimate, at country level, maximum wood supply (MWS), forest carbon dynamic for the historical period (2000-2012), and for two scenarios up to 2030. We define the MWS as the amount of wood available under applicable silvicultural practices, without decreasing the growing stock level in the forest area available for wood supply (FAWS). The fraction of industrial roundwood (IRW) derived from this amount is provided to the economic forest-based sector model and acts as a constraint to the demands of wood for material use, as estimated by GFTM.
The MWS, up to 2030, is estimated assuming that all the net increment of the merchantable living biomass (i.e., the biomass provided by the stems and main branches) available on the FAWS can be harvested applying current silvicultural practices. This implies that the living biomass pool is in equilibrium (i.e., neither a source nor a sink of C for the atmosphere) and that the current stock of living biomass for the FAWS remains constant until the end of the outlook. Over the outlook period, the stock of living biomass, for the FAWS, might increase slightly if, according to the current silvicultural rules, a certain amount of biomass cannot be removed (for example because a minimum rotation length is prescribed at national level). It might also decrease if the age structure is unbalanced towards old age classes. Silvicultural practices applied with CBM include a set of treatments (i.e., thinning, clear-cuts, salvage loggings, etc.) defined, for each country and forest type (FT, i.e., the main species reported by NFIs), as minimum rotation lengths for the final cut, minimum age for thinning, etc. (see [43] for further details). During harvest operations, an additional amount of biomass is also removed, i.e., branches and dead wood (referred to as Other Wood Components - OWCs), however excluding any stump removal. This amount has been estimated applying the same conditions (i.e., share of OWCs with respect to harvest) observed in the historical period (2000-2012).
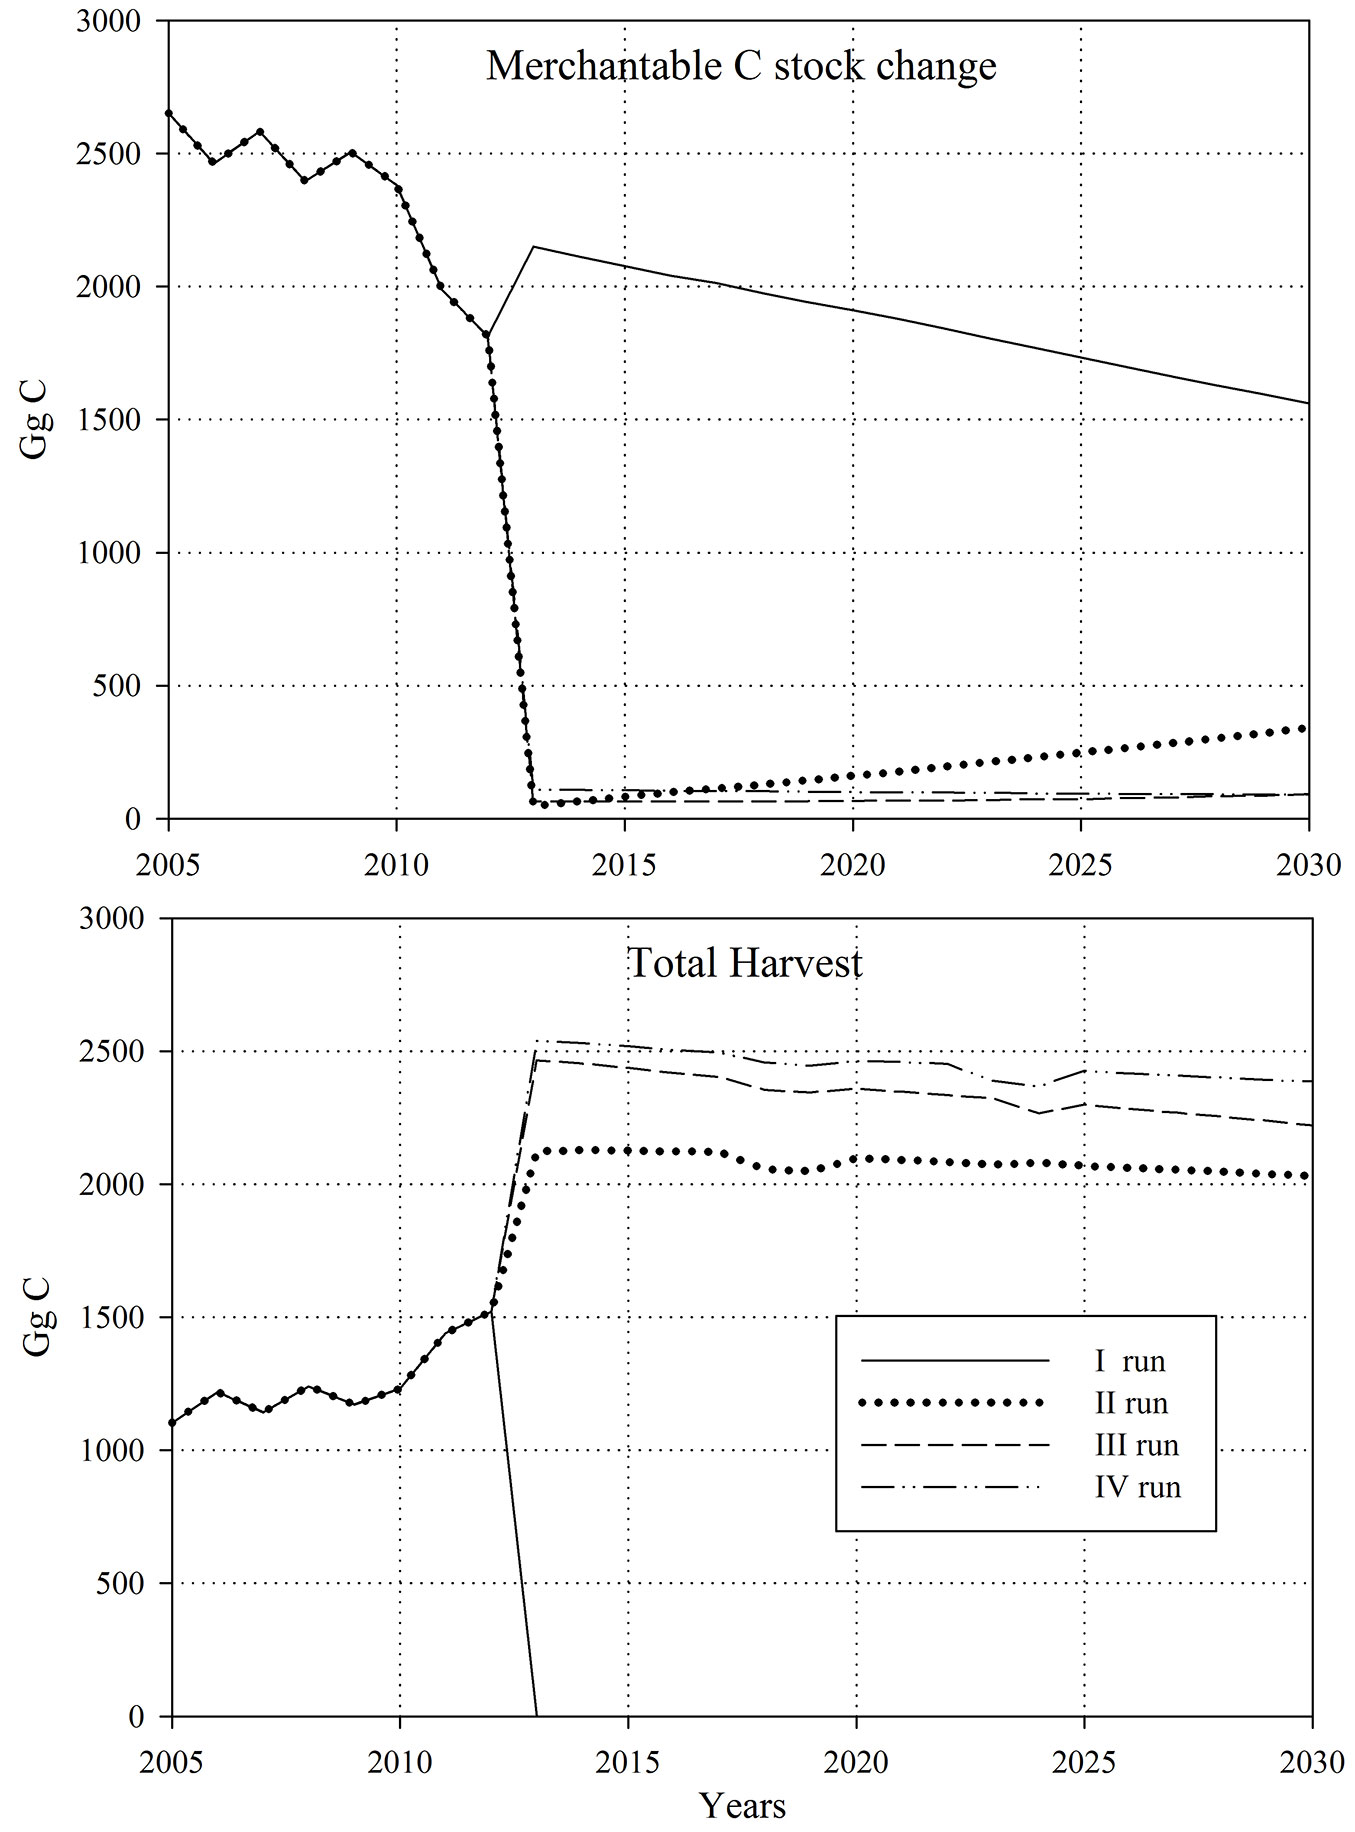
To estimate the MWS, it is necessary to run the model sequentially in order to account for the multiple dependencies and interactions among all the factors included. Hence, in an iterative process, merchantable C stock change (i.e., the output of each run) is used as input (i.e., harvest) to the subsequent run (Fig. 1 provides an example of this sequence). In the first run, we applied the historical harvest rate for 2000-2012 and no harvest for the following period. Based on this run, we have then estimated the C stock change of the merchantable living biomass from 2013 to 2030, with an intermediate step in 2020, based on the actual harvest provided by GFTM. This amount represents the harvest demand to be applied to a second model run. The C stock change resulting after this second run has been used to correct the previous harvest for a new run. These corrections, accounting for possible over- or under-estimates of the C stock change, are mainly due to the effect of the clear-cuts applied during each run on the age class distribution and on the C stock change. This approach has been repeated, for each country, until the delta C stock change of the merchantable biomass component, estimated at country level, resulted negligible (i.e., until the C stock change was lower than the maximum amount of C removed), usually after three iterations. Finally, the resulting maximum harvestable C estimated by CBM has been converted to harvestable m3 per ha (using species-specific wood densities factors), for each country and region.
Fig. 1 - Example of the sequence of model’s runs applied by CBM to estimate the MWS in each country. The merchantable C stock change estimated after the first run (upper panel), assuming no harvest from 2013 to 2030 (lower panel), was applied as harvest demand for the second run. The C stock change resulting from this second run was used to correct the previous harvest amount for the third run. The iteration continues until the change in C stock is negligible.
The extent of the forest area available for wood supply (FAWS) and the area not available for wood supply (FnAWS) originated from the Territorial Modelling Platform LUISA ([17], [4]). Here, the assessment of FAWS and FnAWS refers to 2010, and it is based on physical (e.g., slope and accessibility) and legal (e.g., protected areas) constraints at country and regional level. According to the specific scenario assumptions, LUISA simulates the temporal evolution of forest areas (afforestation and deforestation) up to 2050. Forest areas reported by LUISA for 2010 (Reference Scenario) are assumed to remain constant during CBM’s runs (see Tab. S1 in Supplementary material). The rationale is that the potential harvest provided by plantations and natural expansion of existing forests eventually occurring from 2010 to 2030 is negligible compared to the harvest provided by existing forests ([44]). Through the LUISA platform, FAWS were further distinguished between forest area fully available for wood supply (FAWSt) and forest area partially available for wood supply (FAWSp). In the FAWSt no legal nor physical restriction limits the possible silvicultural practices applied at local level, whereas in the FAWSp some legal (i.e., due to protected forest areas management policies) or physical (i.e., due to the slope) restrictions are present.
Among the different silvicultural treatments considered in CBM, we have assumed that clear-cuts are restricted to FAWSt because of their well-known major impact on forest functions (i.e., on the environmental and protective forest services). The other silvicultural treatments (including different types of thinning and partial-cuts systems) have been applied both on the FAWSt and on the FAWSp. No silvicultural treatment has been applied to the FnAWS. These criteria allowed differentiating in CBM the silvicultural treatments according to the geophysical, environmental and legal constraints spatially defined in LUISA.
To implement these assumptions, we have scaled and distributed the original NFI area used by CBM proportionally to the three categories identified by LUISA (i.e., FAWSt, FAWSp and FnAWS). Based on our current modelling framework, as well as on the information generally provided by the NFIs, we have not considered any mixed forest types (i.e., all the FTs have been assumed as being predominantly constituted by coniferous or broadleaves species). Therefore, the area reported by LUISA as mixed forests (this category derives from the original classification system used by CORINE) has been proportionally distributed between broadleaves and conifers FTs.
Thus, we could differentiate the maximum harvestable wood volume for each country between the amount potentially provided by the FAWSt and the amount potentially provided by the FAWSp. This amount includes both the merchantable biomass (i.e., stems) that can be used for the production of wood-based commodities and OWCs, typically used as wood for energy. The model also estimated the amount of primary forest residues left in the forest (i.e., the amount of biomass felled, but not removed).
Finally, at the end of the modelling exercise, CBM is used to assess the C stock change of each country, using total harvest as the main input. Results are further disaggregated into FAWS and FnAWS and into C pools (i.e., living biomass, DOM and soil). For 2000-2012, we have applied the historical amount of harvest defined in Pilli et al. ([42]), and we have included the effect of the main natural disturbances (mainly windstorm and fire) as reported in Pilli et al. ([43]). While harvest up to 2030 is derived from interactions with GFTM and including an estimate of harvest for fuelwood, according to the scenario, as detailed in the subsequent sections.
The Global Forest Trade Model (GFTM)
The Global Forest Trade Model ([29], [30], [31]) is an equilibrium model for the forest-based sector modelling consumption, production and international trade of wood-based products and pellets at pan-European level under different scenarios. GFTM covers 48 sub-regions of the world. GFTM shares with other similar models, notably the Global Forest Products Model (GFPM - [5]) and the European Forest Institute Global Trade Model (EFI-GTM - [32]), the theoretical foundation based on spatial equilibrium theory in competitive markets for several commodities ([51]). Specifically, the model is based on the maximization of the whole forest sector welfare (consumer, primary/industrial products-producers and traders), subject to feasibility, resources, productivity and equilibrium constraints. Similarly to the GFPM and the EFI-GTM, the GFTM is static in the sense that given a certain number of iterations (i.e., the number of periods one wants to project), the optimal welfare is computed at each iteration with imperfect foresight. Once a solution is reached, the parameters of the model are updated based on endogenous (harvest levels) and exogenous (GDP growth) drivers, new resources and productivity constraints are set, and a new iteration begins.
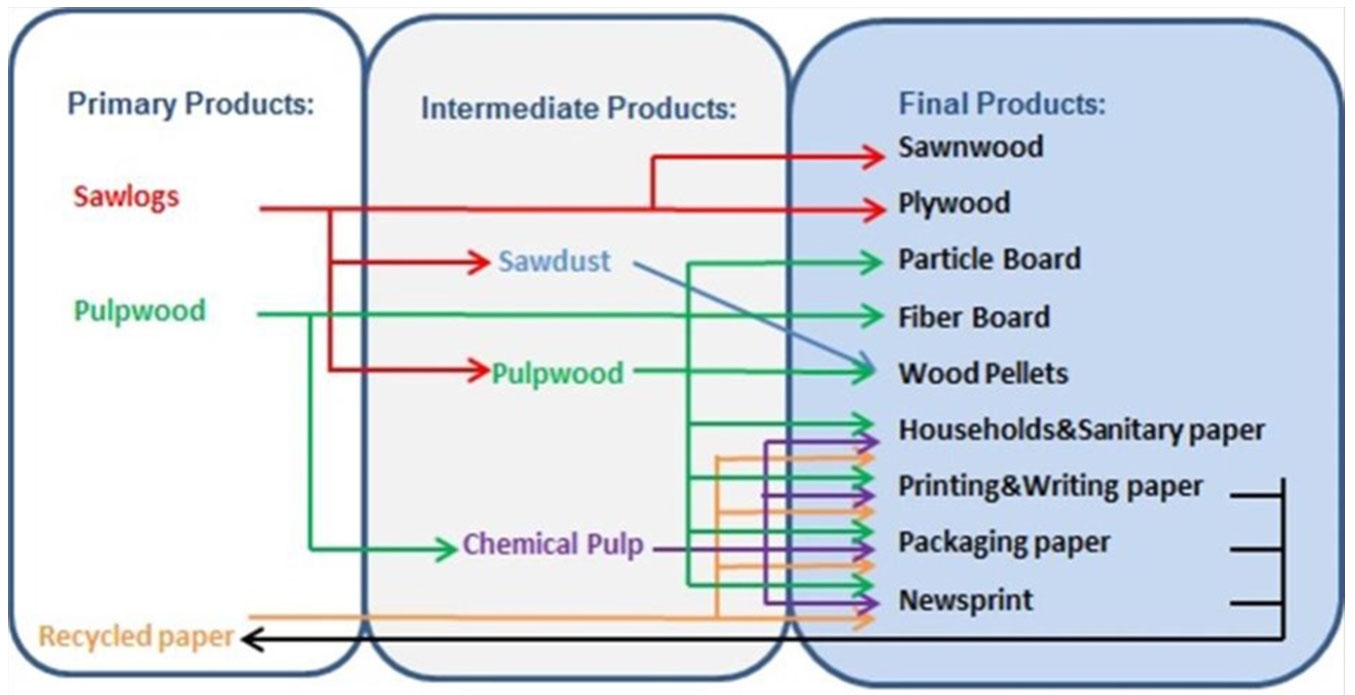
GFTM covers ten final products, four intermediate products, and four primary products (Fig. 2). For each category, GFTM derives a series of outputs, including modelling outcomes of: (i) consumption, production and net trade levels for final products; (ii) harvested, industrially processed and net traded quantities for primary products; and (iii) produced and traded quantities for intermediate products. GFTM uses as starting values for produced and traded quantities corresponding data derived from FAOSTAT for the year 2014. The supply/availability of local intermediate and final products is determined in the transformation process simulated by the industry module of the GFTM. Thus, the transformation of products implicit in the production process is represented in GFTM by country-specific industry matrices, whose number of columns equalizes the number of produced products (intermediate and final), the number of rows is the total number of products, and the matrix coefficients are equal to the conversion factors for production.
Fig. 2 - Industry module of the GFTM.
GFTM has been set up focusing on wood-based commodities that are traded in significant amounts. The reason for this choice is technical, in that the mathematical formulation of GFTM largely relies on matrixes and linear algebra, requiring the different wood-based products to be homogeneous in the sense of industrially processed and traded. At the moment fuelwood is excluded from the analysis for two reasons. First of all, fuelwood is traded across borders to a limited extent, in particular considering extra-EU trade. Secondly, good quality data regarding fuelwood are scarce. The poor quality of data for fuelwood - a heterogeneous commodity comprising not only roundwood but also tree tops and branches - is to a large extent the consequence of large quantities being harvested and used by non-industrial private forest owners themselves, without entering a formal market ([31]).
Input/output coefficients used derive from various sources: Kallio et al. ([33]), Fonseca ([18]) and Saal ([50]) for wood-based products, and IEA Bioenergy Task 40 ([23]) for wood pellets. The transformation process simulated in GFTM by means of the industry module is depicted in Fig. 2. The input-output representation through industry matrices, a standard tool in economic theory, is convenient since it allows accounting for the possible interrelationships among the various products. Specifically, here, it allows the modeling of the interdependencies, intended both as competitions and complementarities, between wood pellets and wood-based products. The reason for pulpwood being depicted as a primary as well as an intermediate products is due to the circumstance that wood chips resulting from sawmilling and plywood production (intermediate pulpwood) have the same uses as (primary) pulpwood. In GFTM, wood pellets is produced from roundwood (pulpwood) and industrial byproducts - wood chips (intermediate pulpwood) and sawdust (see Fig. 2).
Wood-based products price and GDP elasticities of demand derive from Jonsson ([27]) for Europe, while for non-European countries and sub-regions GFTM uses the same elasticities as in GFPM ([5]). Since wood pellets received a unique harmonized trade code only as late as 2012, there is no comprehensive time series data. Thus, for wood pellets, price and GDP demand elasticities were estimated through time-series cross-sectional analysis performed on data for (i) household consumption in Austria, Germany, Italy, and Sweden, and (ii) imports of pellets for industrial use to Belgium, Denmark, Finland, Netherlands, and the UK. These elasticities are then applied for countries where the consumption of wood pellets is deemed to be dominated by household or industrial use respectively, while for countries where both uses are significant, weighted elasticities are set based on assessment of the quantity share of respective user category. Unit transportation costs in GFTM are the same as the ones of the GFPM ([5]), with the exception of those for wood pellets, which are based on Sikkema et al. ([52]).
CBM estimates the MWS under a constant standing carbon stock assumption until 2020 and until 2030. The volumes of coniferous and non-coniferous IRW based on this values - further divided in sawlogs and pulpwood based on FAOSTAT production data series - are ingested by GFTM as upper bounds for the provision of coniferous and non-coniferous sawlogs and pulpwood respectively, used for producing wood-based commodities and wood pellets in each country. As for the cost of roundwood supply, the (upward) slope of the cost curves of GFTM depends solely on the price elasticity of timber supply. For the starting period, the timber supply shift parameter is derived from actual data for sawlogs and pulpwood removals, and prices of sawlogs and pulpwood. The supply shifter is updated from period to period (i.e., until 2020 and from 2021 to 2030), based on growing stock development as provided by CBM. Timber supply price elasticities used by GFTM draw on Kallio et al. ([33]). After reaching a market equilibrium, GFTM subsequently provides the demand for wood raw material to CBM, which uses this “actual harvest level” for IRW to model the development of forest resources and for the computation of next period’s harvest potential (i.e., from 2021 to 2030).
For countries not covered by CBM (all non-EU countries or global sub-regions), the potential timber supply is derived from data on growing stock and increments, compiled from various sources: the Global Forest Resources Assessment (⇒ http://www.fao.org/forest-resources-assessment/explore-data/flude/en/), the State of Europe’s Forests (⇒ http://www.foresteurope.org/docs/SoeF2015/OUTPUTTABLES.pdf), and the European Forest Data Centre (⇒ http://forest.jrc.ec.europa.eu/efdac/). In these latter cases, annual potential harvest levels are set equal to annual increment. Then, the same as for the input from CBM, these volumes are divided into sawlogs and pulpwood based on FAOSTAT production data series. GFTM derives the market equilibrium, and the growing stocks (coniferous and non-coniferous, respectively) are updated based on the resulting demand for primary products in non-CBM countries and global sub-regions.
Scenario descriptions
Scenario analysis concerns the development of alternative visions of the future. A key objective is to extend thinking in terms of length of time (e.g., beyond five to ten years into the future) and breadth (e.g., across a range of possible futures - [7]). Scenario analysis describing futures that could be, rather than futures that will be ([56]), is an apt future studies method when forecasting capabilities decline, i.e., uncertainties start to dominate over predetermined processes ([46]). In a broad meaning this is how we perceive our scenarios, useful for setting the scene for “what-if” reasoning, providing the basis for discussing potential trade-offs and synergies in the utilization of forest-based biomass. Thus, while biophysical patterns underlying forest resource modelling are predetermined to a considerable degree, at least in the medium term, the development of wood-based commodity markets are fraught with considerable uncertainty. Hence, though some elements of our modelling set up, related to the CBM, can be regarded as projections, the overall outcomes of the modelling framework are to be considered as scenarios.
Taking into account this premise, this study encompasses two scenarios: (i) a business-as-usual scenario (BaU), where no major deviations from current market developments and utilization of forest resources are foreseen; and (ii) a high mobilization scenario (HM), envisioning the full utilization of the potential wood supply due to an increasing use of wood resources for energy.
Business as usual (BaU) scenario
In the BaU scenario, IRW harvests - within the bounds of forests available for wood supply (FAWS) - as well as the supply and demand of all processed wood-based products are determined exclusively by market forces as modelled by GFTM. Production, trade and apparent consumption of all wood-based commodities, pellets included, and thereby also the ensuing demand for IRW, are thus derived by GFTM as solutions to the welfare-optimization problem under resource, technology and equilibrium constraints, without the addition of any further exogenous assumption. In this scenario, GFTM first provides the amount of IRW for 2015 and 2020 (estimated as the average of a 5 years span period), based on the MWS estimated by CBM from 2013 to 2020. Using this last value as input to set the IRW harvest demand for 2020 and adding the corresponding demand for FW, CBM estimates the MWS for 2021-2030. Based on this last value, GFTM assesses the demand for IRW for 2025 and 2030. The gap periods, from 2013 to 2019, 2021 to 2024 and 2026 to 2029, have been filled through a linear interpolation between the starting and ending points.
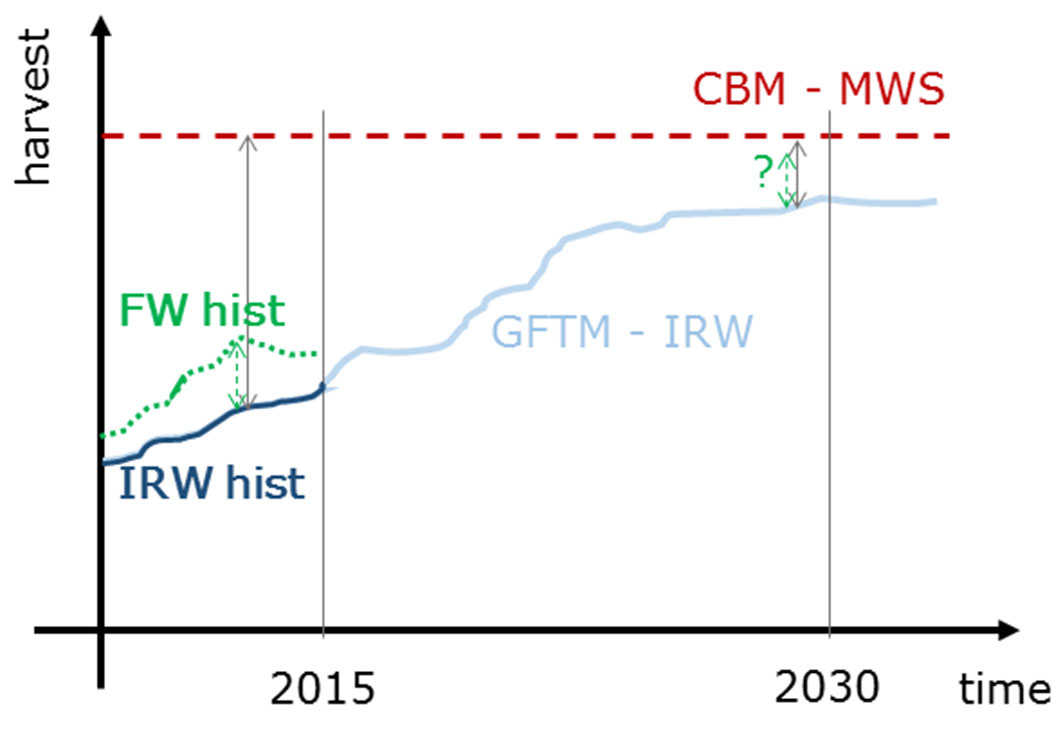
The fuelwood component (FW) is not included in the economic model, mainly due to scarce availability of good-quality, reliable data ([47]). Instead, FW harvesting in the BaU is assumed to continue following current trends. We estimated the amount of FW according to the historical share of IRW and FW, as resulting in CBM runs until 2012, based on ancillary data provided by FAOSTAT for the same period and for each country (Fig. 3).
Fig. 3 - Relationships between the quantities used in the estimation of FW (generic example applicable to each country). The MWS estimated with CBM is the red dotted line (CBM - MWS). The relationship of this amount with historical FW and IRW (derived from FAOSTAT) has been used to estimate the projected (post-2015) FW from CBM - MWS and GFTM - IRW projections.
At country level, fuelwood can be estimated as the sum of two quantities: (i) branches and tops removed when harvesting for IRW (FWtbranches); and (ii) stemwood (and related OWCs) harvested with dedicated silvicultural operations (Fwtstem), such as, e.g., the management of coppices or pre-commercial thinning in high-forests. The total amount of fuelwood (FWt) at time t can thus be expressed as (eqn. 1):
The first quantity FWtbranches is a fraction of the amount of IRW removed in year t, as determined by CBM, during the historical period (eqn. 2):
For the BaU scenario, we applied this factor to the amount of IRW determined by GFTM.
The second component FWtstem is made of conifers and broadleaves stemwood, and related OWCs, harvested with dedicated silvicultural operations. Intuitively, the more is available in the forest after having satisfied the demand for IRW, the higher the harvest for FW could be. Therefore, this amount is inferred from the ratio between the average amount of stem used as FW for the historical period Fhiststem, and the maximum amount of stem for fuelwood, potentially available (dashed arrow in Fig. 3). For 2000-2012, this fraction (Fhiststem) is equal to (eqn. 3):
where for each country Fhiststem is the average amount of stem used as FW, for 2000-2012; MWShist is the theoretical maximum wood supply for the historical period, derived from the value estimated from 2013 and IRWhist is the average amount of IRW removed during the same period. For the BaU scenario, assuming that this fraction remains constant, the FWtstem component, has been estimated as (eqn. 4):
where MWSt is the maximum wood supply and is estimated with CBM for each year t and country, and the harvest demand IRWt is estimated with GFTM for 2015, 2020 and 2030 and through a linear interpolation for the remaining years.
High mobilization (HM) scenario
The high mobilization scenario (HM) is designed to explore system boundaries, assessing potential market adjustments and forest resource implications and impacts under intensive exploitation of biomass resources. The HM differs from the BaU in two ways. First, there is no feedback from GFTM in terms of harvest demand, as we assume that the MWS is fully used for material and/or energy purposes. In addition, consumption of wood-pellets within the EU as a whole is set to increase gradually, reaching a level by 2030 twice as high as that of 2015. We assume an (approximately) even split of the increase in consumption on the three periods: 2015-2020, 2020-2025, and 2025-2030. This implies that the projected level of pellets consumption in 2020 among EU 28 countries is exogenously forced to be at least 26 million tons, 33 million tons by 2025, and 40 million tons by 2030. We deem this increase, though steep, as being within the realms of the possible. Expert assessments as to EU wood pellets consumption vary considerably, from conservative estimates of 20 to 22 million tons of EU pellets demand by 2025 ([14]) to an EU pellet demand of 38 million tons by 2025 ([54]). For all other wood-based commodities within the EU and for all commodities outside the EU no particular renewable energy target for wood pellets consumption is assumed to be in place - modelling outcomes as to production, trade and apparent consumption are derived as solutions to the welfare-optimization problem under resource, technology and equilibrium constraints.
Results and discussion
Maximum wood supply
Tab. 1 shows the MWS estimated by CBM in the BaU and HM scenarios. The total MWS at EU level is 795 Mm3 in 2020 (for both scenarios) and 759 and 767 Mm3 in 2030, for the HM and BaU scenarios, respectively. The higher theoretical amount of biomass available in the BaU scenario after 2020 (+8% in 2030 compared with the HM scenario), is the result of the saving of biomass during the previous decade, not realized in the HM scenario, where we assumed that no saving of biomass was realized during the previous period.
Tab. 1 - MWS (in million m3 yr-1) estimated by CBM for 2020 (2018-2022 average) and 2030 (2028-2032 average), under Business as Usual (BaU) and High Mobilization (HM) scenarios.
| Country | MWS (Mm3 yr-1) | ||
|---|---|---|---|
| 2020 | 2030 | ||
| BaU & HM | HM | BaU | |
| Austria | 34.3 | 33.1 | 35.4 |
| Belgium | 4.0 | 3.8 | 3.0 |
| Bulgaria | 14.5 | 14.3 | 11.8 |
| Croatia | 10.4 | 9.9 | 10.5 |
| Czech Rep. | 25.8 | 25.1 | 25.5 |
| Denmark | 5.3 | 5.0 | 5.1 |
| Estonia | 14.4 | 13.7 | 11.0 |
| Finland | 87.6 | 82.7 | 86.0 |
| France | 67.6 | 62.3 | 65.7 |
| Germany | 108.5 | 106.4 | 118.7 |
| Greece | 12.3 | 12.1 | 12.8 |
| Hungary | 9.0 | 8.4 | 8.7 |
| Ireland | 7.9 | 7.2 | 7.2 |
| Italy | 25.0 | 24.7 | 23.9 |
| Latvia | 31.9 | 30.3 | 31.1 |
| Lithuania | 13.1 | 12.8 | 13.1 |
| Luxembourg | 0.3 | 0.3 | 0.3 |
| Netherlands | 3.4 | 3.4 | 3.1 |
| Poland | 40.1 | 38.1 | 38.4 |
| Portugal | 17.4 | 17.5 | 16.6 |
| Romania | 27.2 | 26.0 | 21.1 |
| Slovakia | 10.2 | 10.1 | 11.4 |
| Slovenia | 5.4 | 5.3 | 5.4 |
| Spain | 61.3 | 59.5 | 54.9 |
| Sweden | 134.5 | 125.8 | 129.1 |
| UK | 23.7 | 20.7 | 20.7 |
| EU | 795.4 | 758.7 | 767.0 |
According to CBM results (Tab. 1), Sweden, Germany, Finland, France, Spain, and Poland are the largest contributors to the EU woody biomass potential, with shares ranging from 5% to 17%. All other countries contribute less than 4% to the EU total. Our results are in line with FAOSTAT data, in fact more than 60% of the historical harvested wood (measured as the 2000-2012 average) is provided by five of these countries ([41]). The only exception is Spain, where the historical harvest rate reported by FAOSTAT is considerably lower (on average 17 Mm3 yr-1 between 2000 and 2012) than our result and might thus suggest some overestimate.
The overall MWS estimated with CBM at EU level is similar (+4% for HM and +5% for BaU in 2030) to the values obtained with the EFISCEN model in the medium mobilization scenario (734 and 731 Mm3 yr-1 in 2020 and 2030, respectively) in Verkerk et al. ([57]). However, there are some differences at country level. In general, CBM estimates of woody biomass potentials are higher than EFISCEN estimates (on average >20%). The main possible reasons are the use of different input data with regards to NFIs (e.g., for Latvia, Lithuania, Netherlands and Portugal), FAWS area (e.g., in Denmark, Portugal and Spain higher in LUISA than in EFISCEN), and harvest level (e.g., updated values of the potential amount of harvest provided by Sitka spruce plantations in Ireland).
Furthermore, CBM distinguishes between even-aged and uneven-aged forests, while EFISCEN does not (e.g., in Italy and Spain this is highly relevant). For a few countries, CBM estimates are lower than EFISCEN. This is the case of Italy, where the difference is most likely due to the circumstance that CBM explicitly models uneven-aged forests and coppices - forest types representing about 60% of total Italian forest area - while EFISCEN assumes that all forest are even-aged. Overall, differences between CBM and EFISCEN estimates are consistent for both the HM and the BaU scenarios, i.e., either both larger or smaller, which may suggest influence of a systematic factor or assumption.
Future harvest demand
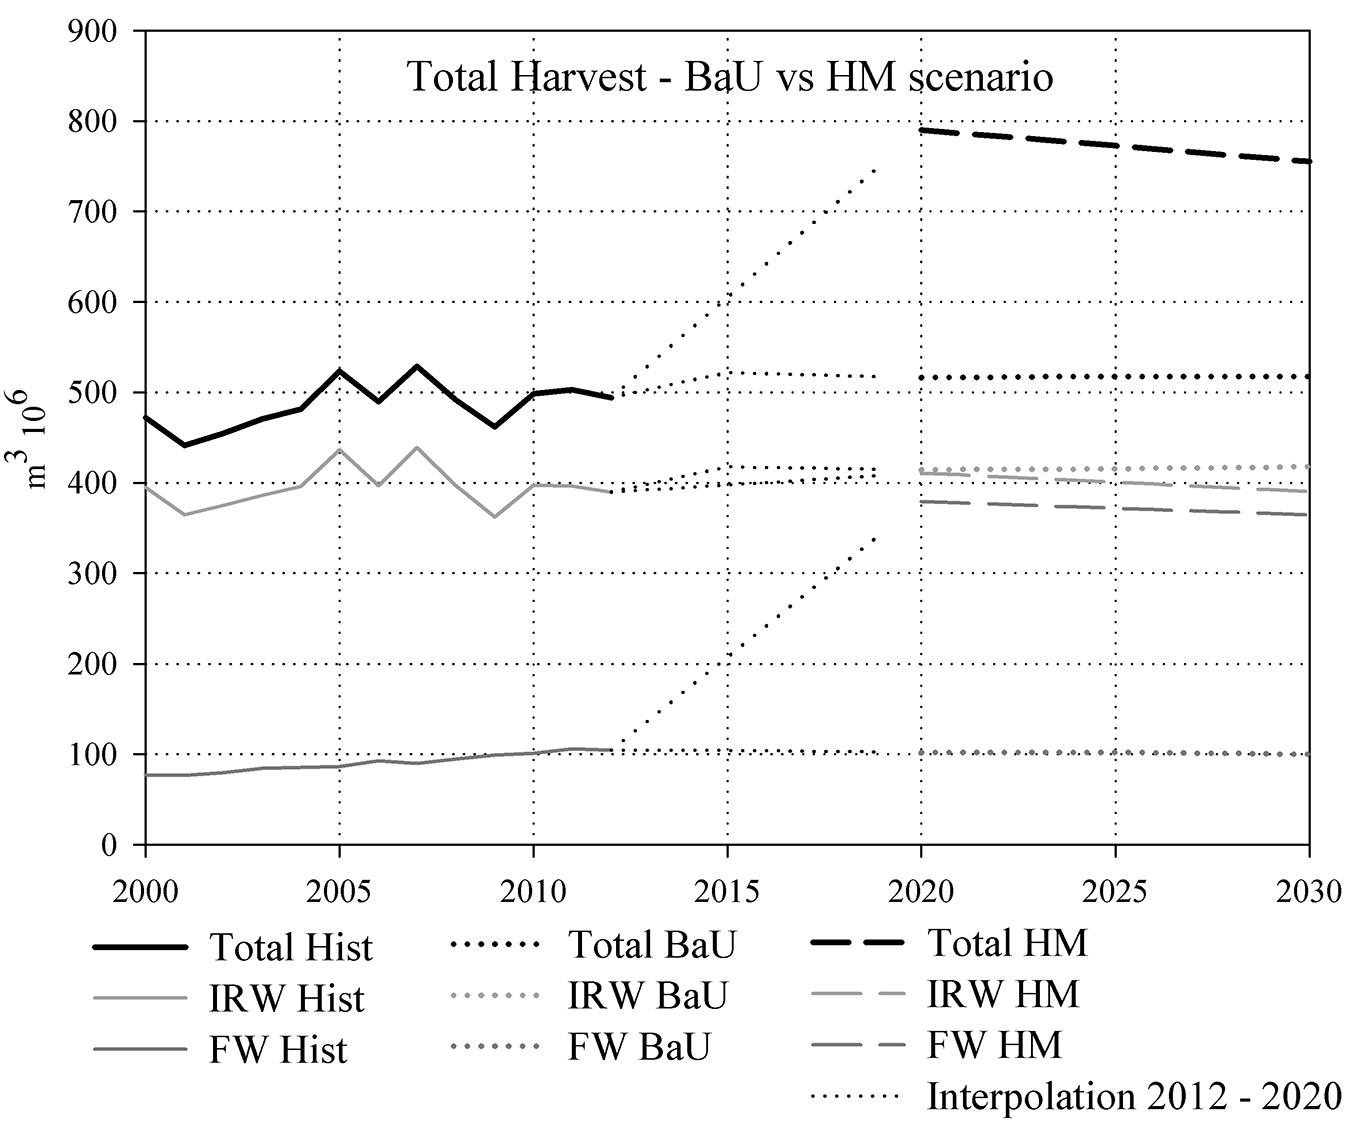
In the BaU scenario, total harvest at EU level is 516 Mm3 in 2020 and 518 Mm3 in 2030 according to modelling outcomes. Coniferous IRW make up 64% of the harvest, broadleaves IRW 16% and wood for energy the remaining 20% (Fig. 4). Total IRW harvests in the EU remain stable over the outlook period in the BaU scenario. The only significant changes are decreasing coniferous sawlogs harvests and increasing coniferous pulpwood harvests, and, to lesser extent, non-coniferous pulpwood harvests. Total EU net trade of IRW in the BaU also remains stable. Net-imports of coniferous sawlogs increase, while net-exports (negative values of net-imports) of coniferous pulpwood increase. The overall results at EU level are decreasing consumption of sawlogs and increasing consumption of pulpwood. On the global level, harvests and consumption of all timber assortments are increasing over the outlook of the BaU. Total IRW harvests thus increase by 140 million m3 between 2015 and 2030. Pulpwood accounts for the majority of this increase, 78 million m3 (Tab. 2).
Fig. 4 - Historical (until 2012) and future harvest demand at EU level (in million m3 over bark), based on Business as Usual (BaU) and HM scenarios, further distinguished between the amount of wood-based commodities (IRW) and wood for energy (FW).
Tab. 2 - EU IRW harvests, net trade and consumption (million m3 o.b.) in the BaU scenario, Global IRW harvests in the BaU scenario, and differences between the HM and BaU scenarios (million m3 o.b.).
| Scenario | Commodity | Harvests | Net-Imports | Consumption | Global harvests | ||||||||
|---|---|---|---|---|---|---|---|---|---|---|---|---|---|
| 2015 | 2020 | 2030 | 2015 | 2020 | 2030 | 2015 | 2020 | 2030 | 2015 | 2020 | 2030 | ||
| BaU | Conif. sawlogs | 220 | 221 | 212 | 11 | 12 | 13 | 232 | 233 | 225 | 903 | 915 | 936 |
| Non-conif. sawlogs | 32 | 31 | 32 | 9 | 9 | 9 | 41 | 40 | 41 | 505 | 513 | 534 | |
| Conif. pulpwood | 118 | 116 | 125 | -2 | -2 | -3 | 116 | 114 | 122 | 405 | 410 | 445 | |
| Non-conif. pulpwood | 47 | 47 | 49 | 12 | 13 | 12 | 60 | 59 | 61 | 381 | 389 | 419 | |
| Total IRW | 418 | 414 | 418 | 31 | 32 | 31 | 448 | 446 | 448 | 2194 | 2228 | 2334 | |
| Differences between HM and BaU scenarios |
Conif. sawlogs | - | -0.5 | 5.4 | - | 0.5 | 7.6 | - | 0.0 | 13.0 | - | 4.1 | 21.8 |
| Non-conif. sawlogs | - | 1.0 | 0.3 | - | 0.1 | 0.7 | - | 1.1 | 1.0 | - | 6.3 | 7.9 | |
| Conif. pulpwood | - | -3.4 | -25.4 | - | -0.4 | -2.4 | - | -3.8 | -27.8 | - | 2.8 | -31.9 | |
| Non-conif. pulpwood | - | -0.6 | -7.7 | - | -0.1 | -0.5 | - | -0.7 | -8.2 | - | 4.0 | -20.3 | |
| Total IRW | - | -3.5 | -27.3 | - | 0.1 | 5.4 | - | -3.4 | -21.9 | - | 17.2 | -22.6 | |
Total EU harvest in the HM scenario is about 46% higher than in the BaU scenario in 2030. The allocation of the harvest on IRW and FW differs between the two scenarios: in the BaU scenario, FW accounts for 20% of the harvest, while in the HM scenario this share increases to 46% (on average, 2015-2030). In fact, total IRW harvest in the EU is lower in the HM than in the BaU scenario by 2030 (Fig. 4), and the additional amount of wood available in this scenario is entirely used for fuelwood. Increasing EU harvests of (mainly coniferous) sawlogs over time as compared to the BaU scenario are not enough to compensate for progressively lower harvests of pulpwood, resulting from reduced production of reconstituted wood-based panels and pulp and paper, due to crowding out by wood pellets manufacturing. Net trade patterns mirror production ones, so that changes in IRW consumption amplify those of harvests of IRW (Tab. 2). On global level, harvests of all assortments are higher in the HM than in the BaU scenario by 2020. However, over time the decline in harvests of pulplogs - again resulting from wood pellets manufacturing crowding out reconstituted wood-based panels and pulp and paper production - is more pronounced than the increase in sawlog harvests, resulting in total IRW harvest level being lower by 2030 in the HM than in the BaU scenario (Tab. 2).
IRW harvest patterns reflect changes in the production of processed wood-based products. Hence, in the BaU, sawnwood production, after an initial small increase, is projected to decrease by 2030, as is, above all, graphic paper (newsprint and printing + writing paper) production, reflecting falling consumption levels. Fiberboard and particle board production and consumption levels will essentially remain stable. At the same time, packaging paper production is foreseen to increase (Tab. 3). These developments are in line with recent trends: low construction activity; electronic information and communication technology substituting for graphic paper; packaging paper consumption supported by trade and e-commerce ([28]). While EU wood pellets consumption is projected to increase by nearly three million tons between 2015 and 2030, production remains essentially stable, resulting in increased net-imports (Tab. 3). Globally, production (and thereby consumption) of all commodities increases from 2015 to 2030 in the BaU - most notably for packaging paper and sawnwood - with the exception of graphic paper, which registers a sizeable decrease (Tab. 4).
Tab. 3 - EU production, net trade and consumption of wood-based commodities in the BaU scenario, and differences between the HM and BaU scenarios (sawnwood, plywood, particle board, and fiberboard: million m3; newsprint, printing + writing paper, packaging, household + sanitary and wood pellets: million metric tons).
| Scenario | Commodity | Production | Net-Imports | Consumption | ||||||
|---|---|---|---|---|---|---|---|---|---|---|
| 2015 | 2020 | 2030 | 2015 | 2020 | 2030 | 2015 | 2020 | 2030 | ||
| BaU | Conif. sawnwood | 98.8 | 100.5 | 96.8 | -9.4 | -10.3 | -9.1 | 89.5 | 90.2 | 87.7 |
| Non-conif. sawnwood | 11.5 | 11.2 | 11.6 | 0.1 | -0.1 | -0.3 | 11.6 | 11.1 | 11.3 | |
| Plywood | 4 | 3.9 | 3.9 | 3.1 | 2.9 | 2.9 | 7 | 6.8 | 6.7 | |
| Particle board | 35 | 34.6 | 35.3 | -2.8 | -2.8 | -2.8 | 32.2 | 31.8 | 32.5 | |
| Fiberboard | 14.9 | 14.8 | 14.9 | -2.3 | -2.3 | -2.5 | 12.7 | 12.4 | 12.4 | |
| Newsprint | 7.1 | 6.6 | 5.7 | 0.6 | 0.7 | 0.6 | 7.7 | 7.2 | 6.3 | |
| Printing + writing | 29.7 | 28 | 26.4 | -4.4 | -4.4 | -5.4 | 25.3 | 23.5 | 21 | |
| Packaging | 45 | 44.8 | 49.9 | -7.7 | -8.3 | -9 | 37.3 | 36.5 | 40.9 | |
| Household + sanitary | 4.8 | 4.4 | 4.8 | 0.1 | 0.1 | 0.1 | 4.8 | 4.4 | 4.9 | |
| Wood pellets | 13.3 | 13.2 | 13.6 | 6.3 | 7.3 | 8.9 | 19.6 | 20.5 | 22.5 | |
| Differences between HM and BaU scenarios |
Conif. sawnwood | - | 1.1 | 10.7 | - | -0.3 | -5.6 | - | 0.8 | 5.1 |
| Non-conif. sawnwood | - | 0.6 | 1.5 | - | 0 | -1.1 | - | 0.6 | 0.4 | |
| Plywood | - | 0.1 | -0.2 | - | 0 | -0.4 | - | 0.1 | -0.6 | |
| Particle board | - | -1.5 | -8.7 | - | 0.2 | 0.7 | - | -1.3 | -8 | |
| Fiberboard | - | -0.6 | -3.3 | - | 0.1 | 0.4 | - | -0.5 | -2.9 | |
| Newsprint | - | -0.5 | -1.8 | - | -0.1 | 0 | - | -0.6 | -1.8 | |
| Printing + writing | - | -1.1 | -4.8 | - | -0.3 | -0.5 | - | -1.4 | -5.2 | |
| Packaging | - | 0 | -6 | - | 0.1 | -0.5 | - | 0 | -6.5 | |
| Household + sanitary | - | -0.3 | -1.8 | - | 0 | 0 | - | -0.3 | -1.8 | |
| Wood pellets | - | 2.3 | 6.6 | - | 3.2 | 11 | - | 5.5 | 17.6 | |
Tab. 4 - Global production of wood-based commodities in the BaU scenario, and difference between the HM and BaU scenarios (sawnwood, plywood, particle board, and fiberboard: million m3; newsprint, printing + writing paper, packaging, household + sanitary and wood pellets: million metric tons).
| Commodity | BaU Production | Difference between the HM and BaU scenarios |
||||
|---|---|---|---|---|---|---|
| 2015 | 2020 | 2030 | 2015 | 2020 | 2030 | |
| Conif. sawnwood | 326.3 | 331.8 | 341.2 | - | 3.2 | 16.4 |
| Non-conif. sawnwood | 139.6 | 143.0 | 153.9 | - | 4.8 | 7.9 |
| Plywood | 123.9 | 129.5 | 135.0 | - | 0.2 | 2.6 |
| Particle board | 102.5 | 103.3 | 108.0 | - | -3.1 | -20.1 |
| Fiberboard | 97.5 | 100.4 | 108.7 | - | -0.8 | -10.7 |
| Newsprint | 29.0 | 27.4 | 24.9 | - | -1.8 | -6.5 |
| Printing + writing | 101.8 | 98.1 | 93.9 | - | -4.0 | -14.5 |
| Packaging | 258.6 | 264.3 | 286.1 | - | 6.9 | 9.5 |
| Household + sanitary | 31.9 | 31.8 | 34.2 | - | 0.1 | -2.7 |
| Wood pellets | 25.5 | 25.9 | 27.2 | - | 4.4 | 14.8 |
As for the HM scenario, IRW consumption patterns on EU level results from the higher demand for wood pellets being synergetic with sawnwood production through higher demand for sawnwood by-products, while at the same time crowding out production of particle board, fiberboard and paper products through increased competition for feedstocks (mainly sawnwood by-products). The increased production of sawnwood further crowds out particle board and fiberboard production. Hence, sawnwood production (Tab. 3) and the demand for sawlogs increases, while the demand for pulplogs decreases (Tab. 2). These developments are reflected in harvest as well as trade patterns. The overall effect on EU level is one of lower IRW demand (Tab. 2), as the decrease in the demand for pulplogs outweighs the increase in demand for sawlogs. Modelling results by Lauri et al. ([37]), Johnston & Van Kooten ([26]), Frank et al. ([21]) and Jonsson & Rinaldi ([31]) also indicate increased demand for wood-based energy displacing material uses of woody biomass in the EU. The same effect is observed for the EFSOS region in the European Forest Sector Outlook Study II ([55]). ReceBio ([20]) as well as the EU Reference Scenario 2016 ([13]), on the other hand, projects increasing use of wood for energy as well as for material up to 2030 (for further details see section “Comparisons with other studies”). The most notable changes in net trade compared to the BaU scenario are increasing EU net-exports of sawnwood and increasing EU net-imports of wood pellets over time. Changes in consumption mirror those of production (Tab. 4).
The patterns for production and consumption of wood-based commodities at global level in the HM scenario are the same as for the EU, with the exception of packaging paper (Tab. 4). Here, global production and consumption is higher in the HM scenario. Apparently, some major producers, notably the USA and China, benefit from the contraction of packaging paper production within the EU, as well as the global contraction in wood-based panels and graphic paper, making use of the same raw material (Tab. 4).
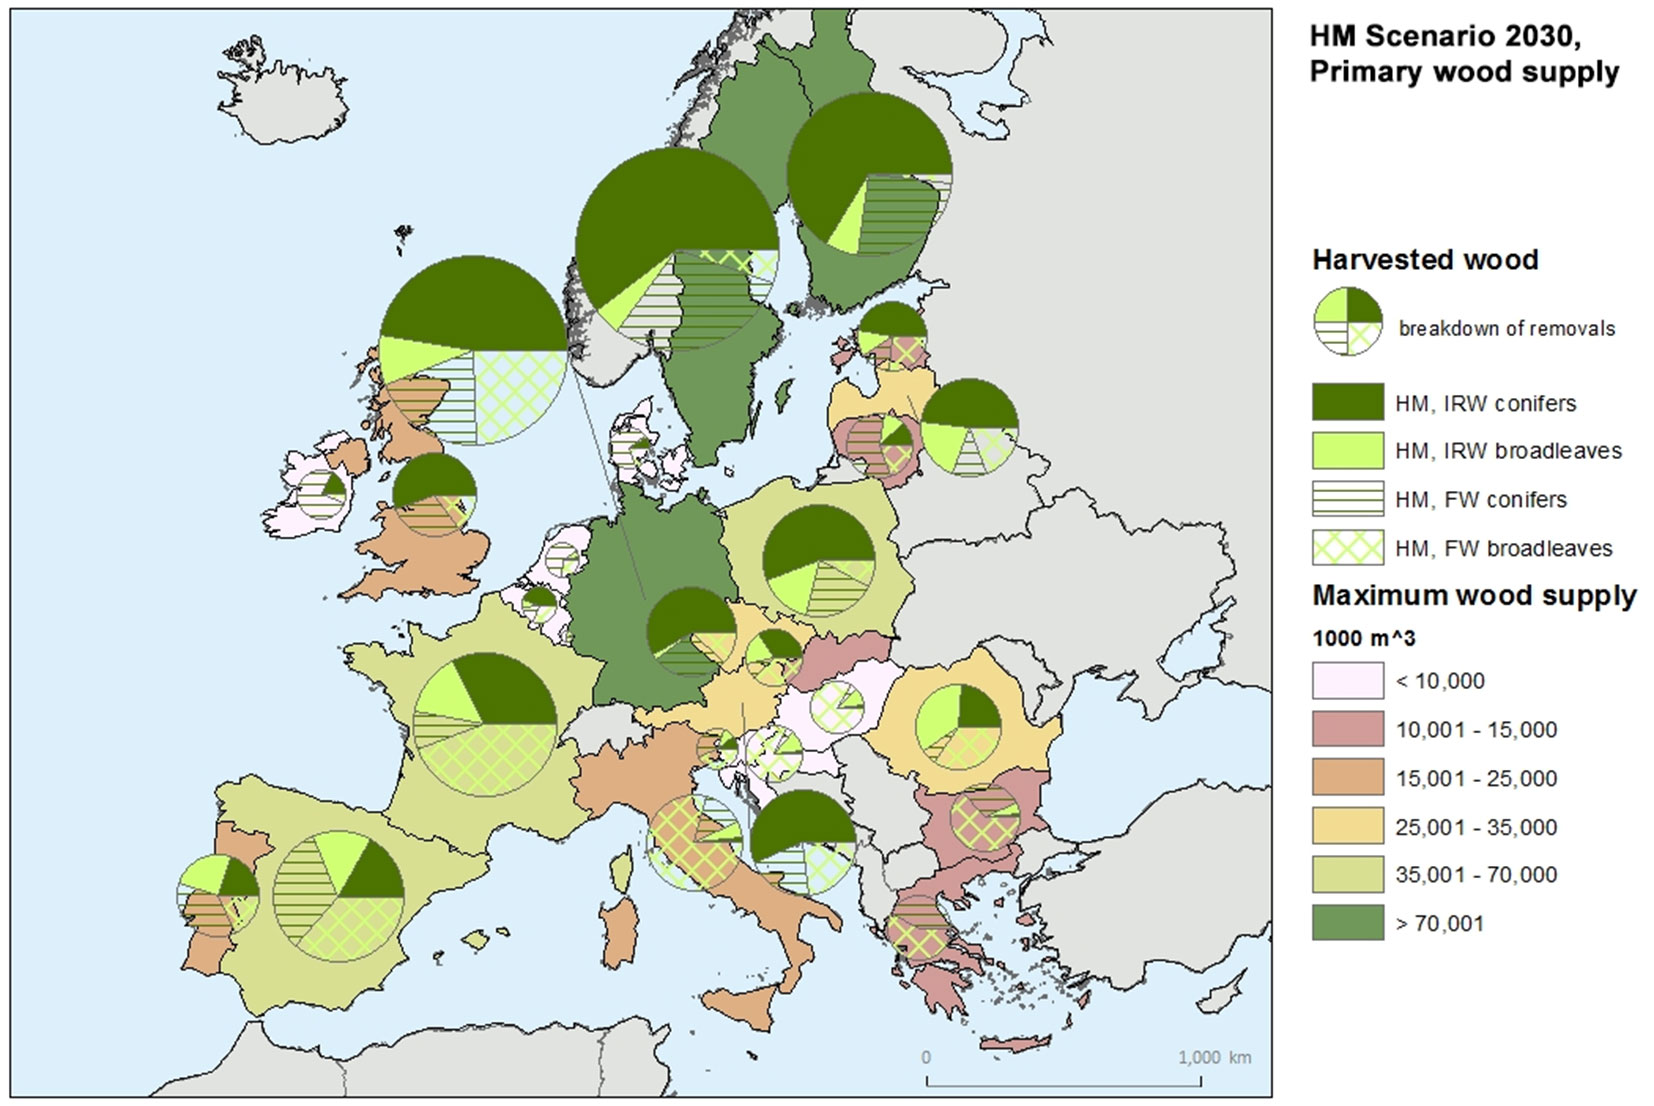
Fig. 5 and Fig. 6 show the contribution of each MS to the total wood harvest and provide information on the composition of each country’s harvest. The historical and future wood harvests, detailed country by country, are listed in Tab. S2 (Supplementary material). At EU level, the amount of wood-based commodities in 2030 increases by 10% for coniferous in the BaU scenario (+4% in the HM scenario) and decreases by 10% (-18% in the HM scenario) for broadleaves, compared to 2000-2012. With respect to 2015, in the BaU scenario, we estimate a 10% and 7% increase of wood used for energy for coniferous and broadleaves, respectively. In the HM scenario, it goes up to 302% and 55% for coniferous and broadleaves, respectively.
Fig. 5 - The 2030 primary wood supply in the BAU scenario. For each country the total amount of harvest (proportional to the radius of the circle) is broken down between industrial roundwood (IRW) and fuelwood (FW), further distinguished between broadleaves and conifers. The background of each country highlights the maximum wood supply estimated by CBM (in m3 103).
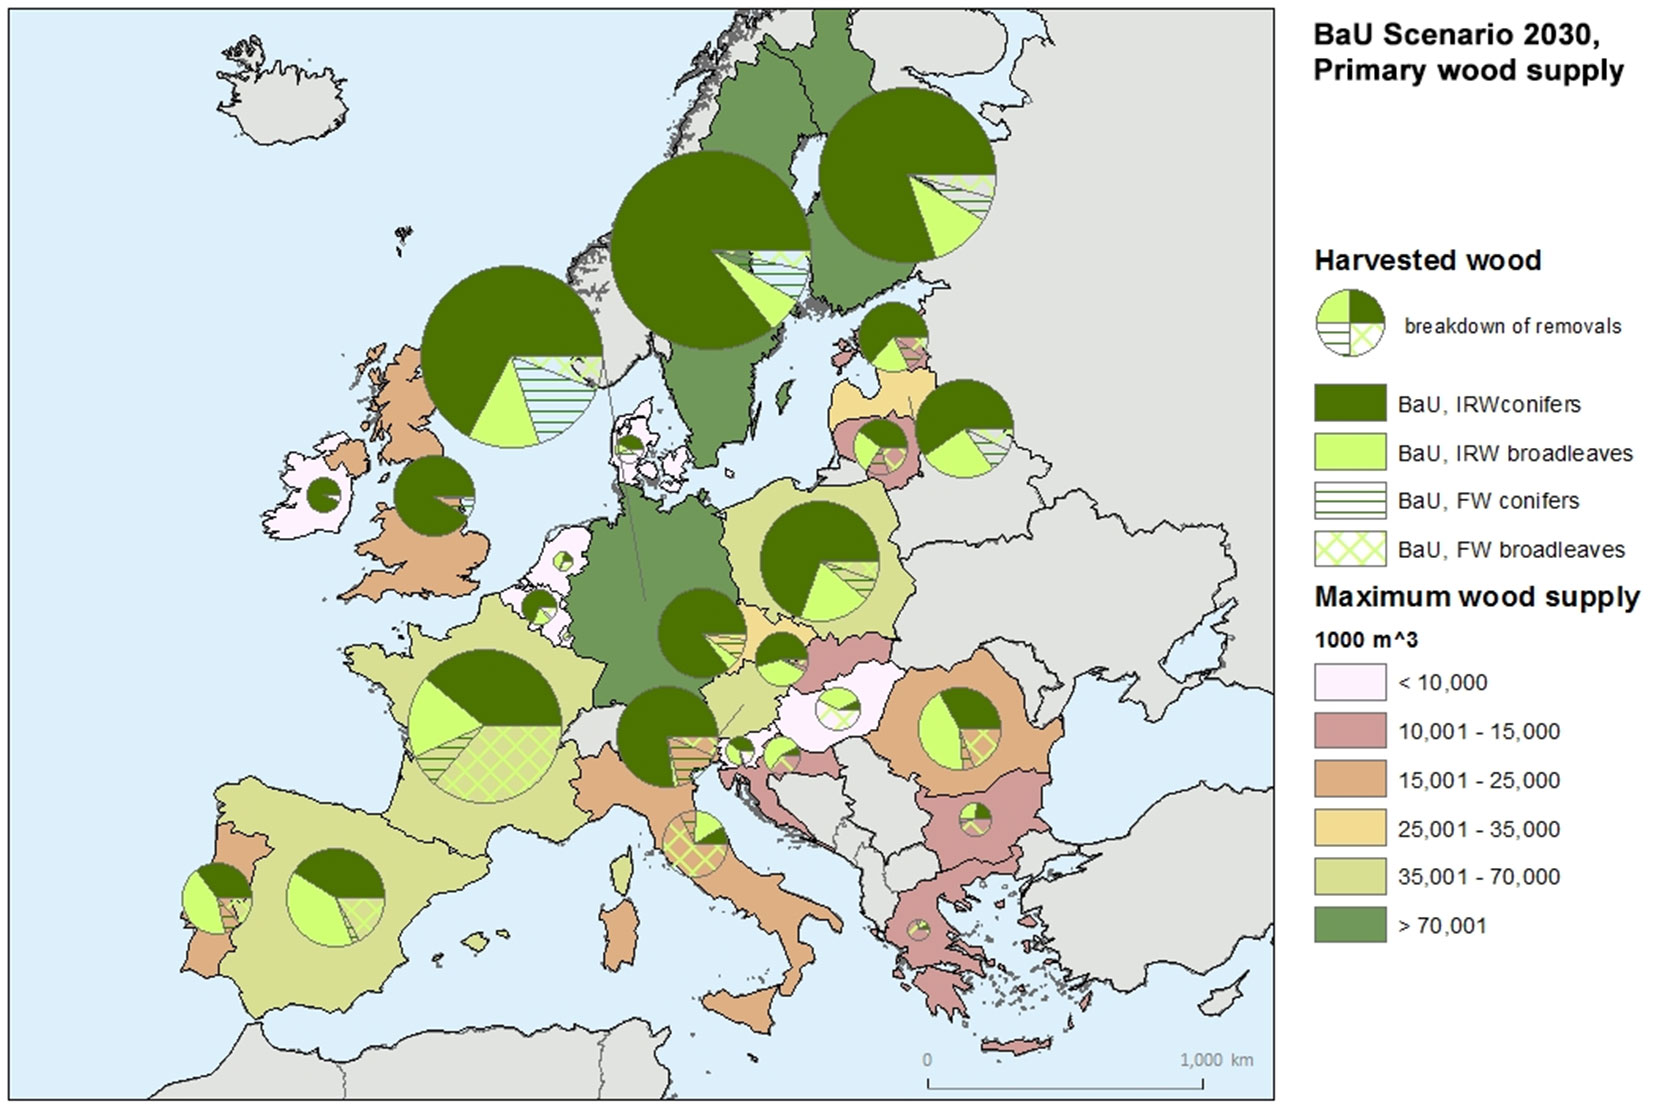
Fig. 6 - The 2030 primary wood supply in the HM scenario. For each country the total amount of harvest (proportional to the radius of the circle) is broken down between industrial roundwood (IRW) and fuelwood (FW), further distinguished between broadleaves and conifers. The background of each country highlights the maximum wood supply estimated by CBM (in m3 103).
Forest C stock change
In the BaU scenario CBM estimates show a decreasing C stock change in FAWS, from 99.6 Tg C yr-1 in the historical period 2000-2012 (average of the period) to 85.1 Tg C yr-1 in 2030, corresponding to about -1.4% per year (Fig. 7). Since the total amount of harvest in the BaU scenario is quite stable, this reduction confirms a decreasing growth capacity of the European forests, probably due to an age-related decline in growth rates (i.e., increasing areas of old forests with a decreasing growth rate) as foreseen in previous studies ([40], [45]). On the contrary, the C stock change estimated on the FnAWS shows a slightly increasing, continuous trend. While on the FAWS harvest removals sum up to the age-related decline in growth rate, in the FnAWS only this last factor is acting to limit the growth rate. A stable (in case of FAWS) or null (in case of FnAWS) rejuvening process of the age structure could further reduce the future growth rate of both these areas. Indeed, even in the case of the FAWS, the management practices applied during the model run are not been adapted to the evolution of the age structure, but were only aimed to satisfy the expected harvest demand. This approach could be further refined, modifying the intensity of the management practices, according to the age class distribution ([22]).
Fig. 7 - C stock change (in Tg C yr-1) estimated by CBM for the FAWS, the FnAWS and the total forest area, further distinguished between different mobilization scenarios. The estimates for the historical period (2000-2012) are based on the historical harvest demand and assumptions reported by Pilli et al. ([44]). The values reported from 2013 and 2014 are derived from a linear interpolation between 2012 and 2015.
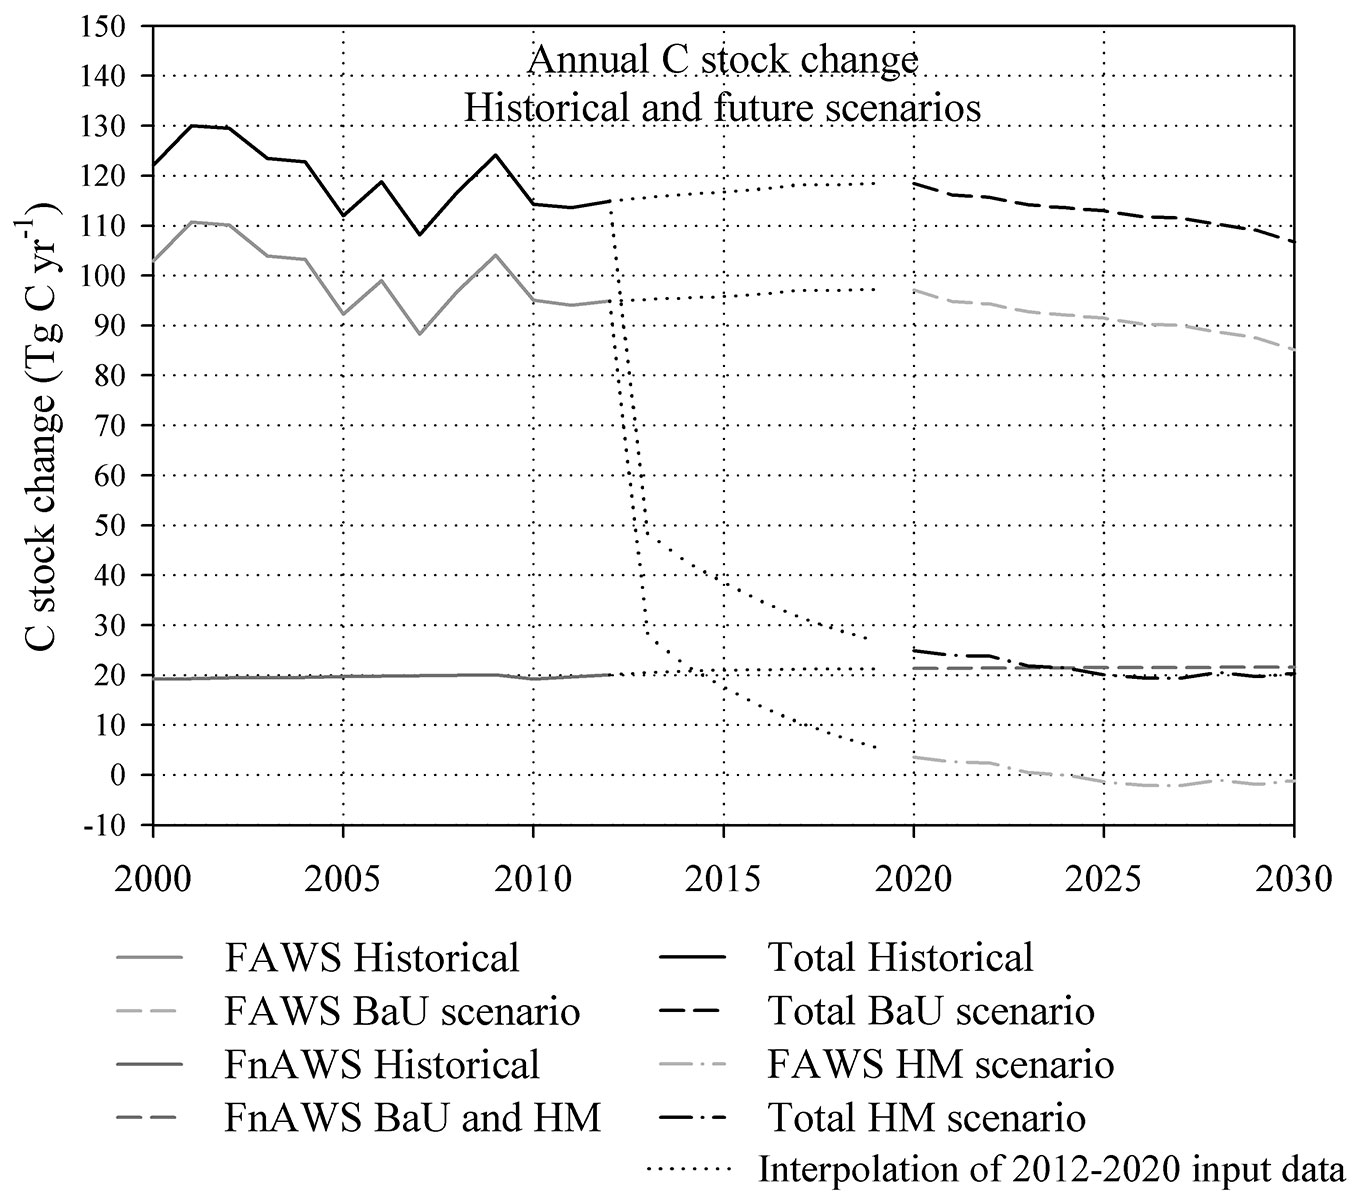
As expected, the larger C stock change (about 82% of the total C stock change between 2010 and 2030) is concentrated on the FAWS, covering about 91% of the total forest area considered by our study. Due to the decreasing C stock change estimated for this area, the overall C stock change estimated at EU level decreases from 119.3 Tg C yr-1 in 2000-2012 (average of the period) to 106.6 Tg C yr-1 in 2030. Overall, we estimate a C sink (i.e., removals of CO2 from the atmosphere) for all the forest C pools, for the entire period. The larger removals are provided by the living biomass (about 95% of the total C stock change), while soil is a quite stable pool (i.e., neither a source neither a sink for the atmosphere). The DOM C stock change (about 5% of the total) is mainly affected by the management practices, transferring a fraction of the living biomass stock to the DOM pool as primary forest residues ([44]).
Unsurprisingly, we foresee a considerably lower C stock change on the FAWS in the HM scenario, with a C source equal to -1.2 Tg C yr-1 in 2030 (Fig. 7). Indeed, in this scenario we assume that all the net increment of the merchantable living biomass available on the FAWS is removed. As highlighted in the Methods, this implies that the living biomass pool is in equilibrium (i.e., neither a source, nor a sink of C) with the atmosphere and that the current stock of living biomass existing on the FAWS is kept constant until the end of the outlook period.
The higher removals applied in the HM scenario (+45% in 2030 with respect to the BaU scenario and +55% with respect to the historical period), directly affect the amount of C on the DOM pool, where we estimate a positive C stock change (i.e., a sink for the atmosphere, from 2013 to 2023). Indeed, the increasing intensity of the silvicultural practices in the FAWS has a direct effect on the amount of primary forest residues left on the forest site. The soil pool continues to be C neutral as in the previous case, since it is not directly affected by the harvest practices in the short period. Adding the C stock change estimated on the FnAWS (not affected by harvest, also in the HM scenario), the final C stock change at EU level is equal to 20.3 Tg C yr-1 in 2030, i.e., about 80% lower than the total C stock change estimated under the BaU scenario.
Comparisons with other studies
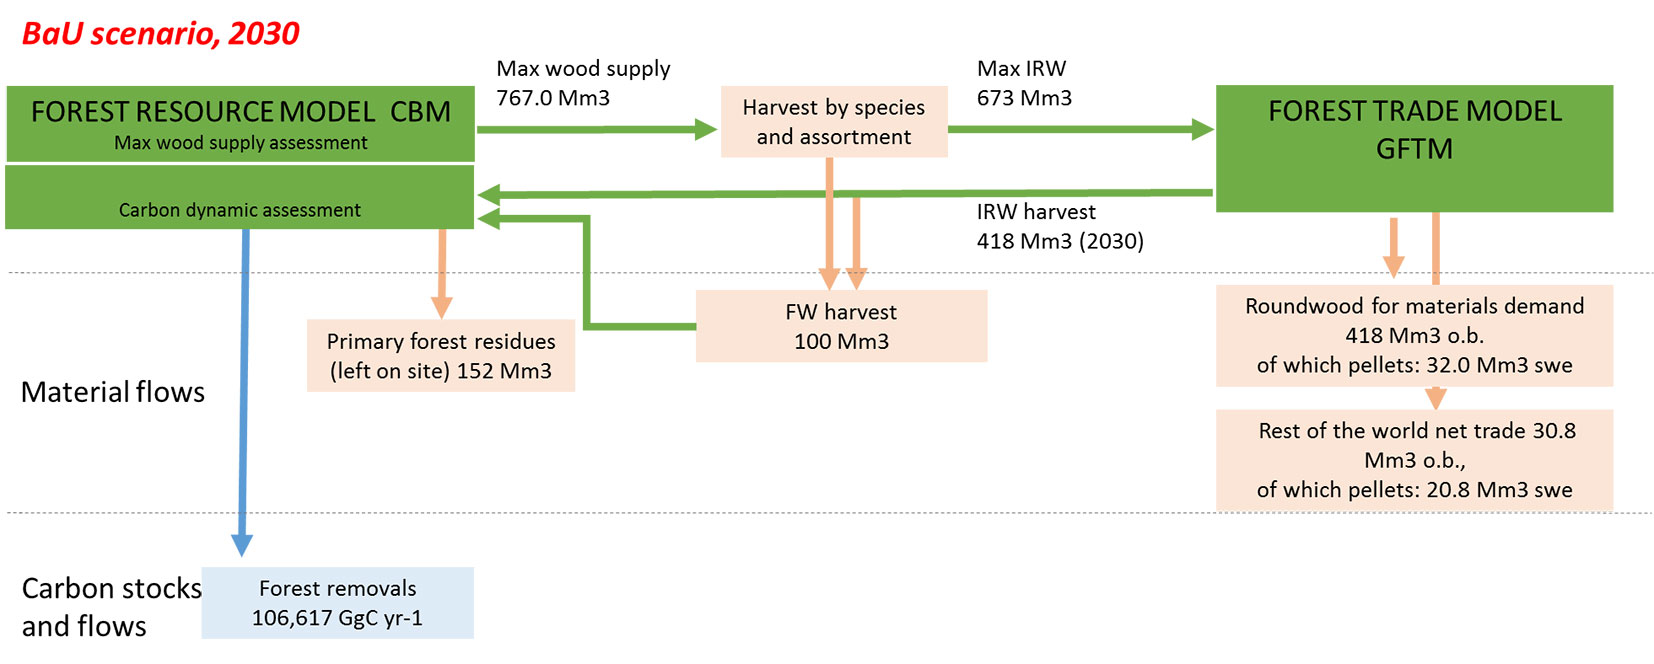
The main outcomes provided by our modelling set up in the BaU scenario, summarized in Fig. 8, can be compared with the outcomes from the land use and forestry components of the EU Reference Scenario 2016 ([13]) and those from the ReceBio study ([20]), focusing on the future EU demand for bioenergy. Both are based on the same modeling framework encompassing an economic land use model, GLOBIOM, coupled with a forest model, G4M. The comparison of the results is attempted, though keeping in mind that the model frameworks differ considerably.
Fig. 8 - Summary of the main results provided by our modeling framework under the BaU scenario for 2030.
Besides total forest area (see Tab. 5), the three studies differ in a number of other respects: the inclusion of (i) afforestation (assumed as negligible in our study) and (ii) short rotation forests (not considered in our study); (iii) total harvest amount in 2010 (considerably higher in the ReceBio baseline scenario) and as estimated by the different models for 2030; (iv) historical and future harvest shares of IRW and FW (considerably different in the ReceBio baseline scenario).
Tab. 5 - Comparison between the main drivers considered in the three modelling frameworks. (AR): afforestation and reforestation; (SRF): short rotation forests.
| Factor | Year | CBM - GFTM BaU | EU Ref. Scenario 2016 | ReceBio Baseline scenario |
|---|---|---|---|---|
| Forest area in 2010 (Mha) | - | 140 (FAWS) + 13 (FnAWS), assumed as constant until 2030 |
148, defined as area under Forest Management |
154, including 105 defined as “area of used forests” |
| AR and SRC from 2010 to 2030 (Mha) | - | No, assumed as negligible in the short period |
5 AR + SRCs | 9 AR + 2.5 SRC |
| Total Harvest (Mm3 o.b.) |
2010 | 498 | 492 | 556 |
| 2030 | 517 (+4%) | 565 (+14%) | 616 (+11%) | |
| Harvest Share | 2010 | 82% IRW / 18% FW | 78% IRW / 22% FW | 75% IRW / 25% FW |
| 2030 | 80% IRW / 20% FW | 72% IRW / 28% FW | 77% IRW / 23% FW |
The two model frameworks - CBM-GFTM and GLOBIOM-G4M respectively - further differ as regards: (i) growing stock detail (FAWS and FnAWS are divided in coniferous and broadleaf forests in the current study); (ii) timber assortments detail (in the current study IRW and FW are divided in coniferous and broadleaf); (iii) wood-based product scope and detail (we consider more products, notably different paper grades, and in greater detail, distinguishing between coniferous and broadleaf sawnwood, respectively) and modelling assumptions regarding wood pellets; (iv) sourcing (ReceBio considers only EU imports); (v) feedstocks (ReceBio considers SRC Eucalyptus plantations and industrial by-products, but not roundwood, while we consider roundwood and by-products); and (vi) application (ReceBio considers large scale, industrial use only, not small-scale household use, while we consider both uses).
Finally, and not the least important, are differences as to scope, focus, strength, and weaknesses of the two modelling frameworks in question. GLOBIOM-G4M addresses overall land use aspects at global level. In doing so, detail and precision as regards the forest sector, in particular at EU level, is lower than in the present study. Though modelling wood-based commodity markets globally, we focus on EU forest-based biomass potentials, their possible utilization, and the impact on EU forest resources and forest carbon dynamics. Unlike GLOBIOM-G4M, we do not yet address agricultural land use.
The Reference Scenario 2016 projects a total harvest of 565 million m3 for 2030, i.e., about 9% higher than our BaU scenario. Wood used for energy accounts for most of this difference. Indeed, the Reference Scenario foresees that this category would increase from 91 million m3 in 2005 to 159 million m3 in 2030, i.e., a 75% increase. As for wood for material uses, the Reference Scenario foresees the amount of harvest to first decrease from 425 million m3 in 2005 to 375 million m3 in 2015, and then to increase to 405 million m3 by 2030.
Based on these assumptions, the EU Reference Scenario 2016 estimated for forestland (excluding afforestation) a total amount of CO2 removals (reported with negative numbers, from an atmosphere perspective) equal to -242 Mt CO2 in 2030 (for EU 28, including Malta and Cyprus, which are not considered in our study). This value is about 38% lower than the C sink estimated by CBM for 2030, equal to -391 Mt CO2 in the BaU scenario. The difference is due both to the lower harvest rate considered in the present study, and to differences in model input data. Indeed, the estimates provided by GLOBIOM-G4M use as main input the forest net annual increment and FAWS reported by the State of Europe’s Forests ([19]), and whose output was further calibrated against the UNFCCC data on Greenhouse Gases emissions and removals reported by each country for the forest sector ([13]). The estimates provided in our study are instead based on the direct application of NFI data to the CBM, without any further calibration of the model output.
The baseline for the ReceBio study was the 2013 EU Base Scenario and, on this base, apart from different policy scenarios, a baseline scenario assuming the continuation of current trends in the bioenergy sector was constructed. This is the most comparable scenario with the BaU developed in our study. Note, moreover, that the ReceBio Emission Reduction scenario (which could also be of interest for comparison with our HM scenario), where an increase in biomass is envisioned, has results almost identical to the Baseline scenario for 2030.
The 2030 total harvest estimated in ReceBio is 19% and 9% higher than the harvest in the BaU scenario of our study and the EU Reference Scenario 2016, respectively. This is mainly due to a considerably higher harvest reported already for 2010 in ReceBio, used to calibrate the future trend (Tab. 5). In particular, the FW component reported by the ReceBio study for 2010, i.e., 141 Mm3, is 56% and 30% higher than the amount reported by our study (90 Mm3) and by the EU Reference Scenario 2016 (108 Mm3), respectively. While the ReceBio study reports a slightly decreasing FW harvest in 2030 compared to 2010, 139 Mm3, both the Reference Scenario and the BaU scenario of our study are expecting increasing FW harvests in 2030, 158 Mm3 (+46%) and 103 Mm3 (+14%) respectively. Conversely, in the last two studies the share of wood for material use decreases slightly from 2010 to 2030 (though harvests of IRW increases in both cases from 2010 to 2030), while in the ReceBio study it increases (Tab. 5).
Lauri et al. ([37]), and to some extent Frank et al. ([21]) - again both studies using GLOBIOM and G4M - find that increased demand for wood-based energy crowds out material uses of woody biomass in the EU, which is in accordance with our modelling outcomes, comparing the BaU and HM scenarios. In contrast, ReceBio projects increasing use of wood for energy - the result of increasing energy utilization of industrial by-products and increasing imports of wood pellets, as FW removals remain essentially stable up to 2030 - as well as material up to 2030. Harvests and net-imports of IRW within the EU is foreseen to increase, mainly driven by increasing sawnwood production, but also wood-based panels and pulp production are projected to increase. The Reference Scenario likewise projects a growing demand for wood for both energy production and material uses. Hence, in these two studies there is no apparent displacement of material production from an increased use of wood for energy.
Both in our study and in the ReceBio study, the wood used for energy includes wood pellets, forest residues and a roundwood component used for energy production. In our study, wood pellets derive from IRW (coniferous as well as non-coniferous pulplogs) and from industrial by-products (sawdust and wood chips), while in ReceBio (imported) wood pellets are produced from industrial by-products, SRC and eucalyptus plantations, not from pulplogs. Further, in this study, forest residues that can be used for energy are defined OWCs, i.e., branches, tops and standing dead wood removed when harvesting for IRW. The roundwood component for energy is defined FWtstem. Due to the lack of detailed information, in particular regarding household fuelwood ([47]), we have modelled the last two components through a simplified approach considering the historical (from 2000 to 2012) proportion of OWCs and FWtstem used for energy, in relation to the material use. This means that for these components we only deal partially with the competition with material uses for forest-based wood, while for wood pellets the competition between energy and material uses is comprehensively addressed by GFTM.
In ReceBio, the competition in the EU between wood pellets production and material uses of wood is not addressed, as ReceBio considers imported wood pellets only, and only for large scale industrial applications. These differences in modelling assumptions could explain some of the difference in modelling outcomes as regards size of wood removals and allocation of removals and industrial by-products. Further differences are due to the amount of forest residues used for energy: for 2010 equal to 67 Mm3 in our study and 43 Mm3 in the ReceBio study. Finally, yet another plausible reason for higher increases in material uses of wood in the EU in ReceBio and the Reference Scenario could be the circumstance that GLOBIOM does not model paper products. This model framework thus, reasonably, fails to account for the impact on pulp production of the decline in graphic paper demand. However, as indicated earlier, there a numerous differences between the two model frameworks. On a general note, caution is always called for when comparing the output from different model framework, due to differences in set-up, assumptions, as well as focus and overall purpose.
The ReceBio study also investigated the effect of a reduction on the use of forest residues on the other feedstocks used for energy ([20]). Even though we did not consider this aspect, assuming that the relative proportion of OWCs and FWtstem used for energy vary in relation to the material use, we have quantified the amount of primary forest residues, not removed from the forest site and potentially available as wood for energy provided by the FAWS. This amount is equal on average, at EU level, to about 30% of the total harvest expected for 2020 and 2030. Of course, removing this biomass from the forest site would have, in the medium term, some effect on the DOM C stock and, in the long term, on the soil pool ([43]).
Summary and conclusions
This study presents a comprehensive assessment of the maximum sustainable woody biomass harvest potential from 2020 to 2030. The modelling framework used explores the interactions between forest growth and harvest demand for material and energy uses, and analyses the impact on EU forest carbon dynamics and international wood-based product markets. One of the strengths of our modeling framework is the ability to account for interdependencies - competition as well as complementarities/synergies - between wood pellets and wood-based products, at EU member state level as well as in a global context. This is essential for assessing the impacts of different climate change mitigation policy options. Furthermore, GFTM covers a wide range of wood products, including paper, which is overlooked in similar modeling frameworks. Finally, we are able to provide consistent, coherent, and detailed results concerning wood harvest and carbon stock changes in the whole framework, considering the consequences of the level of harvests on forest resources.
In the BaU scenario, we foresee a 7% EU harvest increase with respect to the historical period, resulting from projected developments in wood products markets: decreasing sawnwood consumption and production, falling demand and ensuing production of graphic paper, and significantly increasing packaging paper consumption and production. There is also a significant increase in wood pellets consumption within the EU, mainly the result of increased net-imports, as EU internal production is very stable over the outlook. The consequence of this scenario on the EU forest C stock change is a 9% reduction in 2030 compared to 2015, confirming a decreasing growth capacity of the forests.
In the HM scenario, the harvest level in 2030 is 55% higher than in 2015. The resulting C stock change in EU forests is 83% lower in 2030 than in 2015. Here, the additional wood is entirely made up of fuelwood, as the harvest of industrial roundwood is actually slightly lower in this scenario. In addition to accelerating net-imports, the doubling of wood pellets consumption in EU from 2015 to 2030 triggers an increased use of pulpwood and sawmill and plywood by-products for wood pellets production, thus crowding out material uses.
The outcomes of the HM scenario imply dramatic consequences for carbon in EU forests, and possibly also on other environmental aspects not dealt with in this study. The modelling results indicate that pushing the EU harvest level to the maximum could significantly impair the capacity of EU forests to sequester and store carbon from the atmosphere. The overall displacement of material uses of woody biomass witnessed in the HM scenario also raises questions as to what would be the impact on climate change mitigation in terms of substituting fossil-fuel based materials as well as carbon storage in harvested wood products (HWP). Assessing overall mitigation effect of carbon dynamics in the entire forest-based sector requires accounting also for the substitution of wood-based energy for fossil-based energy as well as material substitution and carbon storage in HWP ([35]). Indeed, forthcoming research on climate change mitigation will aim at including the contribution of HWP in assessing the overall role of forests and forest products in climate change mitigation. The modelling framework used in the current study - in accounting for the interplay between material and energy uses of wood - provides a good basis for this work.
Finally, it needs to be stressed that any modelling effort would greatly benefit from improved data quality. In particular data related to fuelwood (removals as well as trade) would need to considerably improve in quality to allow for refined scenario analysis.
Acknowledgments
The work described in this paper has (though not constituting its official output) been carried out in the context of the JRC Biomass assessment study (⇒ https://biobs.jrc.ec.europa.eu/biomass-assessment-study-jrc).
Conflicts of Interest
The authors declare no conflict of interest. The opinions expressed herein are those of the authors and do not necessarily reflect the views of the European Commission. The scientific output does not imply a policy position of the European Commission.
References
Gscholar
Gscholar
Gscholar
Gscholar
Gscholar
Gscholar
Gscholar
Gscholar
Gscholar
Online | Gscholar
Gscholar
Gscholar
Gscholar
Gscholar
Gscholar
Gscholar
Authors’ Info
Authors’ Affiliation
Giulia Fiorese
Roberto Pilli
Francesca Rinaldi
Andrea Camia
European Commission, Joint Research Centre (JRC), Directorate D: Sustainable Resources, Bioeconomy Unit, v. E. Fermi 2749, I-21027 Ispra, Varese (Italy)
Faculty of Silviculture and Forest Engineering, Transilvania University of Brasov, Sirul Beethoven 1, 500123 Brasov (Romania)
European Commission, Joint Research Centre (JRC), Directorate B: Growth & Innovation, Territorial Development Unit, v. E. Fermi 2749, I-21027 Ispra, Varese (Italy)
Corresponding author
Paper Info
Citation
Jonsson R, Blujdea VNB, Fiorese G, Pilli R, Rinaldi F, Baranzelli C, Camia A (2018). Outlook of the European forest-based sector: forest growth, harvest demand, wood-product markets, and forest carbon dynamics implications. iForest 11: 315-328. - doi: 10.3832/ifor2636-011
Academic Editor
Piermaria Corona
Paper history
Received: Sep 19, 2017
Accepted: Mar 21, 2018
First online: Apr 18, 2018
Publication Date: Apr 30, 2018
Publication Time: 0.93 months
Copyright Information
© SISEF - The Italian Society of Silviculture and Forest Ecology 2018
Open Access
This article is distributed under the terms of the Creative Commons Attribution-Non Commercial 4.0 International (https://creativecommons.org/licenses/by-nc/4.0/), which permits unrestricted use, distribution, and reproduction in any medium, provided you give appropriate credit to the original author(s) and the source, provide a link to the Creative Commons license, and indicate if changes were made.

Web Metrics
Breakdown by View Type
Article Usage
Total Article Views: 41285
(from publication date up to now)
Breakdown by View Type
HTML Page Views: 32338
Abstract Page Views: 3918
PDF Downloads: 4373
Citation/Reference Downloads: 27
XML Downloads: 629
Web Metrics
Days since publication: 2193
Overall contacts: 41285
Avg. contacts per week: 131.78
Article Citations
Article citations are based on data periodically collected from the Clarivate Web of Science web site
(last update: Feb 2023)
Total number of cites (since 2018): 13
Average cites per year: 2.17
Publication Metrics
by Dimensions ©
Articles citing this article
List of the papers citing this article based on CrossRef Cited-by.
Related Contents
iForest Similar Articles
Review Papers
Comparative assessment for biogenic carbon accounting methods in carbon footprint of products: a review study for construction materials based on forest products
vol. 10, pp. 815-823 (online: 25 September 2017)
Research Articles
Carbon stock in Kolli forests, Eastern Ghats (India) with emphasis on aboveground biomass, litter, woody debris and soils
vol. 4, pp. 61-65 (online: 05 April 2011)
Research Articles
Voluntary carbon credits from improved forest management: policy guidelines and case study
vol. 11, pp. 1-10 (online: 09 January 2018)
Research Articles
Carbon emission reduction potentials through thinned wood in Japan
vol. 4, pp. 107-112 (online: 01 June 2011)
Review Papers
Carbon neutrality of forest biomass for bioenergy: a scoping review
vol. 16, pp. 70-77 (online: 05 March 2023)
Research Articles
Effects of tree species, stand age and land-use change on soil carbon and nitrogen stock rates in northwestern Turkey
vol. 9, pp. 165-170 (online: 18 June 2015)
Research Articles
An approach to estimate carbon stocks change in forest carbon pools under the UNFCCC: the Italian case
vol. 1, pp. 86-95 (online: 20 May 2008)
Research Articles
Assessing the carbon sink of afforestation with the Carbon Budget Model at the country level: an example for Italy
vol. 8, pp. 410-421 (online: 02 October 2014)
Research Articles
Integrating forest-based industry and forest resource modeling
vol. 9, pp. 743-750 (online: 12 August 2016)
Technical Reports
Allometric biomass and carbon factors database
vol. 1, pp. 107-113 (online: 09 July 2008)
iForest Database Search
Search By Author
Search By Keyword
Google Scholar Search
Citing Articles
Search By Author
Search By Keywords
PubMed Search
Search By Author
Search By Keyword


