Discovering interaction between oaks and carabid beetles on a local scale by point pattern analysis
iForest - Biogeosciences and Forestry, Volume 9, Issue 4, Pages 618-625 (2016)
doi: https://doi.org/10.3832/ifor1952-009
Published: May 06, 2016 - Copyright © 2016 SISEF
Research Articles
Abstract
The understanding of habitat demands of single species needs an explicit habitat element approach which includes both the effect of intensity of the habitat element on the species population and the spatial effect of that habitat element in a given matrix (e.g., forest or water). An established tool in ecological research for this purpose is the point pattern analysis, which yields information on relationships between organisms and habitat elements, as well as on interactions among individuals. However, the application of this tool seems to be restricted so far to locally fixed species and habitat elements. As our model system consists of carabid beetles and single old oak trees in a Scots pine forest, we needed to address the issue of fauna mobility in point pattern analysis. We adopted a random field approach to transform the lattice beetle traps data to point data. For the resulting bivariate point pattern we applied the toroidal shift test to verify the independence of tree and beetle distribution. To overcome the problem of irregular window shape, we reconstructed the oak data to obtain a point pattern in a larger rectangular window to make toroidal shifts possible. We could justify a positive spatial association between oak tree and carabid beetle distributions. By our results, specific spatial fields of oak influence on the beetle species can be derived which may allow for beetles supporting management measures like an increase of oak tree proportion and a more regular spatial distribution of single admixed oak trees. Those measures may increase the ecological effect of C. coriaceus as an antagonist for pest insects in mono-cultured Scots pine forests.
Keywords
Point Pattern Analysis, Species Association, Toroidal Shift Test
Introduction
Carabid beetles are often used as indicator species to assess the effects of environmental changes on insect populations arising from human impact ([35], [46], [18], [25]). A fairly recent aim of forest management is to protect these beetles and take advantage of the ecosystem services they provide, e.g., as predators to various forest pests ([43]). However, similarly to butterflies or birds ([14]), the effective protection and conservation of carabid beetles requires a thorough understanding of their habitat demands. The importance of structural forest variables (e.g., amount of dead wood, number of tree species present, percentage canopy cover and leaf-litter depth) for the carabid species assemblage has been demonstrated ([6]). Likewise, the abundance of particular species was affected by coarse wood debris cover or volume, herb cover, and the standard deviation of tree diameter in beech forests ([25]).
The link of species to defined environmental conditions is at the heart of the habitat concept ([30]). In this context, “habitat” cannot solely be described by abiotic conditions, e.g., soil moisture or slope ([8]). Habitats also consist of biotic resources, e.g., coarse woody debris or tree hollows ([21]).
Species are linked to essential parts of a habitat, which may include both abiotic as well as biotic components ([34], [26]). According to McComb ([21]) we should apply the term “habitat elements” to biotic components to account best for a species-related substructure within habitats. An “interspecific spatial association” occurs for example when individuals of a particular tree species serve as habitat elements for an animal species. These species associations may serve as a starting point for the analysis of biotic interactions such as competition, mutualism and predation.
For both aforementioned interspecific spatial relationships (i.e., link of species to habitat elements and link between species), the analysis of spatial point patterns has turned out to be highly valuable for the detection and description of a given spatial relationship ([49]).
Spatial point patterns of any kind of specified subjects (e.g., rocks, trees) may exhibit spatial dependence in themselves, e.g., inhibition or facilitation leading to spatial autocorrelation. Inferential statistics for bivariate point patterns tries to detect dependencies between two types of points. Ecologists have studied this kind of spatial autocorrelation by applying a number of methods to interspecific data. In the case of point patterns, the toroidal shift test seems the most widely established one ([7]). It was first proposed by Lotwick & Silverman ([19]) and is described in detail in Wiegand & Moloney ([47]). Essentially, the procedure generates new bivariate point patterns by simulation, where the points of one type are fixed, while the others are randomly shifted in order to destroy possible spatial correlations between the two types. Observation windows which are rectangular in shape are a prerequisite for the toroidal shift test because, as Baddeley & Turner ([1]) stated, “toroidal shifts are undefined if the window is non-rectangular”. Therefore the application of the toroidal shift test is often difficult in ecology.
Up till now, the analysis of spatial association by point pattern analysis in ecology mostly has been applied to plants (e.g., trees and herbs - [8]) and abiotic subjects (e.g., habitat, rocks, and settlements - [44]). For example, Illian et al. ([11]) discuss the case of plants and habitat elements, i.e., stones. An interesting example of point pattern analysis directed to mobile animals is reported by Zavala-Hurtado et al. ([49]) about leaf-cutting ants. The difficulty of performing point pattern analysis on data for mobile species lies in the definition of their explicit spatial positions. Here the use of random field data is a natural solution, that is, the use of frequency data in spatial cells. Indeed, animals like beetles are often caught in traps thereby disguising the beetles’ spatial position at a given moment in time ([31]). In such situations, the data are collected on a lattice-sampling basis, where the coordinates of each cell are known and the observed phenomenon is characterized by numbers of animals or area covered by plants per cell ([24], [36]). For statistical analysis it can be useful to convert the random field data to point pattern data, as described in Illian et al. ([11]). This can be achieved by simply scattering points in the cells, where the number of points is proportional to the random field values. The resulting point pattern in the cells can be considered as a “snapshot”.
In this paper we describe (i) an approach to transform random field data of mobile organisms into point patterns, and (ii) present a method to overcome the problem caused by non-rectangular windows in the toroidal shift test. We replace the random field values by point patterns in the cells and (re)construct larger point patterns in a rectangle containing the original window. The result is a bivariate point pattern in the polygon and a univariate point pattern in the surrounding rectangle. This permits application of the toroidal shift test. We applied this approach to the case of carabid beetles (random field data) and oak trees (point pattern). The aim of this study was to test the hypothesis of independence of oak and beetle distribution to gain further insight to the beetle’s habitat demands. The null hypotheses was the independence of oak and beetle distribution. By this, the study is a case study and the system of beetles and oaks in pine stands serves as a model.
Carabus coriaceus was chosen as the target species as former investigations described this species as relying on deciduous forests ([38]). By this, the hypothesis of a demand on deciduous oak trees by the beetles is derived reasonably.
The females of C. coriaceus have a lower locomotive activity than males and their motivation to find suitable oviposition sites gives further indication to a link to single oaks in pine forests ([9], [20]). As beetle species and even gender of the species behave differently, any result would have been blurred when data from different gender would have been lumped together.
Material and ethods
Study site
The study was established in a homogeneous Scots pine (Pinus sylvestris L.) stand with single-tree admixtures of 25 sessile oak (Quercus petraea Matt. Liebl.) trees randomly scattered throughout the stand. The stand is located at geographical coordinates 51° 47′ 09.69″ N, 13° 34′ 00.32″ E (Tab. 1).
Tab. 1 - Stand characteristics of the Scots pine forest where the investigation took place. The entire stand area is 28263.53 m². The mean annual precipitation amounts to 546 mm, elevation is 64 m a.s.l., and mean annual temperature is 9.4 °C.
| Parameter | Scots pine | Sessile oak |
|---|---|---|
| age [years] | 61 | 70-150 |
| number | 2455 | 25 |
| mean dbh [cm] | 24.2 | 27.3 |
| mean height [m] | 19.5 | 14.8 |
| mean height of lowest living branch [m] | 13.0 | 3.2 |
| mean crown length [m] | 6.5 | 11.6 |
| mean crown radius [m] | 1.3 | 3.8 |
The sessile oak trees (hereafter referred to as oaks) in the stand were considered important habitat elements as they were the only deciduous trees in the otherwise pure coniferous stand. The oaks were stem-mapped and their dbh (diameter at breast height) measured. As the stand was predominantly a pure stand of Scots pine, this species, though considered ecologically important as well, was regarded as noise in this study. The shape of the stand was irregular (Fig. 1) due to the management history, in which the neighboring stands were treated differentially.
Fig. 1 - Map showing the positions of 25 sessile oaks (blue circles) and 123 traps (red triangles) within the Scots pine stand. The width of the circles is proportional to the diameter of the oaks, the largest and smallest diameter being 80.2 and 14.2 cm, respectively. The black polygon represents the window of observation, with an area of 28263.53 m². The scale is given in meters.
To collect the carabid beetles (Carabus coriaceus L.), a total of 123 modified live-capture pitfall traps of a type described in Barber ([2]) but without catch liquid and lure, were placed in a 15 × 15 m grid over the whole study area (2.8263 ha - Fig. 1). However, the Scots pine trees hindered a perfect rectangular positioning of the traps as the distance between trap and tree was kept to a minimum of 1 m. The targeted grid width of 15 m was chosen to combine an optimal grid width for sampling large carabid beetles (according to [23], the trap distance should be 10 to 15 m) with an acceptable workload for monitoring the traps.
To combine the spatial distribution of carabid beetles with their species-specific properties, we recorded the gender (male vs female) as well as the stage of development (imagines vs larvae). In this paper, only the results for the females were analyzed. Once caught and marked, individuals were placed back (capture-recapture method) into the forest 2 meters beside the trap where the beetle was first caught. Sampling periods were July-November 2010, April-December 2011 and January-May 2012. The numbers of beetles in the defined periods of time were low which would induce additional variation. Thus, the data were pooled to enhance the characteristic spatial distribution pattern and to disregard temporal variations (Fig. 2).
Fig. 2 - Map showing the positions of 25 sessile oaks (blue circles) and 32 traps (red triangles) where at least one female Carabus coriaceus was caught. The size of triangles is proportional to the number of beetles caught in the trap, the largest number being 5. Traps with “zero” captures are not shown explicitly. The scale is given in meters.
Transformation of random field data to point data
For analyzing the relationship between beetle density and oak positions we used the approach described in Illian et al. ([11]) for the analysis of correlation between a random field and a point process. The key idea is to transform the random field data into point process data and then to study a bivariate point pattern. A rectangular cell of 15 × 15 m was placed at each grid point so that the grid point (i.e., the pitfall trap) was in the center. The number of beetles caught by a trap was assigned to its cell, which was considered as the catchment area of its trap. Then we generated independently random beetle point patterns within the cells, where the points in each cell were uniformly random as in a homogeneous Poisson point process. The number n of beetle points per cell was taken proportional to the number of beetles caught. To determine the value of n for single cells, a scaling factor was used to obtain the final number of beetles in each cell.
Statistical analysis of point patterns
After the transformation of the trap data to point data, we had two point patterns in the same window, i.e., a bivariate point pattern with 1 = beetle and 2 = oak. Our aim was to analyze the relationship between the two point patterns of the tree species (Quercus petraea) and the beetle species (Carabus coriaceus) by standard methods of point process statistics. Following Illian et al. ([11]), we described the spatial correlation by means of the partial or cross-pair correlation function g12(r). Since our window of observation was not rectangular (Fig. 1), we used the special estimators offered by R for estimating this function, with a bandwidth of 1 m.
If the cross-pair correlation function obviously deviates from the line of “complete spatial randomness”, we should test the hypothesis of independence or “no association”.
If the hypothesis of independence is rejected, a “proof” of spatial correlation between the two point patterns and, consequently, between the random field and point process is obtained and the function g12(r) presents valid information. In this test, we assumed that the two point patterns were the result of a superposition of two independent patterns, which means in our case that the positions of the beetles were independent of the oak trees. The test used here was the toroidal shift test ([11], [47]). This test is a simulation test, which compares the empirical L12 function with L12 functions belonging to newly-simulated bivariate patterns. While in the reference publications the test is based on the L12 function, it is here carried out using the g12 function. Using the g12 function does not change the principle of the test.
The newly simulated patterns are obtained as follows: the 1-points are fixed, while the new 2-points (i.e., the oaks) result from random shifting of all points using the same random vector ([11], [47]). Points which are shifted by this operation beyond the edge of the window are wrapped back onto the opposite edge; therefore the word “toroidal” is used. This procedure can be applied rigorously only if the window is rectangular.
In this way, a number s of simulated bivariate point patterns are generated and the corresponding g12 functions determined. The extremes of these associated g12 functions lead to envelopes that include the strip of deviation from the empirical g12 function which are acceptable if the independence hypothesis is true. If the empirical g12 function extends beyond this strip and crosses one of the envelopes, the independence hypothesis is rejected. Clearly, the number of simulations (s) controls the error of first kind of the test. The number of simulations we applied was s = 99.
All computations were performed using the software package “spatstat” in R version 3.0.1 ([1]).
Reconstruction of the pattern of 2-points in a larger rectangular window
For the toroidal shift null model a rectangular window is necessary. However, our window (Fig. 1) has an irregular shape and is clearly not rectangular. Therefore, we extended the pattern of 2-points (i.e., the oaks) from the inner original window to a larger rectangle surrounding the original window (Fig. 3). The extension was carried out by the method of reconstruction of point patterns developed by Tscheschel & Stoyan ([37]), also described in Illian et al. ([11]). In the given situation, a conditional approach was used where the points in the original window W (the dashed line displayed in Fig. 3) were fixed, while new points were constructed in the rectangle outside W. We denoted the complementary set “rectangle excluding W” by Rc.
Fig. 3 - Example of simulated beetle positions inside the window (homogeneous Poisson process, scaling factor = 10, compare to Fig. 2). The conditional simulation of point patterns of oaks outside the original polygon is based on the point pattern inside the original polygon. The scale is given in meters.
In the toroidal shift test only the pattern of 2-points (i.e., the oaks) is shifted. Therefore, we extended the pattern of oaks to the larger rectangle, while the pattern of beetles was not extended. The correlation statistics for 1- and 2-points was only made in the original irregular window. This means that the shifted 2-points which fall randomly outside the original window were ignored.
The parameters of the algorithm are described in Illian et al. ([11]). Only those parameters of the algorithm specially chosen in our study are described below.
The aim of the reconstruction algorithm was to obtain random points in Rc that followed statistical rules similar to those of the points in W, both within W.
The number n2 of 2-points in Rc is fixed as (eqn. 1):
and rounded to integers, where λ2 is the density of 2-points in W and A(Rc) the area of Rc. The algorithm starts with n2 points uniformly and independently distributed in Rc. It uses a “deviation-energy” which is minimized during the algorithm. The energy of the 2-point pattern Nk in the k-th step of reconstruction was calculated after Illian et al. ([11]) as follows (eqn. 2):
where L(r) is the L-function estimate (with translation correction) for the 2-pattern and L(k)(r) its counterpart for Nk and Hs(r) the spherical contact function estimate (Chiu-Stoyan estimator - see [11]) and Hs(k)(r) its counterpart for Nk, and (eqn. 3):
and (eqn. 4):
The integrals in eqn. 2 were approximated by finite sums of 100 summands.
In the case of reconstruction we carried out the toroidal shift test as follows. The 1-points in W were fixed; the 2-points lay in the large rectangle and were randomly shifted with toroidal correction; those of the shifted 2-points which fell into W were then used to calculate g12(r).
Results
Descriptive statistics
Fig. 1 and Fig. 2 show a weak spatial attraction of the beetles to the oaks, though the range of this correlation may be difficult to determine. The spatial distribution of the oak trees was not investigated intensively for as the number of oaks (25) was too small to apply ambitious statistics. However, part of the trees were quite close to each other, whereas others were positioned far away from the next conspecific (Fig. 1). The density of the oak trees in the original window was λ2 = 0.000885 oaks m-2.
The numbers of female beetles caught in the traps is displayed in Fig. 2. The number of traps with no beetles was 91, whereas 23 traps contained one beetle, 7 traps two beetles, one trap 3 beetles and one trap 5 beetles (which does not correspond to a Poisson distribution of numbers), totaling 45 beetles caught. Beetle density in the original window was λ1 = 0.015745 beetles m-2.
The true beetle density in the forest is of course higher than the empirical density of 45 beetles per 2.8263 hectare, since not all beetle females were caught. We estimated the true beetle density using information from the literature. To this purpose we used data from Reike ([27]), who reported 200 (Carabus hortensis L.) to 1500 (Carabus auratus L.) beetles (both males and females) per hectare. The aforementioned beetle species have a similar size (C. auratus: 17-30 mm; C. hortensis: 22-30 mm - [39]), but are smaller than C. coriaceus (30-40 mm). Thus, one may assume a total number of C. coriaceus of 600 per hectare. The total number of beetles caught in our investigation for all traps was 45. As this number denotes only female beetles caught on 2.8263 hectare, we chose a scaling factor of 10 to approach a number of female beetles per hectare (300 or 0.03 per m2). However, the results of the toroidal shift test were similar when 5 or 20 were chosen as scaling factors.
A classical, non-spatial, statistical approach yielded a coefficient of correlation of 0.1397 (Spearman’s rank correlation) between the number of oak trees in the 15 × 15 m grid squares and the number of beetles in the corresponding traps. This low value indicated no significant correlation. However, this result was questionable since the spatial aspect was completely ignored. The assignment of oaks to particular grid squares may be too rigorous, and effects between neighboring grid squares should be taken into account.
Transformation of random field data to point data and reconstruction
An example of a simulated beetle distribution map is given in Fig. 3, where the scaling factor is 10. Sub-areas with null density of beetles are clearly identifiable, as well as those of high density, with the beetle positions restricted within quadratic cells. Furthermore, Fig. 3 shows the result of the reconstruction of 2-points. The larger point pattern of 2-points was reconstructed from the original pattern of 25 oaks within the original window W plus 11 oaks outside the window W but within the rectangle, i.e., within Rc. The rectangle area was 40253.6 m².
Analysis of interspecific spatial interaction
The partial pair correlation function g12(r) was estimated for the bivariate point patterns obtained by transforming the random-field data of 1-points in the original window. Fig. 4 shows the results for 10 variants of snapshots, with 1 = beetles and 2 = oaks. All the curves are quite similar and confirm that there was a positive association between beetles and oaks, with a range of correlation of about 8 meters.
Fig. 4 - Results of bivariate (i.e., interspecific) point pattern analyses for simulated beetle positions and the 25 stem-mapped oaks: the curves show the estimated partial pair correlation functions g12(r) for ten simulated beetle patterns.
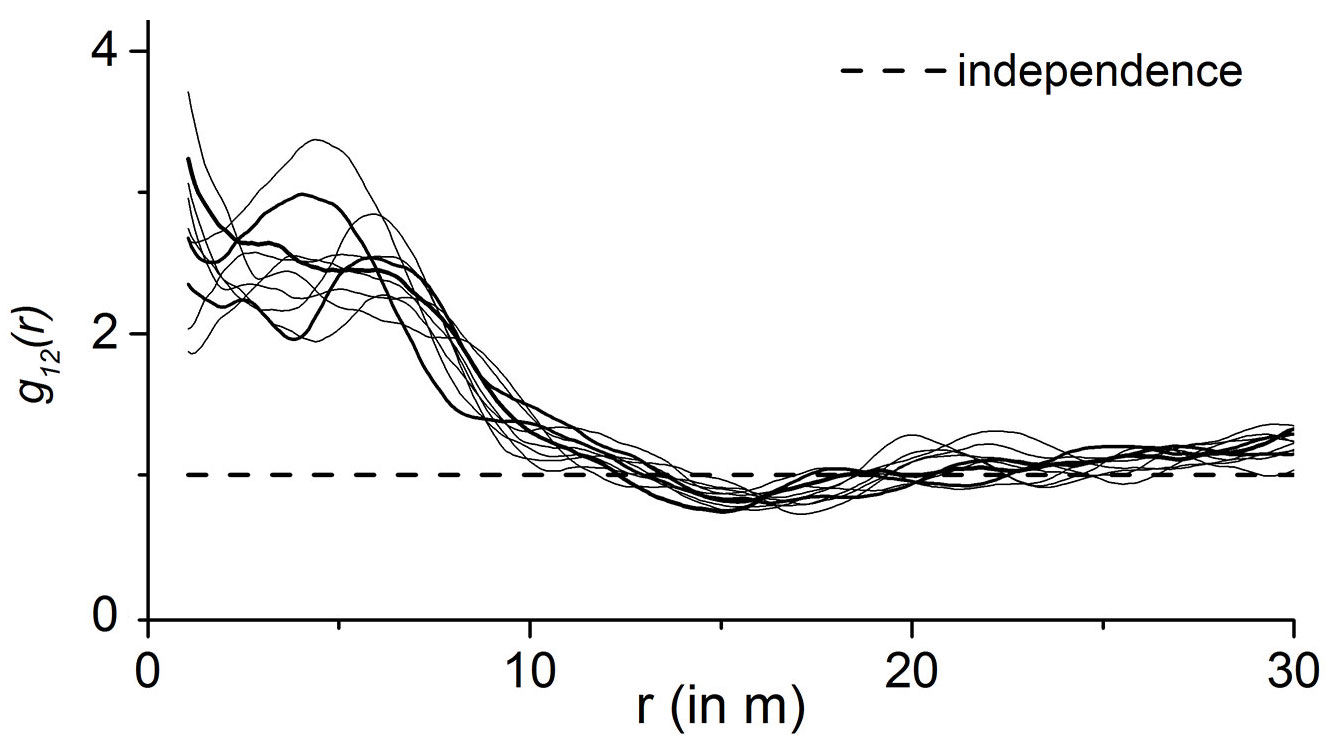
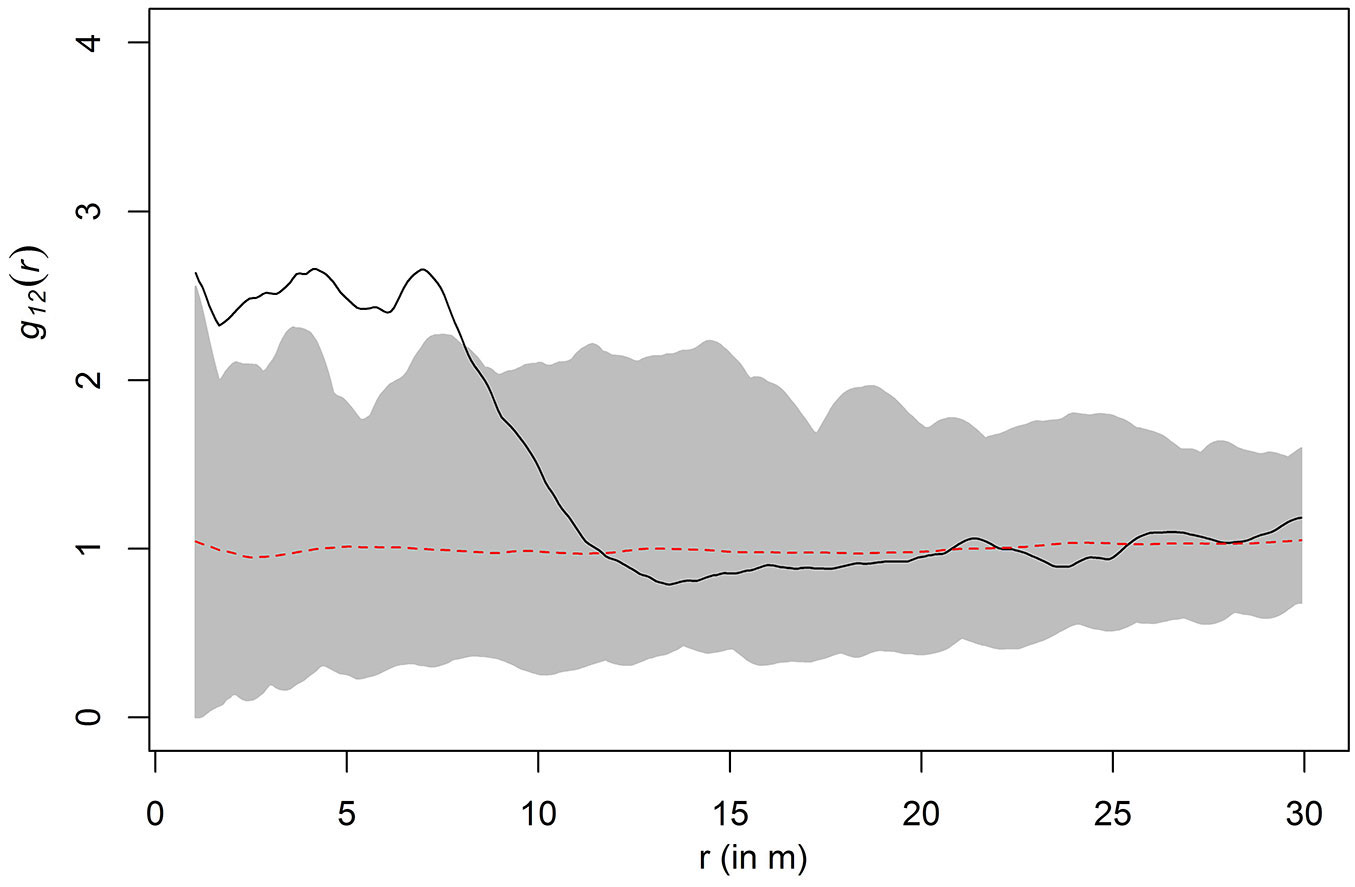
Fig. 5 shows that the correlation between beetles and oaks is significant. It shows the graph of the g12(r) function based on one of the 10 simulations shown in Fig. 4. In addition, the two envelopes obtained by 99 toroidal shifts and the critical strip between are shown. The envelopes result from 99 computations based on the fixed 1-points and the corresponding toroidal shift 2-points which lie within the original window. Since the g12(r) function leaves the critical area between the two envelopes, we concluded that the correlation is significant. The same result was also observed for the other nine simulations. Both Fig. 4 and Fig. 5 show a positive association between oaks and beetles at a distance up to 8 m, i.e., up to a distance of 8 m beetles were more often encountered than would be expected in the case of independence of oaks and beetles.
Fig. 5 - Result of the toroidal shift test for one of the simulated beetle patterns (compare to Fig. 3). The solid line represents the function g12(r); the dotted line represents independence; the shaded area lies between the envelopes from 99 simulations. Since the solid line extends beyond the shaded area, the independence hypothesis is rejected.
Discussion and conclusions
In this study we found a positive association between the two point patterns of female C. coriaceus beetles and oaks. As we have considered an ecologically asymmetric bivariate point pattern with the beetle occurrence being controlled by the oaks, we may conclude that beetles are attracted by oak trees, because up to a distance of 8 meters from oaks beetles are more often encountered than expected by chance alone. Moreover, a clear decreasing gradient of beetle occurrence with increasing distance from the oaks was observed (Fig. 4, Fig. 5). Thus, specific fields of oak influence on the beetle species can be derived, which may allow for beetles supporting management measures ([28], [15]). Due to the small area influenced by oak trees (crown projection area and litter distribution zone) and the relative large body size of C. coriaceus, the density of individuals (i.e., females) in this forest ecosystems is fairly limited (n = 45). Similarly, Kádár et al. ([13]) captured 57 females of C. coriaceus in 2.5 ha over three years in an open apple orchard. Considering the trap number and days, the number of captured beetles per trap per day was 0.006 in the aforementioned study, whereas in our case was 0.001.
The results obtained in this study may support forest management activities aimed at increasing the population density of beetles by increasing the oak tree proportion and setting a more regular spatial distribution of single admixed oak trees. Likewise, Straetz et al. ([33]) investigated the spatial distribution of coarse deadwood to support land molluscs population in forests.
Our findings may also help a better understanding of the reasons underlying the attractiveness of oaks to female beetles. Indeed, previous research carried out in the same Scots pine forest reported that the leaf litter of oak trees does not extend beyond a distance of 15 meters from the oak stem ([29], [45], [40]). Thus, an association of the beetles to oaks, in general, may actually reflect the association of beetles to the oak litter ([16]).
Our study was based on three simulation steps: (i) simulation in the transition from random-field data to point pattern data; (ii) simulation in the reconstruction algorithm; and (iii) simulation in the toroidal shift test. The first two steps could find wide application in ecology. Indeed, ecologists are often confronted with random-field data in the context of mobile objects (as in our study) or coverage data (as in Illian et al. ([11]). In such case, it is appropriate to replace random-field patterns by point patterns. We applied a snapshot-technique here, which may be refined by spatial interpolation (e.g., kriging - [36]). However, the chosen size of the cells in our investigation (15 × 15 m) seems to be small enough to appropriately sample spatial gradients of beetles activity and density.
In many applications in ecology, the windows of observation are not rectangular, since there are constrains due to natural edges that define such windows. The restriction of statistical analyses to rectangles inside the original irregular window often results in a considerable loss of information. While the estimation of summary characteristics can conveniently be carried out with point-process software, rectangular windows are essential for the important toroidal shift test. The reconstruction approach presented here may overcome this problem. However, the approach used in this study (i.e., to replace random-field data by point pattern data and to apply methods of point process statistics in a correlation analysis of point pattern and field data) is not the only option. One can also replace the point pattern by a field (where each point is replaced by some impulse after which all impulses are added) so that methods of random-field statistics (geostatistics) can be used. The choice of the approach is perhaps a question of preference.
Some prerequisites are necessary in the application of point pattern statistics to data from traps such as in this investigation, regarding (i) trap density, (ii) trap spacing and (iii) trap-to-tree ratio. The same issues are also of concern in the “inverse modeling” sensu Clark et al. ([3]) and thus we may benefit from comparisons with that kind of research here. “The [inverse modeling] approach uses the spatial pattern of seed recovered from seed traps and adult trees to statistically estimate the seed shadow” ([3]).
(i) A total trap number of 123 may be regarded as high. However, 91 of these traps did not catch any Carabus coriaceus female. Obviously, the number of traps must be in accordance with the density of the female beetles. This requires some a priori ecological knowledge. In inverse modeling, Clark et al. ([3]) were the first to stress that data availability for seed dispersal for many species may be limited, e.g., not enough seed traps in a sample to fit a function properly, or that data quality may vary substantially since this strongly depends on seed trap number.
(ii) The spacing of the traps should be regular to some extent, as the simulation was built on squares of equal size for each trap; different quadrat sizes would need some justification. Likewise, for inverse modeling of wind-dispersed seeds, Stoyan & Wagner ([32]) concluded that “a regular distribution of the traps might be optimal” referring to regular distances from the traps to a seed bearing tree.
(iii) Finally, the number of traps in relation to the number of trees should be as high as to obtain an appropriate spatial resolution of beetle positions in relation to different oaks. Accuracy of the estimates will suffer severely when this ratio shifts due to much higher oak numbers as the allocation of beetles to particular oaks will be more difficult. Wagner et al. ([42]) have documented the inadequacy of small trap-to-tree ratios when ambitious seed dispersal models were to be parameterized by inverse modeling. These experiences stress the importance of a careful selection of the experimental site in terms of the number and spatial pattern of habitat elements: few, heterogeneously scattered habitat elements are clearly to be preferred.
A habitat element considered positive, relevant or essential to a species population will cause a significantly increasing effect on the species intensity as compared with a habitat where this element is missing. The species-intensity effect of the habitat element should be spatially correlated to the element, either to be observed in the element itself, as in sunspots in the forest and the speckled wood butterfly (Pararge aegeria L. - [5]), or in the vicinity to the element, as in coarse woody debris and snails ([33]). However, much research regarding the link between a habitat element and species intensity has been undertaken by relying on only two factor levels: presence or absence, e.g., butterflies within and outside a canopy gap ([10]), beetles close to or far away from old oaks ([26]), or spiders at pine trees or away from pine trees ([50]). The latter kind of testing would best fit those effects which are exclusively located in the habitat element itself. However this kind of testing would underestimate the overall effect of habitat elements for those effects which spread into the surrounding, i.e., into the matrix. The latter is due to the fact that specimens in the vicinity of the habitat element are allocated to the surroundings and not to the habitat element itself in a “presence or absence’ testing. This applies especially in mobile species like beetles.
Additionally, we may be interested in the gradient of the effect beginning at the habitat element and decreasing or increasing with distance ([12], [4]). This could be of special interest when implementing management measures to increase biodiversity of particular species on a given area.
Forest science increasingly attempts to develop strategies which integrate the conservation of biodiversity in forest management concepts ([48], [41]). At a species level, those concepts are often founded on habitat elements ([21], [17]), their availability and spatial arrangement. To increase the ecological effect of C. coriaceus as an antagonist for pest insects in mono-cultured Scots pine forests, the following beneficial objectives should be pursued: (i) to support the vitality and growth dimension of oak trees; (ii) to increase their overall proportion within these forests, and (iii) to reduce the distances between single oak trees ([22], [16]).
In general, the available information on species’ demands in terms of amount and pattern of habitat elements is often insufficient. The method proposed here enables both to establish an intensity effect of a habitat element on a mobile species population and to describe a gradient of this effect into the surrounding matrix of Scots pine forest.
Acknowledgements
We thank the Michael-Jahr-Foundation, which financially supported the study through a scholarship to Alexandra Wehnert. The data set used was part of a more complex study concerned with the single-tree approach to forest ecology research. We thank Thorsten Wiegand for the idea to only reconstruct the pattern of 2-points; in an earlier version of the paper we had reconstructed the bivariate pattern. We finally thank two anonymous reviewers whose comments helped to substantially improve the manuscript.
References
Gscholar
Gscholar
CrossRef | Gscholar
Gscholar
Gscholar
Gscholar
Gscholar
Gscholar
Gscholar
Gscholar
Gscholar
Gscholar
Gscholar
Gscholar
Gscholar
Gscholar
Gscholar
Authors’ Info
Authors’ Affiliation
Alexandra Wehnert
Institute of Silviculture and Forest Protection, TU Dresden, Postfach 1117, D-01735 Tharandt (Germany)
Department of Mathematics, Hong Kong Baptist University, Kowloon Tong (Hong Kong)
Institute of Stochastics, TU Bergakademie Freiberg, D-09596 Freiberg (Germany)
Corresponding author
Paper Info
Citation
Wagner S, Wehnert A, Wong KY, Stoyan D (2016). Discovering interaction between oaks and carabid beetles on a local scale by point pattern analysis. iForest 9: 618-625. - doi: 10.3832/ifor1952-009
Academic Editor
Massimo Faccoli
Paper history
Received: Dec 16, 2015
Accepted: Mar 07, 2016
First online: May 06, 2016
Publication Date: Aug 09, 2016
Publication Time: 2.00 months
Copyright Information
© SISEF - The Italian Society of Silviculture and Forest Ecology 2016
Open Access
This article is distributed under the terms of the Creative Commons Attribution-Non Commercial 4.0 International (https://creativecommons.org/licenses/by-nc/4.0/), which permits unrestricted use, distribution, and reproduction in any medium, provided you give appropriate credit to the original author(s) and the source, provide a link to the Creative Commons license, and indicate if changes were made.

Web Metrics
Breakdown by View Type
Article Usage
Total Article Views: 51084
(from publication date up to now)
Breakdown by View Type
HTML Page Views: 41762
Abstract Page Views: 3733
PDF Downloads: 4093
Citation/Reference Downloads: 63
XML Downloads: 1433
Web Metrics
Days since publication: 3718
Overall contacts: 51084
Avg. contacts per week: 96.18
Article Citations
Article citations are based on data periodically collected from the Clarivate Web of Science web site
(last update: Mar 2025)
Total number of cites (since 2016): 5
Average cites per year: 0.50
Publication Metrics
by Dimensions ©
Articles citing this article
List of the papers citing this article based on CrossRef Cited-by.
Related Contents
iForest Similar Articles
Research Articles
Stand structure and regeneration of Cedrus libani (A. Rich) in Tannourine Cedar Forest Reserve (Lebanon) affected by cedar web-spinning sawfly (Cephalcia tannourinensis, Hymenoptera: Pamphiliidae).
vol. 11, pp. 300-307 (online: 13 April 2018)
Technical Advances
Forest stand height determination from low point density airborne laser scanning data in Roznava Forest enterprise zone (Slovakia)
vol. 6, pp. 48-54 (online: 21 January 2013)
Research Articles
Analysing interaction effects in forests using the mark correlation function
vol. 1, pp. 34-38 (online: 28 February 2008)
Research Articles
Advantages of the point-intercept method for assessing functional diversity in semi-arid areas
vol. 8, pp. 471-479 (online: 31 October 2014)
Research Articles
The nurse-plant effect under the dislodgement stress of landslides
vol. 16, pp. 78-85 (online: 16 March 2023)
Research Articles
Case study of a new method for the classification and analysis of Dryocosmus kuriphilus Yasumatsu damage to young chestnut sprouts
vol. 5, pp. 50-59 (online: 10 April 2012)
Research Articles
Identification of the ambrosia beetle Anisandrus dispar (Fabricius) (Coleoptera Curculionidae Scolytinae) using TaqMan™ probe assay on biological samples
vol. 16, pp. 182-187 (online: 30 June 2023)
Research Articles
Identification and characterization of gaps and roads in the Amazon rainforest with LiDAR data
vol. 17, pp. 229-235 (online: 03 August 2024)
Research Articles
Spatial structure of the vertical layers in a subtropical secondary forest 57 years after clear-cutting
vol. 12, pp. 442-450 (online: 16 September 2019)
Research Articles
The spread of the non-native pine tortoise scale Toumeyella parvicornis (Hemiptera: Coccidae) in Europe: a major threat to Pinus pinea in Southern Italy
vol. 11, pp. 628-634 (online: 04 October 2018)
iForest Database Search
Search By Author
Search By Keyword
Google Scholar Search
Citing Articles
Search By Author
Search By Keywords
PubMed Search
Search By Author
Search By Keyword


