
Nitrogen deposition and its impact on forest ecosystems in the Czech Republic - change in soil chemistry and ground vegetation
iForest - Biogeosciences and Forestry, Volume 10, Issue 1, Pages 48-54 (2016)
doi: https://doi.org/10.3832/ifor1847-009
Published: Jun 29, 2016 - Copyright © 2016 SISEF
Research Articles
Collection/Special Issue: IUFRO RG7.01.00 - Nice (France 2015)
Global Challenges of Air Pollution and Climate Change to Forests
Guest Editors: Elena Paoletti, Pierre Sicard
Abstract
A repeated soil survey (1995 and 2006) on 66 ICP Forests pair plots in the Czech Republic revealed a significant relationship between modeled nitrogen deposition and nitrogen concentration in the soil. Nitrogen deposition was modeled for the years 1995, 2004 and 2006. We found a more significant relationship between deposition data in 2004 and soil data in 2006 than between deposition and soil data from the same year 2006. Concentration of total nitrogen in forest soil increased from 1995 to 2006. Forest soil showed effects of increased nitrogen input from the humus layer to around 20 cm depth of mineral soil. The occurrence and cover of nitrophilous species in the herb layer increased from 1995 to 2006 in 25% of the analyzed plots, which corresponds to the nitrogen increase in forest soil. The results suggest that nitrogen deposition still represents a threat for Czech forest ecosystems.
Keywords
Nitrogen Deposition, Soil Chemistry, Ground Vegetation, Ecosystem Changes, Norway Spruce
Introduction
During the whole 20th century, a major impact of human activity on the European environment has been reported, especially on forests. In the Czech Republic, the first reports on the negative effect of sulphur emissions date back to the first half of the 20th century ([40], [43]). Emissions of sulphur and nitrogen (N) compounds and heavy metals increased continuously and peaked between the mid-70s and mid-80s ([22]). Effects of SO2 on forest ecosystems were studied due to its very high levels, and changes in forest soil were mainly investigated ([19], [32], [48], [21], [30]). After desulphurisation of pollution sources during the 90s, ambient air quality improved rapidly, though forest ecosystems did not respond in the same way. Acid deposition led to base cations leaching from upper soil horizons and then to crown transparency ([26], [34], [23]). Soil acidification by sulphur and N compounds can cause both a loss of base cations and mobilization of aluminium and other metal compounds, and it has many consequences on forest vitality and vulnerability to other stress factors ([8], [36]). In recent decades, more attention has been paid to N and its compounds. De Vries et al. ([7]) reported a 25% decrease of N emissions since 1985, but the amount of N emission is still roughly four times as high as in pre-industrial times. Eutrophication continues to be a serious threat to European ecosystems. In 1980 critical loads of nutrient N were exceeded in about 67% of the European area, and are expected to decrease to 42% in 2020 ([31]). Between 1980 and 2020, ecosystems of Central Europe were confirmed to be at high risk of eutrophication ([31]). Critical loads of nutrient N were exceeded in about 100% of the forested area of the Czech Republic in 1994 ([51]), and in 95% of the forested area in 2007 ([52]).
The effect of N input on the forest ecosystem is complex and disputable - from fertilisation ([41], [42], [17]) to acidification ([49], [50], [51], [1], [45]). Also its potential to cause a loss of diversity in understory vegetation in forest stands is complex ([29], [47], [20], [4]). The relationship between N addition and biodiversity has been experimentally tested ([33]), showing that N-addition leads to a decrease in biodiversity. Further negative influences of N deposition may be the reduction of root biomass, mycorrhiza and microbial activity, and this in turn may negatively affect nutrient uptake, especially uptake of phosphorus, leading to nutrient imbalance in foliage ([35], [39], [28], [12]). In connection with higher N input to the forest stands, a positive fertilization effect on growth is likely. For instance, Austrian forest soil is still deficient in N and stands respond positively to higher N deposition ([17]). The positive effect of N on forest growth is mentioned by, among others, Solberg et al. ([41], [42]). On the other hand, previous studies confirmed that forest ecosystems turned from N-limited to N-saturated ([27], [6], [20]) and that negative effect of elevated N input causes nutrient imbalance in forest foliage ([3], [24], [25]).
The aim of our paper was to evaluate changes in soil chemistry and in ground level vegetation composition caused by N deposition between two forest surveys which were done in the Czech Republic.
Material and methods
Ground vegetation assessment
Forest vegetation was monitored within the ICP Forests Programme in accordance with Canullo et al. ([5]) at 154 selected plots in the Czech Republic. The assessment was repeated approximately every five years since 1995, taking about three years to assess all the 154 plots. At least three assessments were available for each plot. Basic investigation was carried out during the peak growing season, preferably during the summer, though in certain areas with significant seasonality (e.g., in floodplain forests) spring, or late summer to autumn, were also chosen for survey. The status of the vegetation was evaluated using classic semi-quantitative phytosociological relevés. The assessment was carried out at the center of circular plots with an area of 400 m2 (radius of 11.28 m). A modified semi-quantitative seven-item combined scale of abundance and dominance was used, in accordance with the Braun-Blanquet’s concept ([2]), as described in Buriánek et al. ([4]). Within ground level vegetation, we focused on species that are considered as indicators of increased N content in the soil and, at the same time, also occur at multiple sites (for example, Urtica dioica L., Geranium robertianum L., Impatiens parvifloraI DC., Alliaria petiolata (M.Bieb.) Cavara & Grande).
Soil survey and data
The first survey was done in 1995-1996 within a national inventory by using a national methodology for sampling ([10]); the second survey was carried out in 2005-2008 within the BioSoil project by using an international methodology ([44]). The main difference between the two surveys was the range of sampling. Soil samples were taken from soil pit at fixed depth every 10 cm (0-10 cm, 10-20 cm, 20-30 cm, etc.) up to 80 cm in the first survey and at fixed depths of 0-10 cm, 10-20 cm, 20-40 cm and 40-80 cm in the second survey. We assessed selected soil parameters up to 20 cm depth, so that results were comparable as the sampling interval was the same down to 20 cm depth. We chose plots and parameters (pH(CaCl2), pH(H2O), total carbon and N concentration, C/N ratio), and soil layers (humus layer, mineral soil 0-10 cm and mineral soil 10-20 cm depth) which were analyzed in both surveys. The number of plot pairs was 66. The main characteristics of the surveyed plots are summarized in Tab. 1.
Tab. 1 - Basic characteristics of the plots assessed in both soil surveys (1995 and 2006) and chosen for comparison. The total number of plots was 66.
| Parameter | Tree species / range of parameter |
Number |
|---|---|---|
| Main tree species | Norway spruce | 46 |
| Scots pine | 7 | |
| European beech | 3 | |
| clear cut between surveys | 10 | |
| Age in 1995 | < 50 | 0 |
| 51-100 | 45 | |
| >100 | 8 | |
| not known | 13 | |
| Age in 2006 | < 50 | 8 |
| 51-100 | 28 | |
| >100 | 25 | |
| not known | 5 | |
| Altitude | < 400 m a. s. l. | 8 |
| 401-800 m a. s. l. | 49 | |
| > 800 m a. s. l. | 9 |
Chemical analysis was carried out in accordance with the standard operating procedures which are recommended by the ICP Forests programme ([44]).
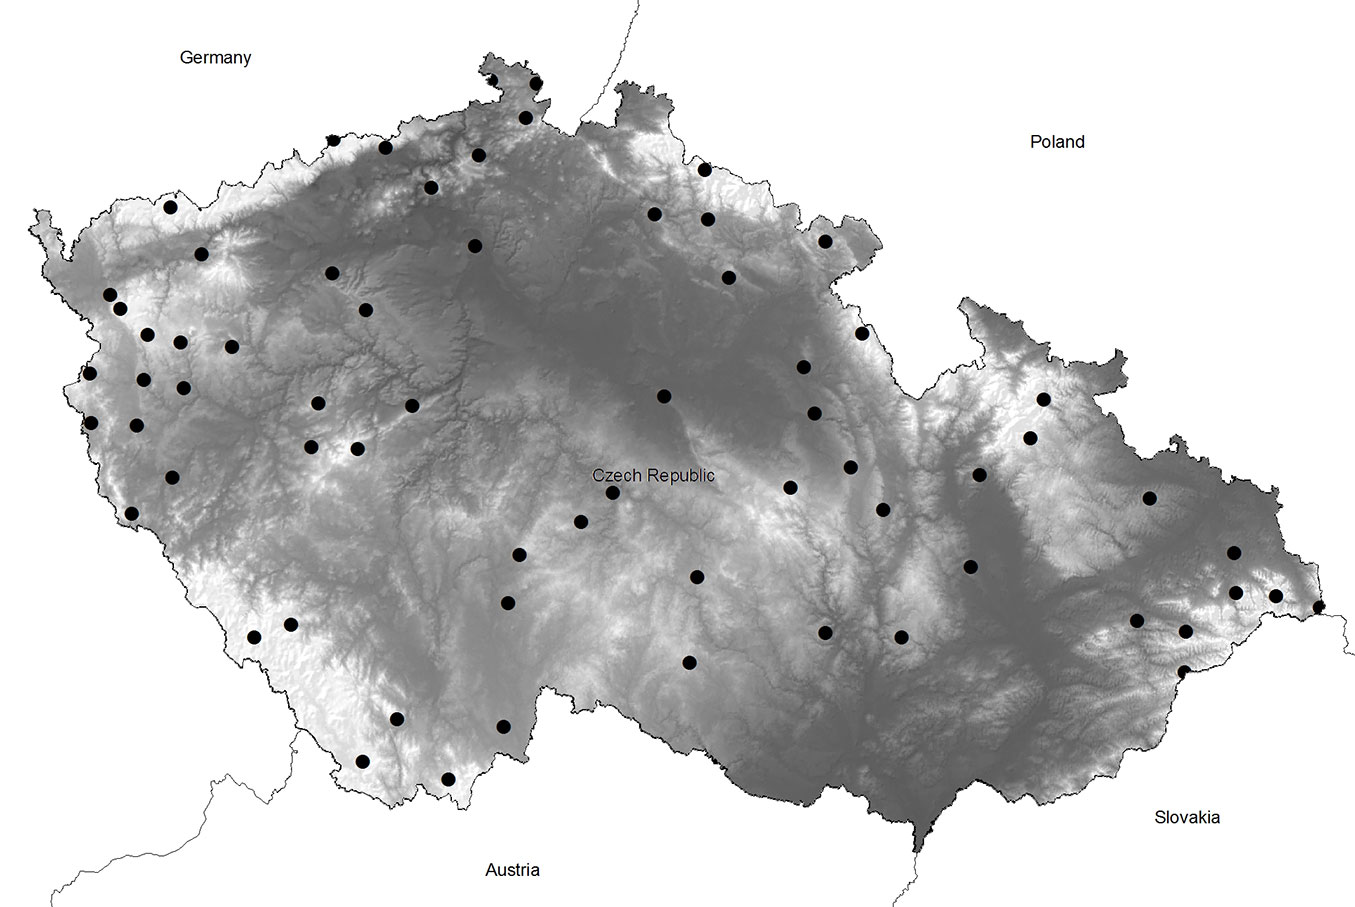
The distribution of plots across the Czech Republic is shown in Fig. 1.
Fig. 1 - Location of the plots (black dots) selected for the vegetation survey in the Czech Republic.
Deposition data
To estimate the atmospheric deposition of N and H+ ions at selected plots, we used maps produced by adding wet and dry deposition flux maps with a fine spatial resolution of 1 × 1 km. The method was described in detail by Hunová et al. ([14]) and Hunová et al. ([15]). Wet deposition was calculated based on automated wet-only samples on a weekly basis, analyzed by standard methods with comprehensive QA/QC procedures. Dry deposition was estimated using the inferential method, combining measurements and modeling. A digital map of Czech forests produced from the European digital Land Use map (Corine Land Cover 2000 - ⇒ http://etc-lusi.eionet.europa.eu/CLC2000) was used. All maps were prepared using the software ArcGIS® Geostatistical Analyst ([18]). For selected plots total N and total H+ ions deposition in 1995, 2004 and 2006 were calculated.
Data analyses
After carrying out the exploratory data analysis, their departure from normal distribution was tested. Data sets were tested as dependent or independent samples (according to input data sets); non-parametric tests (Sign test, Wilcoxon pair test, Kruskal-Wallis ANOVA, Median test) were used, because normality was rejected after Shapiro-Wilk W-test. For testing the relationship between deposition and soil parameters, we also used non-parametric test (Spearman R and Kendall tau correlation). Statistical analysis of the data was performed using the package Statistica® Cz version 12.0 (StatSoft Inc., Tulsa, OK, USA).
Results
Vegetation assessment
Overall, the selected nitrophilous indicator species were identified at 74 out of 154 plots (48%) in 2011. At 39 of these sites, their occurrence was rather sporadic (1-2 species with coverage of up to 0.5%). At 13 sites, the occurrence of nitrophilous species was evaluated as significant (usually more species, though with a relatively low coverage of up to 5%). At 22 sites, there was a significant occurrence of nitrophilous species with a high coverage (above 5%). At other sites (80 plots) the occurrence of nitrophilous species was not recorded. At a total of 38 sites (25%), the presence of nitrophilous species increased during the period analyzed (1995-2011), while a reduction was recorded at seven plots. In addition to the above mentioned species, also Rubus spp., Galium aparine L., Lamium purpureum L. or Anthriscus sylvestris (L.) Hoffm. showed an increased occurrence. Regarding woody species, elder (Sambucus nigra L.) showed an increased frequency. Also invasive alien species increased, mainly Impatiens glandulifera Royle and Erechtites hieraciifolia (L.) Raf. ex DC.
When comparing groups of sites for the occurrence of selected nitrophilous species, there were no statistically significant differences in N concentration (Tab. 2), while the C/N ratio, which provides a better evidence of ecosystem N saturation, differed among sites (Tab. 2).
Tab. 2 - Non-parametric test of difference in nitrogen concentration and C/N ratio in soil between plots with and without selected nitrophilous species. P-values of Kruskal-Wallis ANOVA (KW) and median test (MT) are shown. (w): number of plots with nitrophilous species; (wo): number of plots without nitrophilous species; (FH): humus layer; (M01): mineral soil (0-10 cm); (M12): mineral soil (10-20 cm); (Ntot): total nitrogen concentration in soil; (C/N): carbon to nitrogen ratio in the soil.
| Species | w/wo | Test | FH | M01 | M12 | |||
|---|---|---|---|---|---|---|---|---|
| Ntot | C/N | Ntot | C/N | Ntot | C/N | |||
| Geranium robertianum | 24/121 | KW | 0.205 | 0.000 | 0.074 | 0.000 | 0.007 | 0.000 |
| MT | 0.192 | 0.000 | 0.168 | 0.000 | 0.023 | 0.000 | ||
| Impatiens parviflora | 30/115 | KW | 0.622 | 0.006 | 0.571 | 0.001 | 0.238 | 0.001 |
| MT | 0.966 | 0.045 | 0.388 | 0.045 | 0.203 | 0.000 | ||
| Sambucus nigra | 33/112 | KW | 0.320 | 0.045 | 0.233 | 0.001 | 0.233 | 0.000 |
| MT | 0.345 | 0.033 | 0.152 | 0.001 | 0.523 | 0.000 | ||
| Urtica dioica | 50/95 | KW | 0.693 | 0.000 | 0.011 | 0.000 | 0.001 | 0.002 |
| MT | 0.772 | 0.000 | 0.012 | 0.000 | 0.000 | 0.001 | ||
Changes in soil
Soil pH increased (Fig. 2) between the two soil surveys, which means that forest soil was less acid in 2006 than in 1995. Concentrations of carbon and N in soil increased as well. Increase in carbon was higher than increase in N, thus resulting in an increased C/N ratio.
Fig. 2 - Box plots for selected parameters according to soil layer and year of soil survey.
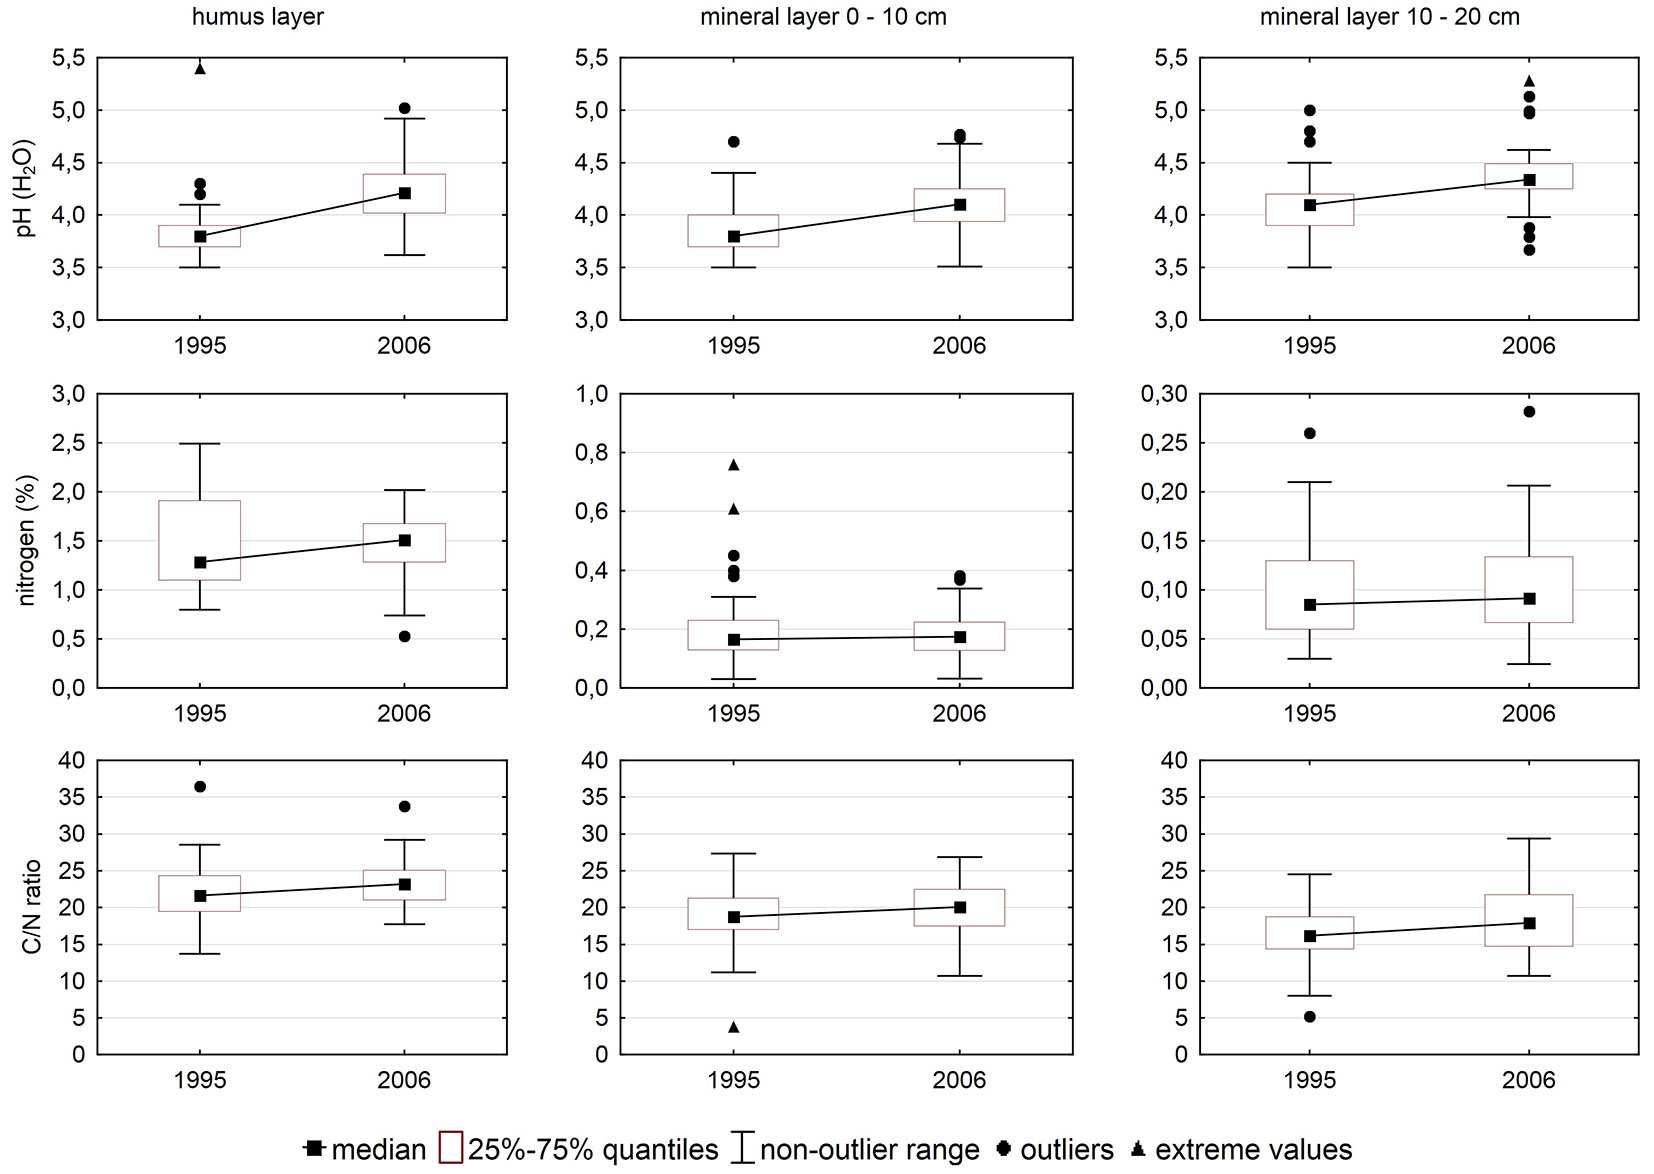
Differences between the two surveys were significant in nearly all cases (Tab. 3).
Tab. 3 - Significance of differences in selected soil parameters between 1995 and 2006 after non-parametric pair tests. (ST): Sign test; (WPT): Wilcoxon pair test; (FH): humus layer; (M01): mineral soil (0-10 cm); (M12): mineral soil (10-20 cm).
| Parameter | Horizon | n | p-value | |
|---|---|---|---|---|
| ST | WPT | |||
| pH (CaCl2) | FH | 65 | 0.000 | 0.000 |
| M01 | 66 | 0.010 | 0.003 | |
| M12 | 64 | 0.004 | 0.000 | |
| pH (H2O) | FH | 65 | 0.000 | 0.000 |
| M01 | 66 | 0.000 | 0.000 | |
| M12 | 66 | 0.000 | 0.000 | |
| carbon | FH | 66 | 0.036 | 0.006 |
| M01 | 66 | 0.000 | 0.000 | |
| M12 | 66 | 0.000 | 0.000 | |
| nitrogen | FH | 66 | 0.176 | 0.072 |
| M01 | 66 | 0.000 | 0.000 | |
| M12 | 66 | 0.000 | 0.000 | |
| C/N ratio | FH | 66 | 0.110 | 0.047 |
| M01 | 66 | 0.005 | 0.060 | |
| M12 | 66 | 0.110 | 0.015 | |
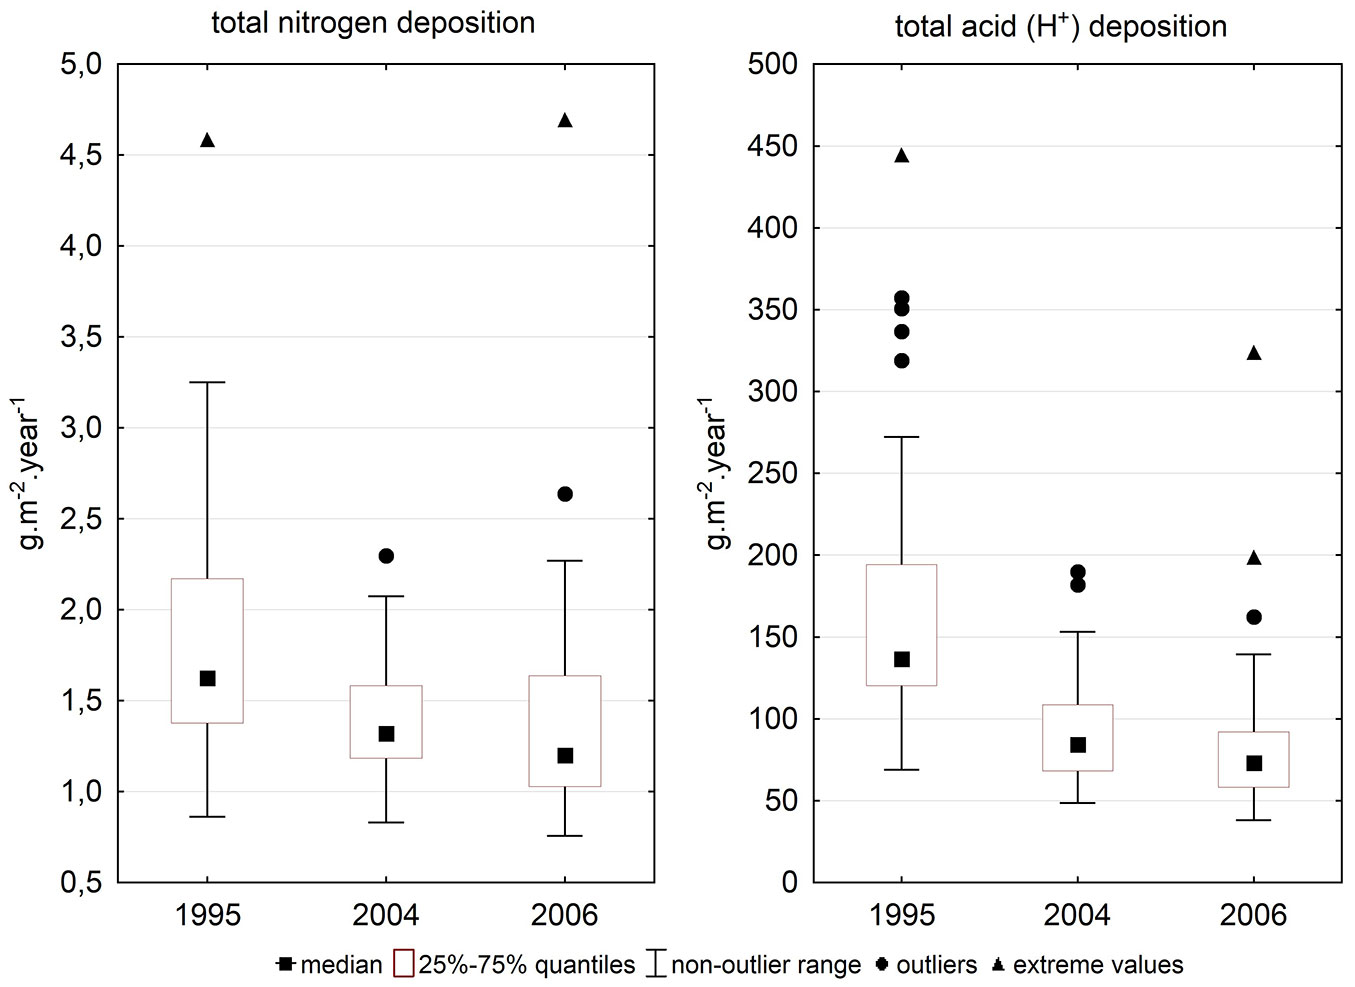
The difference between total N deposition in 2004 and 2006 was non-significant (Tab. 4), while other differences were highly significant. Deposition was higher in 1995 than 10 years later (Fig. 3).
Tab. 4 - Significance of differences in total nitrogen deposition and total H+ ions deposition between 1995, 2004 and 2006 after non-parametric pair tests. (ST): Sign test; (WPT): Wilcoxon pair test; (N): total nitrogen deposition; (H+): total acid deposition.
| Pair Comparison | p-value | |
|---|---|---|
| ST | WPT | |
| N 1995 - N 2004 | 0.000 | 0.000 |
| N 1995 - N 2006 | 0.000 | 0.000 |
| N 2004 - N 2006 | 0.065 | 0.121 |
| H+ 1995 - H+ 2004 | 0.000 | 0.000 |
| H+ 1995 - H+ 2006 | 0.000 | 0.000 |
| H+ 2004 - H+ 2006 | 0.000 | 0.000 |
Fig. 3 - Modeled deposition for the selected monitoring plots and years.
Relationship between deposition load and soil parameters
Correlations between deposition in 1995 and soil parameters in 1995 and between deposition in 2004 and in 2006 and soil parameters in 2006 were tested. The results are reported in Tab. 5.
Tab. 5 - Correlation between total nitrogen deposition and total H+ ions deposition and selected soil parameters. For each parameter/horizon combination, the P-values (first row, in italic) and the correlation coefficient (second row) are reported. (S-R): Spearman R correlation test; (K-T): Kendall Tau correlation test; (FH): humus layer; (M01): mineral soil (0-10 cm); (M12): mineral soil (10-20 cm).
| Parameter (1995/2006) |
Horizon | Total nitrogen deposition | Total acid deposition | ||||||||||
|---|---|---|---|---|---|---|---|---|---|---|---|---|---|
| 1995 (n=66) p-value/ corr. coef. |
2004 (n=66) p-value/ corr. coef. |
2006 (n=66) p-value/ corr. coef. |
1995 (n=65) p-value/ corr. coef. |
2004 (n=66) p-value/ corr. coef. |
2006 (n=66) p-value/ corr. coef. |
||||||||
| S-R | K-T | S-R | K-T | S-R | K-T | S-R | K-T | S-R | K-T | S-R | K-T | ||
| pH (CaCl2) | FH | 0.040 | 0.030 | 0.613 | 0.484 | 0.294 | 0.296 | 0.258 | 0.238 | 0.868 | 0.841 | 0.113 | 0.107 |
| -0.25 | -0.18 | -0.06 | -0.06 | 0.13 | 0.09 | -0.14 | -0.10 | 0.02 | 0.02 | 0.20 | 0.14 | ||
| M01 | 0.019 | 0.016 | 0.835 | 0.790 | 0.527 | 0.648 | 0.048 | 0.041 | 0.721 | 0.673 | 0.496 | 0.483 | |
| -0.29 | -0.20 | -0.03 | -0.02 | 0.08 | 0.04 | -0.25 | -0.17 | -0.04 | -0.04 | 0.09 | 0.06 | ||
| M12 | 0.327 | 0.345 | 0.997 | 0.942 | 0.429 | 0.446 | 0.149 | 0.109 | 0.398 | 0.394 | 0.906 | 0.951 | |
| -0.12 | -0.08 | 0.00 | -0.01 | 0.10 | 0.06 | -0.18 | -0.14 | -0.11 | -0.07 | 0.01 | 0.01 | ||
| pH (H2O) | FH | 0.013 | 0.006 | 0.591 | 0.548 | 0.781 | 0..773 | 0.109 | 0.113 | 0.971 | 0.991 | 0.615 | 0.594 |
| -0.30 | -0.23 | -0.07 | -0.05 | 0.03 | 0.02 | -0.20 | -0.13 | 0.00 | 0.00 | 0.06 | 0.04 | ||
| M01 | 0.010 | 0.007 | 0.619 | 0.541 | 0.592 | 0.640 | 0.059 | 0.041 | 0.640 | 0.697 | 0.590 | 0.593 | |
| -0.32 | -0.23 | -0.06 | -0.05 | 0.07 | 0.04 | -0.24 | -0.17 | -0.06 | -0.03 | 0.07 | 0.04 | ||
| M12 | 0.126 | 0.102 | 0.429 | 0.396 | 0.769 | 0.780 | 0.125 | 0.093 | 0.189 | 0.215 | 0.706 | 0.754 | |
| -0.19 | -0.14 | -0.10 | -0.07 | 0.04 | 0.02 | -0.19 | -0.14 | -0.16 | -0.10 | -0.05 | -0.03 | ||
| Nitrogen | FH | 0.350 | 0.392 | 0.048 | 0.042 | 0.562 | 0.532 | 0.265 | 0.258 | 0.770 | 0.778 | 0.356 | 0.301 |
| -0.12 | -0.07 | 0.24 | 0.17 | 0.07 | 0.05 | -0.14 | -0.10 | 0.04 | 0.02 | -0.12 | -0.09 | ||
| M01 | 0.004 | 0.005 | 0.060 | 0.058 | 0.141 | 0.149 | 0.311 | 0.345 | 0.999 | 0.960 | 0.681 | 0.761 | |
| 0.35 | 0.24 | 0.23 | 0.16 | 0.18 | 0.12 | 0.13 | 0.08 | 0.00 | 0.00 | -0.05 | -0.03 | ||
| M12 | 0.076 | 0.056 | 0.031 | 0.040 | 0.098 | 0.069 | 0.377 | 0.369 | 0.961 | 0.881 | 0.883 | 0.969 | |
| 0.22 | 0.16 | 0.27 | 0.17 | 0.21 | 0.15 | 0.11 | 0.08 | 0.01 | 0.01 | -0.02 | 0.00 | ||
| C/N ratio | FH | 0.309 | 0.367 | 0.000 | 0.000 | 0.000 | 0.000 | 0.993 | 0.955 | 0.002 | 0.002 | 0.072 | 0.074 |
| 0.13 | 0.08 | -0.50 | -0.35 | -0.44 | -0.32 | 0.00 | 0.00 | -0.38 | -0.26 | -0.22 | -0.15 | ||
| M01 | 0.676 | 0.634 | 0.035 | 0.053 | 0.055 | 0.055 | 0.362 | 0.300 | 0.023 | 0.022 | 0.144 | 0.146 | |
| 0.05 | 0.04 | -0.26 | -0.16 | -0.24 | -0..16 | 0.11 | 0.09 | -0.28 | -0.19 | -0.18 | -0.12 | ||
| M12 | 0.809 | 0.710 | 0.593 | 0.559 | 0.225 | 0.197 | 0.578 | 0.610 | 0.373 | 0.367 | 0.344 | 0.350 | |
| 0.03 | 0.03 | -0.07 | -0.04 | -0.15 | -0.11 | 0.07 | 0.04 | -0.11 | -0.08 | -0.12 | -0.08 | ||
In 1995 total N deposition increased with decreasing pH in the humus layer and 0-10 cm mineral soil, while N deposition and N concentration increased in tandem at depth 0-10 cm of mineral soil. In the mineral soil layer at 10-20 cm, total N deposition and N concentration were significantly correlated. When the relationship between total H+ ions deposition and soil parameters was tested, there was only a negative correlation with pH in the mineral soil. A stronger effect was visible at 0-10 cm mineral soil depth. No significant correlation was found between total H+ ions deposition and N concentration as well as C/N ratio, and between total N deposition and C/N ratio.
In 2006, we tested the influence of total N deposition and total H+ ions deposition on soil chemistry for the same year of the soil survey (in 2006) and we also tested the influence of deposition calculated in 2004 and its correlation with soil chemistry in 2006. We found more significant results for deposition data in 2004 and soil data in 2006 than for deposition data in 2006 and soil data in 2006. Total N deposition in 2004 increased with increasing N concentration in the humus layer and in the mineral soil at 10-20 cm depth in 2006. Total N deposition in 2004 decreased with increasing C/N ratio in the humus layer and mineral top soil at 0-10 cm in 2006. Correlation between total N deposition in 2006 and selected soil parameters in 2006 was significant only for C/N ratio in the humus layer. Total H+ ions deposition in 2004 was negatively correlated with C/N ratio in the humus layer and mineral top soil at 0-10 cm in 2006. Total H+ ions deposition in 2006 was significant only for C/N ratio in the humus layer in 2006.
Discussion
During the past 20 years, a higher proportion of nitrophilous species was detected in Czech forests ([4]), likely due to the elevated N deposition. Similar results have been reported across Europe ([13], [11]). The gradual replacement of oligotrophic species by eutrophic species as a response to N deposition has been observed at the European scale based on long-term monitoring at 28 forest sites with a total of 1335 permanent forest floor vegetation plots ([9]). The spread of nitrophilous species throughout the forest suggests the N saturation of forest ecosystems. While the overall N deposition slightly decreased, in some regions there was again a weak increase ([15]). A slight but significant increase of nitrophilous species within the ICP Forests monitoring plots in Europe in connection with N deposition is reported also by Seidling et al. ([37]).
Changes in total N concentration in forest soil between the surveys in 1995 and in 2006 and correlation between total N deposition and total N concentration in soil were significant. The relationship between 2004 deposition and 2006 soil chemistry was more significant than the relationship between deposition load and soil chemistry in the same year. This confirms that there is a time lag between the input of the compounds to the forest and their measurable effects on the ecosystem. Results from N deposition measurements across Europe confirm our findings - there is a slight decrease in N deposition, but critical deposition loads for nutrient N are exceeded in more than half of the monitoring plots in Europe ([38]). Critical loads for inorganic N deposition were exceeded on about a third to a half of the monitored forest plots of the ICP Forests Level II network across Europe ([46]). Elevated inorganic N concentrations in soil solution occurred more frequently in these plots ([46]). Indications of nutrient imbalances, such as low magnesium concentration in foliage or discoloration of needles and leaves, were rare but appeared more frequently on plots where the critical limits for soil solution were exceeded ([46]). Also in the Czech Republic there are regions where elevated N concentration in soil leads to nutrient imbalance, especially between N and phosphorus and N and magnesium ([24], [25]).
Our results show that all evaluated soil horizons (humus layer and mineral soil up to 20 cm depth) are affected by high N input. This is an important confirmation that not only the soil surface is influenced. It clearly shows that forest soil is already saturated by N in some regions and that there is mid- or long-term influence of N compounds on forest soil. If the soil is N-saturated, there is a risk of high leaching of N compounds to the ground water. In the Czech Republic, the monitoring of runoff water in small forest catchments confirms this finding, as the concentration of nitrate is quite high (> 5 mg l-1) and related with high N deposition ([45]).
Moreover, the realistic nitrogen deposition in Czech forests is likely to be much higher than the modeled values used for our analysis. The N deposition is likely to be substantially underestimated not accounting for several important non-measured compounds, such as NH3 and HNO3 (g), and contribution of occult deposition, as recently shown by Hunová et al. ([16]).
Conclusions
There is a significant influence of N deposition on forest soil in the Czech Republic; between 1995 and 2006, concentration of total N increased in the upper 20 cm of soil. Deposition load exceeded the critical threshold for forest ecosystem in the Czech Republic. The results suggest that N deposition still represents a threat for forest ecosystems in the Czech Republic.
Acknowledgements
For their support we would like to thank the Ministry of Agriculture of the Czech Republic, Projects No. RO0114 (č.j. 8653/ 2014-MZE-17011) and No. QI112A168 (“Forest soil as the determining factor for forest health, biodiversity and the base for forest production, as well as for nonproductive functions”). We also highly appreciate the comments of three anonymous reviewers who substantially enhanced our manuscript. Last but not least we thank Sharon King for proofreading the paper.
References
Gscholar
Gscholar
Gscholar
CrossRef | Gscholar
Gscholar
Online | Gscholar
Gscholar
Gscholar
Gscholar
Gscholar
Gscholar
CrossRef | Gscholar
Gscholar
Online | Gscholar
Gscholar
Gscholar
CrossRef | Gscholar
Gscholar
Gscholar
CrossRef | Gscholar
Gscholar
Authors’ Info
Authors’ Affiliation
Václav Buriánek
Vít Šrámek
Bohumír Lomský
Forestry and Game Management Research Institute, Strnady 136, 252 02 Jílovište (Czech Republic)
Czech Hydrometeorological Institute, Na Šabatce 2050/17, 143 06 Prague (Czech Republic)
Czech Geological Survey, Geologická 6, 152 00 Prague (Czech Republic)
Ekotoxa - Centre for Environment and Land Assessment, Otická 37, 746 01 Opava (Czech Republic)
Silesian University in Opava, Faculty of Philosophy and Science, Masarykova 37, 746 01 Opava (Czech Republic)
Corresponding author
Paper Info
Citation
Novotný R, Buriánek V, Šrámek V, Hunová I, Skorepová I, Zapletal M, Lomský B (2016). Nitrogen deposition and its impact on forest ecosystems in the Czech Republic - change in soil chemistry and ground vegetation. iForest 10: 48-54. - doi: 10.3832/ifor1847-009
Academic Editor
Elena Paoletti
Paper history
Received: Sep 01, 2015
Accepted: Mar 11, 2016
First online: Jun 29, 2016
Publication Date: Feb 28, 2017
Publication Time: 3.67 months
Copyright Information
© SISEF - The Italian Society of Silviculture and Forest Ecology 2016
Open Access
This article is distributed under the terms of the Creative Commons Attribution-Non Commercial 4.0 International (https://creativecommons.org/licenses/by-nc/4.0/), which permits unrestricted use, distribution, and reproduction in any medium, provided you give appropriate credit to the original author(s) and the source, provide a link to the Creative Commons license, and indicate if changes were made.

Web Metrics
Breakdown by View Type
Article Usage
Total Article Views: 55699
(from publication date up to now)
Breakdown by View Type
HTML Page Views: 45082
Abstract Page Views: 3947
PDF Downloads: 4945
Citation/Reference Downloads: 52
XML Downloads: 1673
Web Metrics
Days since publication: 3516
Overall contacts: 55699
Avg. contacts per week: 110.89
Article Citations
Article citations are based on data periodically collected from the Clarivate Web of Science web site
(last update: Mar 2025)
Total number of cites (since 2017): 19
Average cites per year: 2.11
Publication Metrics
by Dimensions ©
Articles citing this article
List of the papers citing this article based on CrossRef Cited-by.
Related Contents
iForest Similar Articles
Research Articles
Influence of pH, nitrogen and sulphur deposition on species composition of lowland and montane coniferous communities in the Tatrzanski and Slowinski National Parks, Poland
vol. 12, pp. 141-148 (online: 27 February 2019)
Research Articles
Deposition measurements and critical loads calculations: monitoring data, results and perspective
vol. 2, pp. 11-14 (online: 21 January 2009)
Research Articles
Ozone fumigation effects on the morphology and biomass of Norway spruce (Picea abies L.) saplings
vol. 2, pp. 15-18 (online: 21 January 2009)
Research Articles
Soil CO2 efflux in uneven-aged and even-aged Norway spruce stands in southern Finland
vol. 11, pp. 705-712 (online: 06 November 2018)
Research Articles
Effects of arbuscular mycorrhizal fungi on microbial activity and nutrient release are sensitive to acid deposition during litter decomposition in a subtropical Cinnamomum camphora forest
vol. 16, pp. 314-324 (online: 13 November 2023)
Research Articles
Long-term monitoring of air pollution effects on selected forest ecosystems in the Bucegi-Piatra Craiului and Retezat Mountains, southern Carpathians (Romania)
vol. 4, pp. 49-60 (online: 05 April 2011)
Research Articles
Prediction of ozone effects on net ecosystem production of Norway spruce forest
vol. 11, pp. 743-750 (online: 15 November 2018)
Review Papers
Monitoring the effects of air pollution on forest condition in Europe: is crown defoliation an adequate indicator?
vol. 3, pp. 86-88 (online: 15 July 2010)
Research Articles
Response of soil bacterial communities to nitrogen and phosphorus additions in an age-sequence of subtropical forests
vol. 14, pp. 71-79 (online: 11 February 2021)
Research Articles
Impacts of Norway spruce (Picea abies L., H. Karst.) stands on soil in continental Croatia
vol. 12, pp. 511-517 (online: 02 December 2019)
iForest Database Search
Search By Author
Search By Keyword
Google Scholar Search
Citing Articles
Search By Author
Search By Keywords
PubMed Search
Search By Author
Search By Keyword


